Politics
Basic Income Experiments Around the World


Basic Income Experiments Around the World
What if everyone received monthly payments to make life easier and encourage greater economic activity? That’s the exact premise behind Universal Basic Income (UBI).
The idea of UBI as a means to both combat poverty and improve economic prospects has been around for decades. With the COVID-19 pandemic wreaking havoc on economies worldwide, momentum behind the idea has seen a resurgence among certain groups.
Of course, the money to fund basic income programs has to come from somewhere. UBI relies heavily on government budgets or direct funding to cover the regular payments.
As policymakers examine this trade-off between government spending and the potential benefits, there is a growing pool of data to draw inferences from. In fact, basic income has been piloted and experimented on all around the world—but with a mixed bag of results.
What Makes Basic Income Universal?
UBI operates by giving people the means to meet basic necessities with a regular stipend. In theory, this leaves them free to spend their money and resources on economic goods, or searching for better employment options.
Before examining the programs, it’s important to make a distinction between basic income and universal basic income.

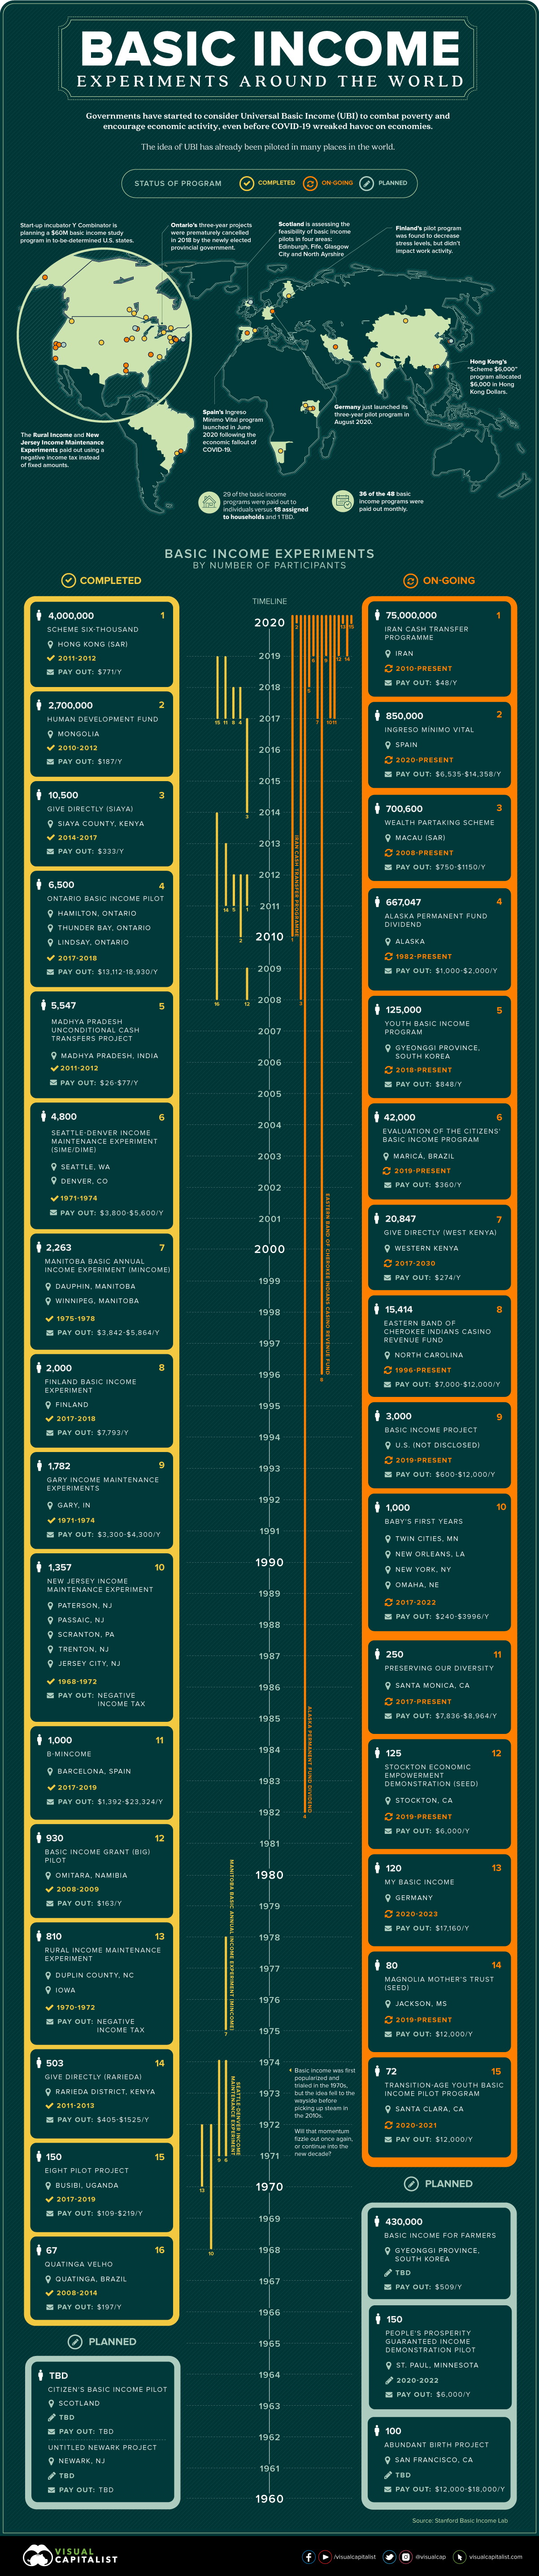
With these parameters in mind, and thanks to data from the Stanford Basic Income Lab, we’ve mapped 48 basic income programs that demonstrate multiple features of UBI and are regularly cited in basic income policy.
Some mapped programs are past experiments used to evaluate basic income. Others are ongoing or new pilots, including recently launched programs in Germany and Spain.
Recently, Canada joined the list as countries considering UBI as a top policy priority in a post-COVID world. But as past experiments show, ideas around basic income can be implemented in many different ways.
Basic Income Programs Took Many Forms
Basic income pilots have seen many iterations across the globe. Many paid out in U.S. dollars, while others chose to stick with local currencies (marked by an asterisk for estimated USD value).
| Program | Location | Recipients | Payment Frequency | Amount ($US/yr) | Dates |
|---|---|---|---|---|---|
| Abundant Birth Project | San Francisco, U.S. | 100 | Monthly | $12,000-$18,000 | TBD |
| Alaska Permanent Fund Dividend | Alaska, U.S. | 667,047 | Annually | $1,000-$2,000 | 1982-Present |
| B-MINCOME | Barcelona, Spain | 1,000 | Monthly | $1,392-$23,324* | 2017-2019 |
| Baby's First Years | New York, U.S. | 1,000 | Monthly | $240-$3,996 | 2017-2022 |
| Baby's First Years | New Orleans, U.S. | 1,000 | Monthly | $240-$3,996 | 2017-2022 |
| Baby's First Years | Omaha, U.S. | 1,000 | Monthly | $240-$3,996 | 2017-2022 |
| Baby's First Years | Twin Cities, U.S. | 1,000 | Monthly | $240-$3,996 | 2017-2022 |
| Basic Income for Farmers | Gyeonggi Province, South Korea | 430,000 | Annually | $509* | TBD |
| Basic Income Grant (BIG) Pilot | Omitara, Namibia | 930 | Monthly | $163* | 2008-2009 |
| Basic Income Project | Not Disclosed | 3,000 | Monthly | $600-$12,000 | 2019-Present |
| Eastern Band of Cherokee Indians Casino Revenue Fund | Jackson County and area, NC, U.S. | 15,414 | Biannually | $7,000-$12,000 | 1996-Present |
| Eight Pilot Project | Busibi, Uganda | 150 | Monthly | $110-$219* | 2017-2019 |
| Evaluation of the Citizens' Basic Income Program | Maricá, Brazil | 42,000 | Monthly | $360* | 2019-Present |
| Finland Basic Income Experiment | Finland | 2,000 | Monthly | $7,793* | 2017-2018 |
| Gary Income Maintenance Experiments | Gary, U.S. | 1,782 | Monthly | $3,300-$4,300 | 1971-1974 |
| Give Directly | Western Kenya | 20,847 | Monthly or Lump Sum | $274 | 2017-2030 |
| Give Directly | Saiya County, Kenya | 10,500 | Lump Sum | $333 | 2014-2017 |
| Give Directly | Rarieda District, Kenya | 503 | Monthly or Lump Sum | $405-$1,525 | 2011-2013 |
| Human Development Fund | Mongolia | 2,700,000 | Monthly | $187 | 2010-2012 |
| Ingreso Mínimo Vital | Spain | 850,000 | Monthly | $6,535-$14,358* | 2020-Present |
| Iran Cash Transfer Programme | Iran | 75,000,000 | Monthly | $48 | 2010-Present |
| Madhya Pradesh Unconditional Cash Transfers Project | Madhya Pradesh, India | 5,547 | Monthly | $26-$77* | 2011-2012 |
| Magnolia Mother's Trust | Jackson, MS, U.S. | 80 | Monthly | $12,000 | 2019-Present |
| Manitoba Basic Annual Income Experiment | Winnipeg, Canada | 1,677 | Monthly | $3,842-$5,864* | 1975-1978 |
| Manitoba Basic Annual Income Experiment | Dauphin, Canada | 586 | Monthly | $3,842-$5,864* | 1975-1978 |
| My Basic Income | Germany | 120 | Monthly | $17,160* | 2020-2023 |
| New Jersey Income Maintenance Experiment | Jersey City, U.S. | 1,357 | Biweekly | Varied | 1968-1972 |
| New Jersey Income Maintenance Experiment | Paterson, NJ, U.S. | 1,357 | Biweekly | Varied | 1968-1972 |
| New Jersey Income Maintenance Experiment | Passaic, NJ, U.S. | 1,357 | Biweekly | Varied | 1968-1972 |
| New Jersey Income Maintenance Experiment | Trenton, NJ, U.S. | 1,357 | Biweekly | Varied | 1968-1972 |
| New Jersey Income Maintenance Experiment | Scranton, PA, U.S. | 1,357 | Biweekly | Varied | 1968-1972 |
| Ontario Basic Income Pilot | Hamilton and area, Canada | 2,748 | Monthly | $13,112-$18,930* (-50% income) | 2017-2018 |
| Ontario Basic Income Pilot | Thunder Bay and area, Canada | 1,908 | Monthly | $13,112-$18,930* (-50% income) | 2017-2018 |
| Ontario Basic Income Pilot | Lindsay, Canada | 1,844 | Monthly | $13,112-$18,930* (-50% income) | 2017-2018 |
| Preserving Our Diversity | Santa Monica, U.S. | 250 | Monthly | $7,836-$8,964 | 2017-Present |
| Quatinga Velho | Quatinga, Mogi das Cruces, Brazil | 67 | Monthly | $197* | 2008-2014 |
| Rural Income Maintenance Experiment | Duplin County, NC, U.S. | 810 | Monthly | Varied (NIT) | 1970-1972 |
| Rural Income Maintenance Experiment | Iowa, U.S. | 810 | Monthly | Varied (NIT) | 1970-1972 |
| Scheme $6,000 | Hong Kong, China | 4,000,000 | Annually | $771* | 2011-2012 |
| Seattle-Denver Income Maintenance Experiment | Seattle, U.S. | 2,042 | Monthly | $3,800-$5,600 | 1971-1982 |
| Seattle-Denver Income Maintenance Experiment | Denver, U.S. | 2,758 | Monthly | $3,800-$5,600 | 1971-1982 |
| Stockton Economic Empowerment Demonstration | Stockton, U.S. | 125 | Monthly | $6,000 | 2019-Present |
| TBD | Newark, U.S. | TBD | Monthly | TBD | TBD |
| Transition-Age Youth Basic Income Pilot Program | Santa Clara, CA, U.S. | 72 | Monthly | $12,000 | 2020-2021 |
| Wealth Partaking Scheme | Macau, China | 700,600 | Annually | $750-$1,150 | 2008-Present |
| Youth Basic Income Program | Gyeonggi Province, South Korea | 125,000 | Quarterly | $848* | 2018-Present |
| Citizen's Basic Income Pilot | Scotland | TBD | Monthly | TBD | TBD |
| People's Prosperity Guaranteed Income Demonstration Pilot | St. Paul, U.S. | 150 | Monthly | $6,000 | 2020-2022 |
Many of the programs meet the classical requirements of UBI. Of the 48 basic income programs tallied above, 75% paid out monthly, and 60% were paid out to individuals.
However, for various reasons, not all of these programs follow UBI requirements. For example, 38% of the basic income programs were paid out to households instead of individuals, and many programs have paid out in lump sums or over varying time frames.
Interestingly, the need for better understanding of basic income has resulted in many divergences between programs. Some programs were only targeted at specific groups like South Korea’s Basic Income for Farmers program, while others like the Baby’s First Years program in the U.S. have been experimenting with different dollar amounts in order to evaluate efficiency.
Other experiments based payments made off of the total income of recipients. For example, in the U.S., the Rural Income and New Jersey Income Maintenance Experiments paid out using a negative income tax (return) on earnings, while recipients of Canada’s Ontario Basic Income Pilot received fixed amounts minus 50% of their earned income.
Varying Programs with Varied Results
So is basic income the real deal or a pipe dream? The results are still unclear.
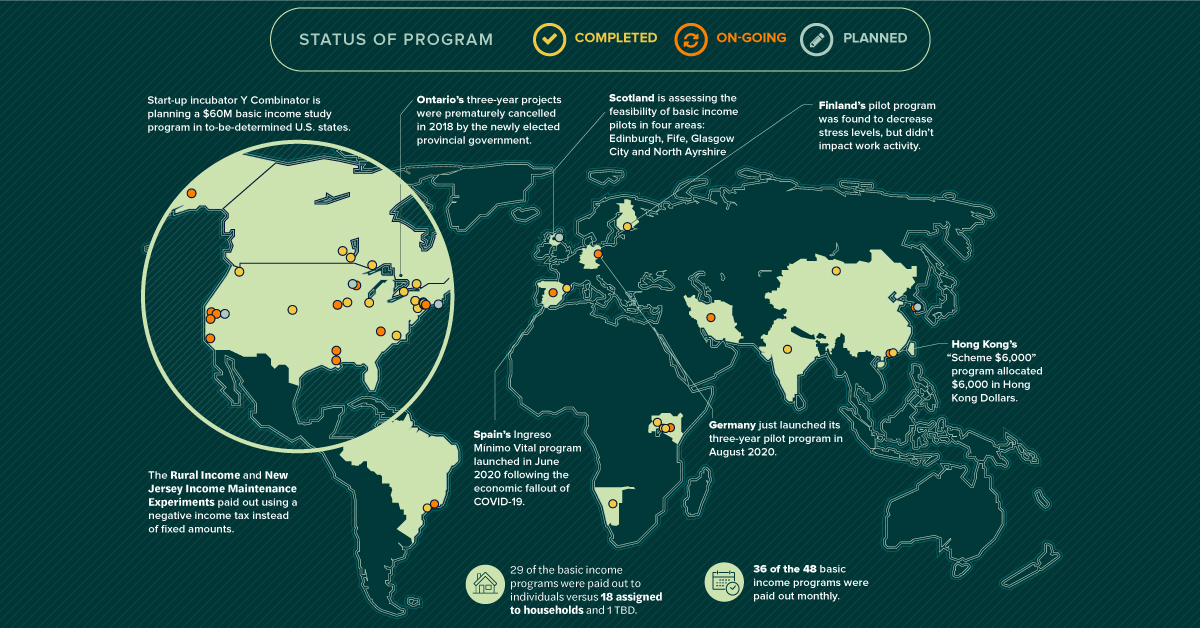
Some, like the initial pilots for Uganda’s Eight program, were found to result in significant multipliers on economic activity and well-being. Other programs, however, returned mixed results that made further experimentation difficult. Finland’s highly-touted pilot program decreased stress levels of recipients across the board, but didn’t positively impact work activity.
The biggest difficulty has been in keeping programs going and securing funding. Ontario’s three-year projects were prematurely cancelled in 2018 before they could be completed and assessed, and the next stages of Finland’s program are in limbo.
Likewise in the U.S., start-up incubator Y Combinator has been planning a $60M basic income study program, but can’t proceed until funding is secured.
A Post-COVID Future for UBI?
In light of COVID-19, basic income has once again taken center stage.
Many countries have already implemented payment schemes or boosted unemployment benefits in reaction to the pandemic. Others like Spain have used that momentum to launch fully-fledged basic income pilots.
It’s still too early to tell if UBI will live up to expectations or if the idea will fizzle out, but as new experiments and policy programs take shape, a growing amount of data will become available for policymakers to evaluate.


United States
Charted: What Southeast Asia Thinks About China & the U.S.
A significant share of respondents from an ASEAN-focused survey are not happy about rising American and Chinese influence in the region.
What Southeast Asia Thinks About China & the U.S.
This was originally posted on our Voronoi app. Download the app for free on iOS or Android and discover incredible data-driven charts from a variety of trusted sources.
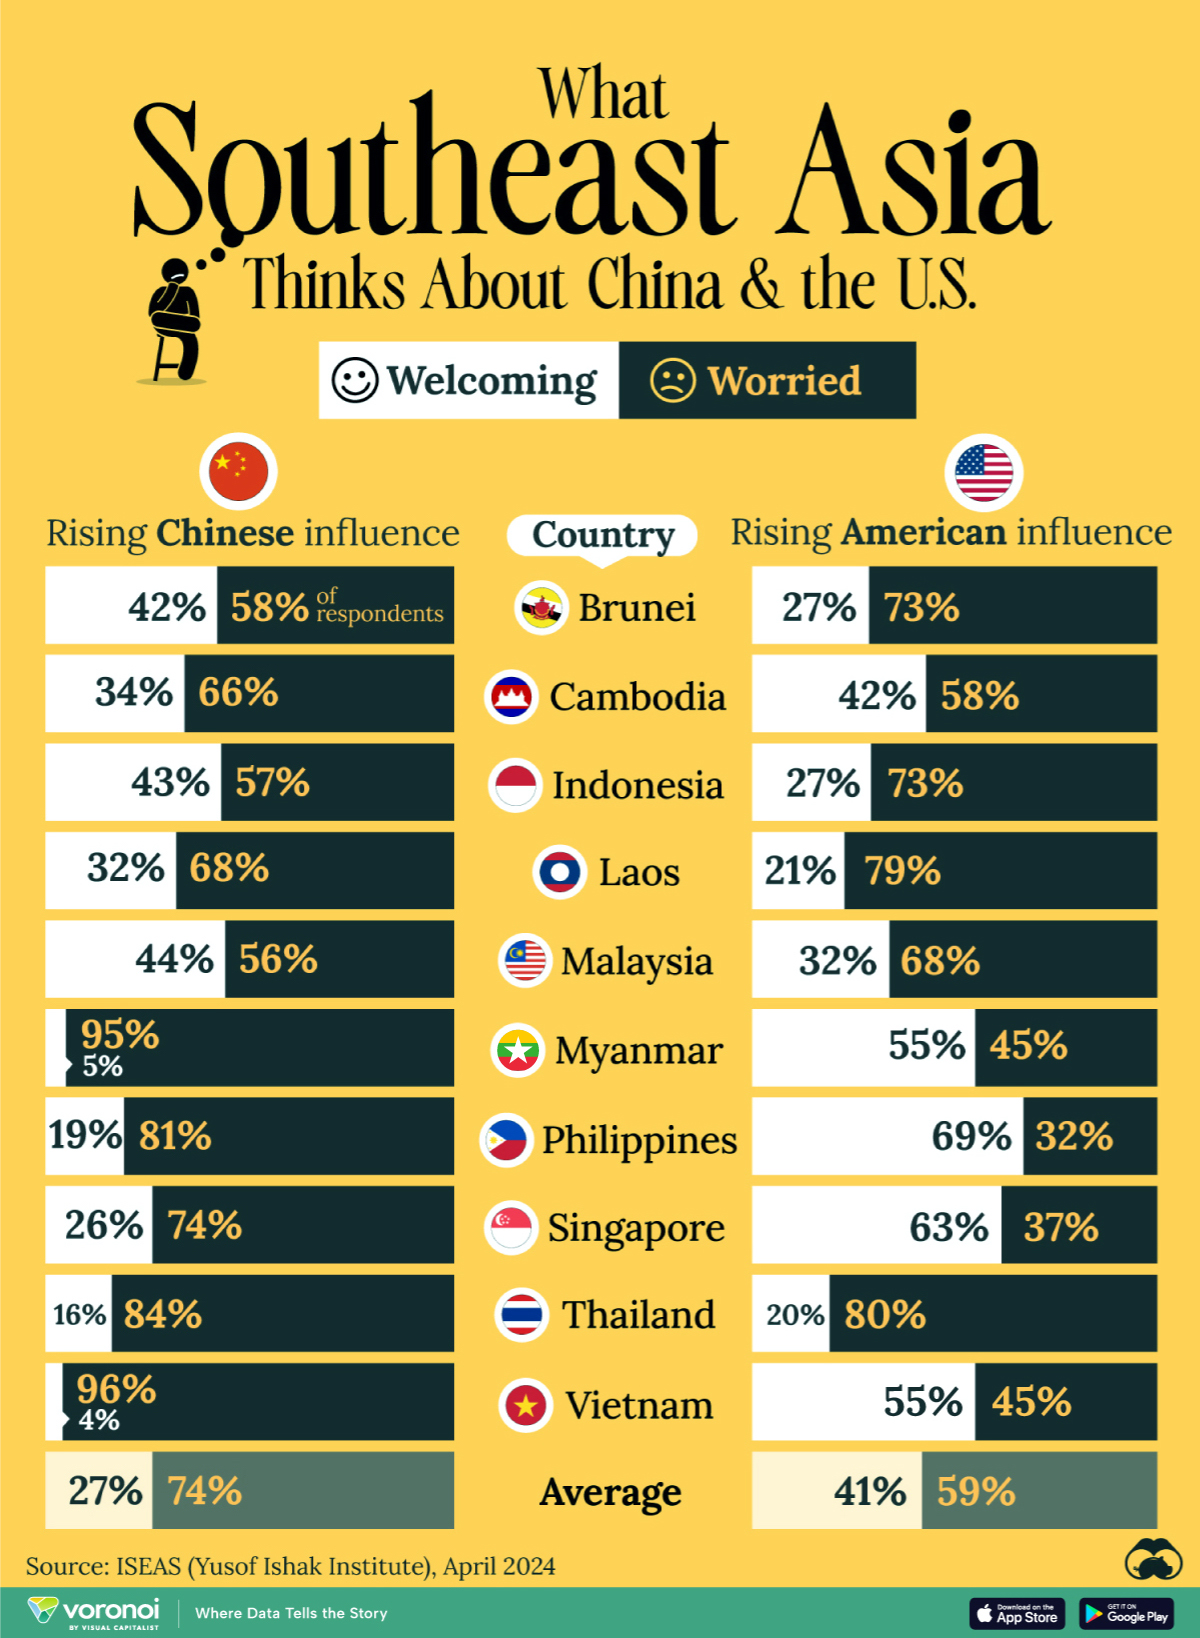
This chart visualizes the results of a 2024 survey conducted by the ASEAN Studies Centre at the ISEAS-Yusof Ishak Institute. Nearly 2,000 respondents were asked if they were worried or welcoming of rising Chinese and American geopolitical influence in their country.
The countries surveyed all belong to the Association of Southeast Asian Nations (ASEAN), a political and economic union of 10 states in Southeast Asia.
Feelings Towards China
On average, a significant share of respondents from all 10 countries are worried about rising influence from both the U.S. and China.
However, overall skepticism is higher for China, at 74% (versus 59% for U.S.).
| Country | Worried About Growing 🇨🇳 Influence | Welcome Growing 🇨🇳 Influence |
|---|---|---|
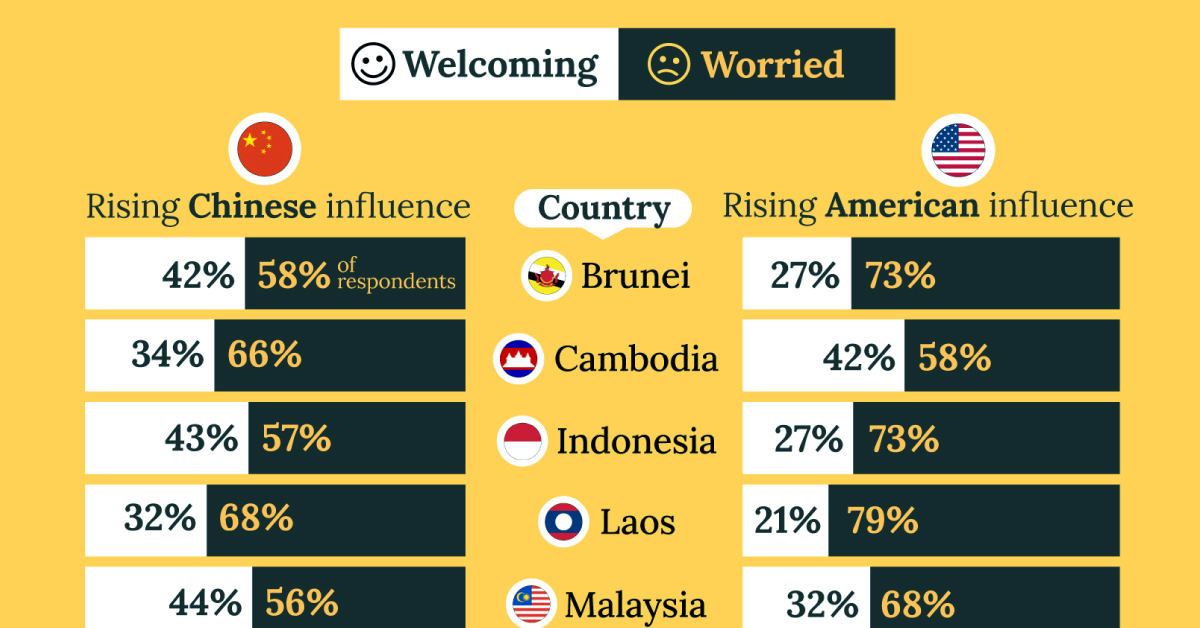
| 🇧🇳 Brunei | 58% | 42% |
| 🇰🇭 Cambodia | 66% | 34% |
| 🇮🇩 Indonesia | 57% | 43% |
| 🇱🇦 Laos | 68% | 32% |
| 🇲🇾 Malaysia | 56% | 44% |
| 🇲🇲 Myanmar | 95% | 5% |
| 🇵🇭 Philippines | 81% | 19% |
| 🇸🇬 Singapore | 74% | 26% |
| 🇹🇭 Thailand | 84% | 16% |
| 🇻🇳 Vietnam | 96% | 4% |
| Average | 74% | 27% |
The recently-cooled but still active territorial concerns over the South China Sea may play a significant role in these responses, especially in countries which are also claimants over the sea.
For example, in Vietnam over 95% of respondents said they were worried about China’s growing influence.
Feelings Towards America
Conversely, rising American influence is welcomed in two countries with competing claims in the South China Sea, the Philippines (69%) and Vietnam (55%).
| Country | Worried About Growing 🇺🇸 Influence | Welcome Growing 🇺🇸 Influence |
|---|---|---|
| 🇧🇳 Brunei | 73% | 27% |
| 🇰🇭 Cambodia | 58% | 42% |
| 🇮🇩 Indonesia | 73% | 27% |
| 🇱🇦 Laos | 79% | 21% |
| 🇲🇾 Malaysia | 68% | 32% |
| 🇲🇲 Myanmar | 45% | 55% |
| 🇵🇭 Philippines | 32% | 69% |
| 🇸🇬 Singapore | 37% | 63% |
| 🇹🇭 Thailand | 80% | 20% |
| 🇻🇳 Vietnam | 45% | 55% |
| Average | 59% | 41% |
Despite this, on a regional average, more respondents worry about growing American influence (59%) than they welcome it (41%).
Interestingly, it seems almost every ASEAN nation has a clear preference for one superpower over the other.
The only exception is Thailand, where those surveyed were not a fan of either option, with 84% worried about China, and 80% worried about the U.S.

-

 Markets5 days ago
The World’s Fastest Growing Emerging Markets (2024-2029 Forecast)
-

 Technology2 weeks ago
All of the Grants Given by the U.S. CHIPS Act
-

 Green2 weeks ago
The Carbon Footprint of Major Travel Methods
-

 United States2 weeks ago
Visualizing the Most Common Pets in the U.S.
-

 Culture2 weeks ago
The World’s Top Media Franchises by All-Time Revenue
-

 Best of1 week ago
Best Visualizations of April on the Voronoi App
-

 Wealth1 week ago
Charted: Which Country Has the Most Billionaires in 2024?
-

 Business1 week ago
The Top Private Equity Firms by Country