Markets
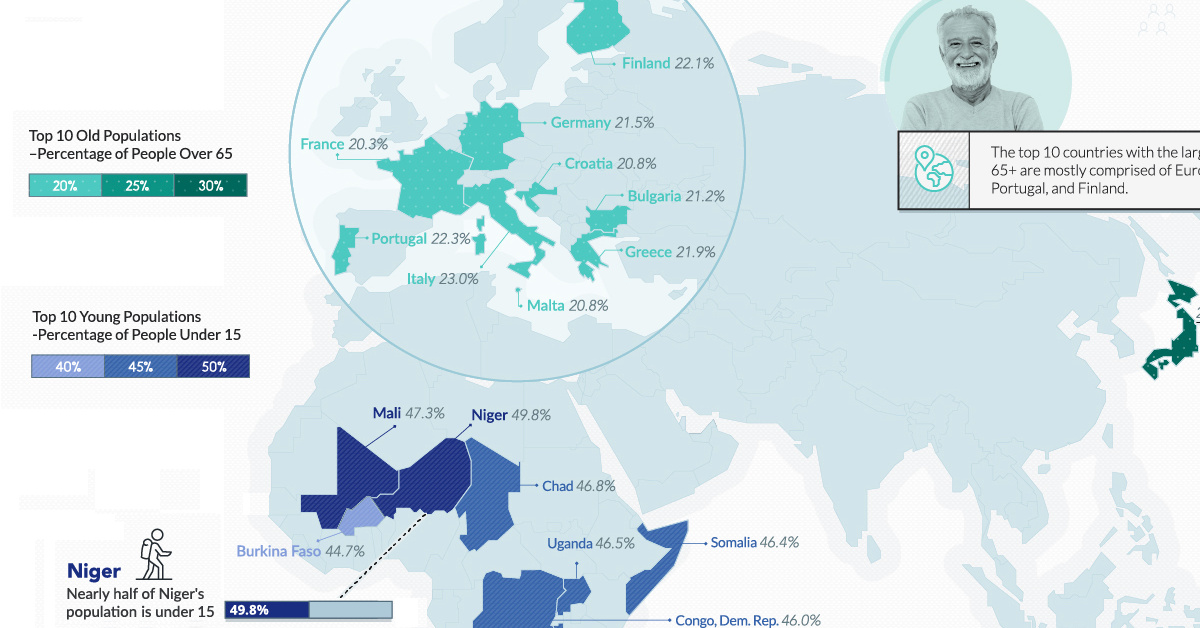
Mapping the World’s Youngest and Oldest Countries
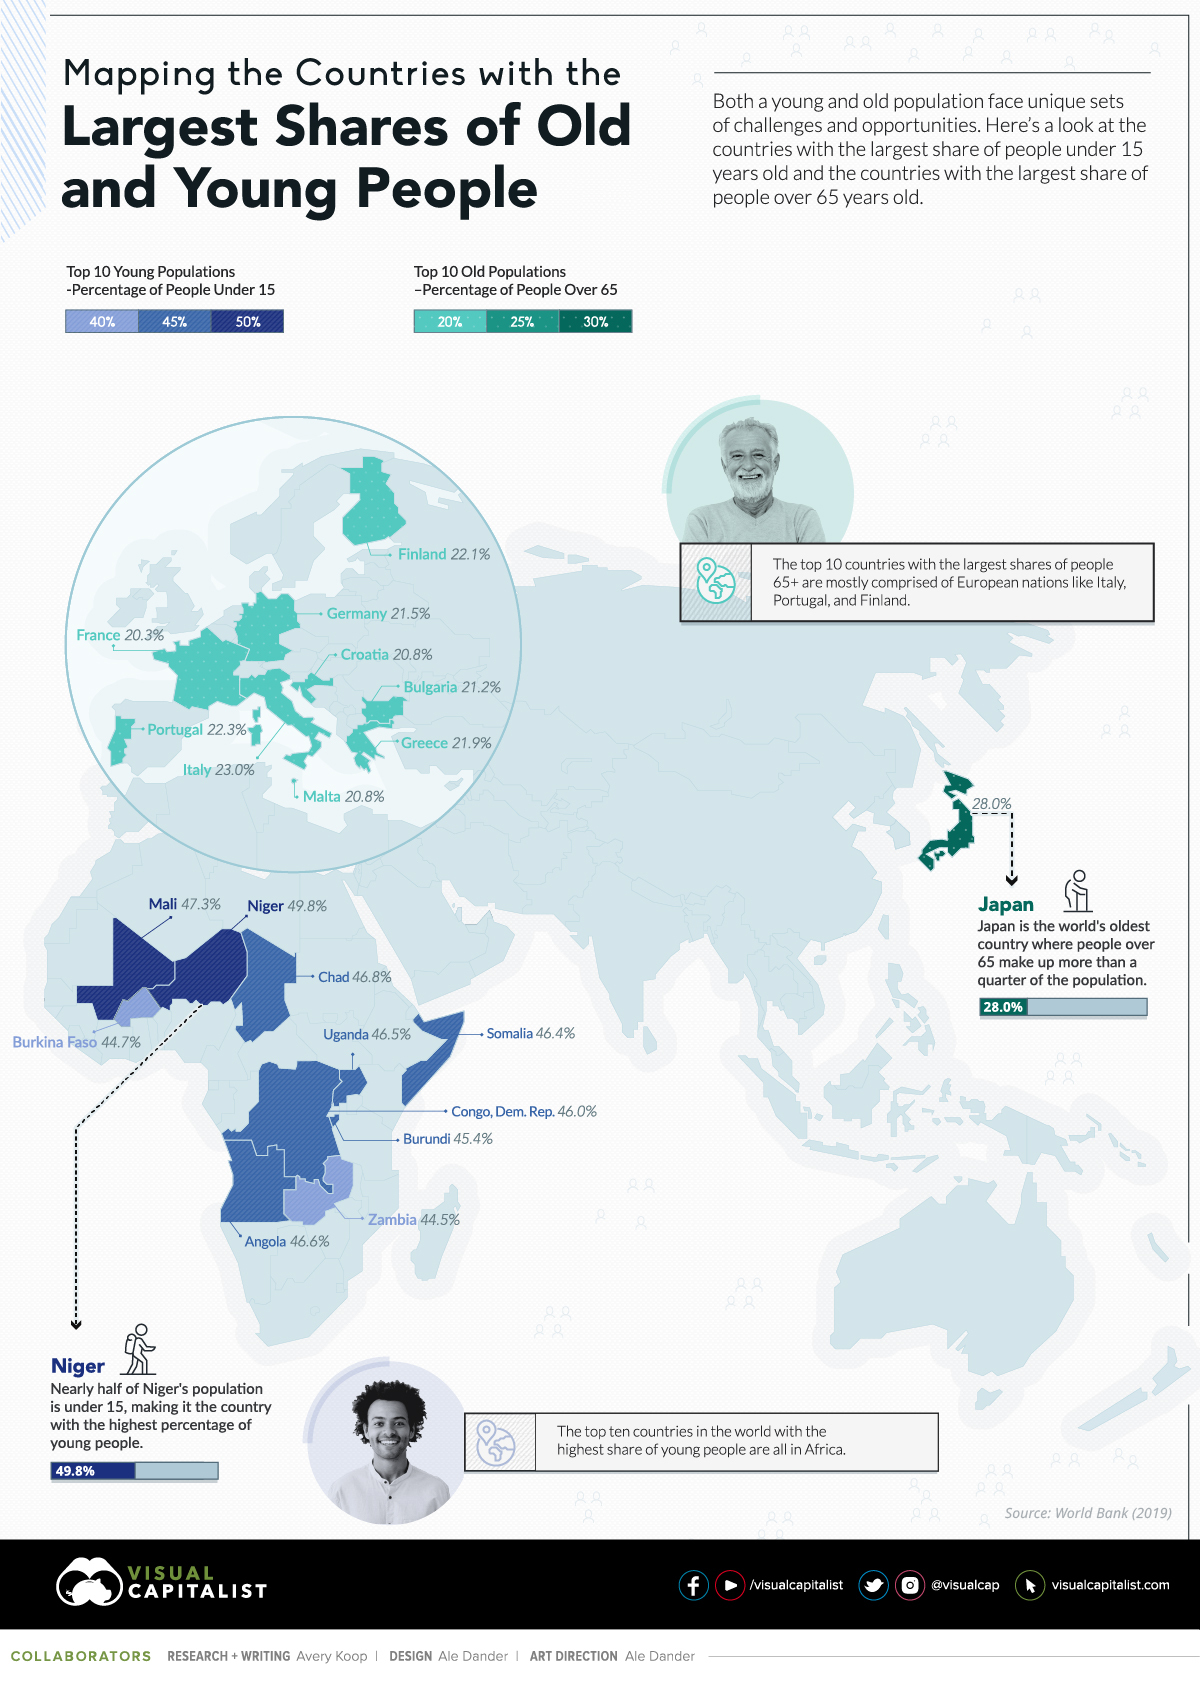


Mapping the World’s Youngest and Oldest Countries
Country age demographics are determined by two key factors: fertility and mortality.
Throughout history, it was typical to see both birth and death rates at higher levels. But today, in most parts of the world, women are having fewer children, and innovations in healthcare and technology mean we are all living longer. The average person today lives to 72.6 years old, while the rate of births per woman has fallen to 2.5.
These trends have drastically altered the demographics of mature economies, resulting in a much older population. In many developing countries, however, births still outweigh deaths, resulting in populations that skew younger.
This visualization uses data from the World Bank to examine the countries with the highest shares of old and young people.
The Fountain of Youth
By 2030, the United Nations estimates there will be 1.3 billion people on the planet between the ages of 15-24. Proving to be a fountain of youth globally, the continent of Africa boasts the top 10 countries with the largest shares of young people in the world.
Somalia, Zambia, and the DRC are just a few to crack the top 10 list. The youngest country in the world is Niger, where almost 50% of the population is below the age of 15.
Here’s a full list of global countries, sorted by percentage of population under 15 years old:
| Country | Share of Population Younger Than 15 (% of total, 2019) |
|---|---|
| 🇳🇪 Niger | 49.8% |
| 🇲🇱 Mali | 47.3% |
| 🇹🇩 Chad | 46.8% |
| 🇦🇴 Angola | 46.6% |
| 🇺🇬 Uganda | 46.5% |
| 🇸🇴 Somalia | 46.4% |
| 🇨🇩 Congo, Dem. Rep. | 46.0% |
| 🇧🇮 Burundi | 45.4% |
| 🇧🇫 Burkina Faso | 44.7% |
| 🇿🇲 Zambia | 44.5% |
| 🇲🇿 Mozambique | 44.4% |
| 🇬🇲 The Gambia | 44.1% |
| 🇹🇿 Tanzania | 43.8% |
| 🇳🇬 Nigeria | 43.7% |
| 🇲🇼 Malawi | 43.5% |
| 🇬🇳 Guinea | 43.4% |
| 🇸🇳 Senegal | 42.8% |
| 🇦🇫 Afghanistan | 42.5% |
| 🇨🇲 Cameroon | 42.4% |
| 🇧🇯 Benin | 42.2% |
| 🇬🇼 Guinea-Bissau | 42.2% |
| 🇿🇼 Zimbabwe | 42.2% |
| 🇸🇹 Sao Tome and Principe | 42.1% |
| 🇨🇮 Cote d'Ivoire | 41.7% |
| 🇸🇸 South Sudan | 41.6% |
| 🇨🇬 Congo | 41.5% |
| 🇹🇬 Togo | 41.0% |
| 🇱🇷 Liberia | 40.8% |
| 🇸🇱 Sierra Leone | 40.7% |
| 🇲🇬 Madagascar | 40.4% |
| 🇪🇹 Ethiopia | 40.3% |
| 🇸🇩 Sudan | 40.2% |
| 🇸🇧 Solomon Islands | 40.1% |
| 🇲🇷 Mauritania | 39.9% |
| 🇷🇼 Rwanda | 39.8% |
| 🇰🇲 Comoros | 39.3% |
| 🇰🇪 Kenya | 39.2% |
| 🇾🇪 Yemen | 39.2% |
| 🇻🇺 Vanuatu | 38.7% |
| 🇮🇶 Iraq | 38.0% |
| 🇼🇸 Samoa | 37.9% |
| 🇸🇿 Eswatini | 37.8% |
| 🇬🇭 Ghana | 37.4% |
| 🇹🇱 Timor-Leste | 37.3% |
| 🇬🇦 Gabon | 37.2% |
| 🇹🇯 Tajikistan | 37.1% |
| 🇬🇶 Equatorial Guinea | 37.0% |
| 🇳🇦 Namibia | 36.9% |
| 🇰🇮 Kiribati | 35.8% |
| 🇵🇬 Papua New Guinea | 35.5% |
| 🇵🇰 Pakistan | 35.1% |
| 🇹🇴Tonga | 35.1% |
| 🇬🇹 Guatemala | 33.9% |
| 🇧🇼 Botswana | 33.8% |
| 🇪🇬 Egypt | 33.8% |
| 🇯🇴 Jordan | 33.6% |
| 🇭🇹 Haiti | 32.9% |
| 🇰🇬 Kyrgyzstan | 32.5% |
| 🇱🇸 Lesotho | 32.5% |
| 🇱🇦 Laos | 32.3% |
| 🇫🇲 Micronesia | 31.5% |
| 🇭🇳 Honduras | 31.2% |
| 🇰🇭 Cambodia | 31.1% |
| 🇸🇾 Syria | 31.1% |
| 🇲🇳 Mongolia | 30.8% |
| 🇹🇲 Turkmenistan | 30.8% |
| 🇧🇴 Bolivia | 30.6% |
| 🇩🇿 Algeria | 30.6% |
| 🇵🇭 Philippines | 30.5% |
| 🇳🇮 Nicaragua | 29.9% |
| 🇧🇿 Belize | 29.7% |
| 🇳🇵 Nepal | 29.6% |
| 🇫🇯 Fiji | 29.3% |
| 🇩🇯 Djibouti | 29.2% |
| 🇵🇾 Paraguay | 29.2% |
| 🇿🇦 South Africa | 29.0% |
| 🇰🇿 Kazakhstan | 28.9% |
| 🇺🇿 Uzbekistan | 28.8% |
| 🇨🇻 Cape Verde | 28.4% |
| 🇱🇾 Libya | 28.1% |
| 🇬🇾 Guyana | 27.9% |
| 🇮🇱 Israel | 27.9% |
| 🇩🇴 Dominican Republic | 27.7% |
| 🇪🇨 Ecuador | 27.7% |
| 🇻🇪 Venezuela | 27.4% |
| 🇧🇩 Bangladesh | 27.2% |
| 🇲🇦 Morocco | 27.0% |
| 🇸🇻 El Salvador | 26.9% |
| 🇸🇷 Suriname | 26.9% |
| 🇵🇦 Panama | 26.8% |
| 🇮🇳 India | 26.6% |
| 🇮🇩 Indonesia | 26.2% |
| 🇲🇽 Mexico | 26.2% |
| 🇲🇲 Myanmar | 25.9% |
| 🇱🇧 Lebanon | 25.6% |
| 🇧🇹 Bhutan | 25.3% |
| 🇵🇪 Peru | 25.3% |
| 🇸🇦 Saudi Arabia | 24.9% |
| 🇮🇷 Iran | 24.7% |
| 🇦🇷 Argentina | 24.6% |
| 🇹🇷 Turkey | 24.3% |
| 🇹🇳 Tunisia | 24.2% |
| 🇬🇺 Guam | 24.1% |
| 🇱🇰 Sri Lanka | 24.0% |
| 🇬🇩 Grenada | 23.7% |
| 🇲🇾 Malaysia | 23.7% |
| 🇸🇨 Seychelles | 23.7% |
| 🇯🇲 Jamaica | 23.5% |
| 🇦🇿Azerbaijan | 23.4% |
| 🇻🇳 Vietnam | 23.2% |
| 🇧🇳 Brunei | 22.6% |
| 🇨🇴 Colombia | 22.6% |
| 🇵🇫 French Polynesia | 22.6% |
| 🇳🇨 New Caledonia | 22.4% |
| 🇴🇲 Oman | 22.4% |
| 🇻🇨 St. Vincent and the Grenadines | 22.2% |
| 🇧🇸 Bahamas | 22.1% |
| 🇦🇬 Antigua and Barbuda | 22.0% |
| 🇰🇼 Kuwait | 21.6% |
| 🇮🇪 Ireland | 21.2% |
| 🇨🇷 Costa Rica | 21.1% |
| 🇧🇷 Brazil | 21.0% |
| 🇦🇲 Armenia | 20.8% |
| 🇺🇾 Uruguay | 20.5% |
| 🇹🇹 Trinidad and Tobago | 20.3% |
| 🇬🇪 Georgia | 20.0% |
| 🇰🇵 North Korea | 20.0% |
| 🇲🇻 Maldives | 19.9% |
| 🇮🇸 Iceland | 19.6% |
| 🇳🇿 New Zealand | 19.6% |
| 🇨🇱 Chile | 19.5% |
| 🇻🇮 U.S. Virgin Islands | 19.5% |
| 🇦🇺 Australia | 19.3% |
| 🇧🇭 Bahrain | 18.7% |
| 🇨🇼 Curacao | 18.5% |
| 🇺🇸 United States | 18.5% |
| 🇱🇨 St. Lucia | 18.2% |
| 🇲🇪 Montenegro | 18.2% |
| 🇷🇺 Russia | 18.2% |
| 🇨🇳 China | 17.8% |
| 🇫🇷 France | 17.8% |
| 🇬🇧 United Kingdom | 17.7% |
| 🇦🇼 Aruba | 17.6% |
| 🇸🇪 Sweden | 17.6% |
| 🇦🇱 Albania | 17.4% |
| 🇳🇴 Norway | 17.4% |
| 🇲🇺 Mauritius | 17.3% |
| 🇧🇪 Belgium | 17.1% |
| 🇧🇧 Barbados | 17.1% |
| 🇧🇾 Belarus | 17.0% |
| 🇹🇭 Thailand | 16.8% |
| 🇨🇾 Cyprus | 16.7% |
| 🇪🇪 Estonia | 16.5% |
| 🇩🇰 Denmark | 16.4% |
| 🇲🇰 North Macedonia | 16.4% |
| 🇱🇻 Latvia | 16.3% |
| 🇵🇷 Puerto Rico | 16.3% |
| 🇨🇺 Cuba | 16.0% |
| 🇫🇮 Finland | 16.0% |
| 🇲🇩 Moldova | 15.9% |
| 🇳🇱 Netherlands | 15.9% |
| 🇺🇦 Ukraine | 15.9% |
| 🇨🇦 Canada | 15.8% |
| 🇨🇿 Czech Republic | 15.7% |
| 🇱🇺 Luxembourg | 15.7% |
| 🇷🇴 Romania | 15.6% |
| 🇷🇸 Serbia | 15.5% |
| 🇸🇰 Slovakia | 15.5% |
| 🇵🇱 Poland | 15.2% |
| Channel Islands | 15.1% |
| 🇱🇹 Lithuania | 15.1% |
| 🇸🇮 Slovenia | 15.1% |
| 🇨🇭 Switzerland | 14.9% |
| 🇦🇪 United Arab Emirates | 14.7% |
| 🇧🇬 Bulgaria | 14.7% |
| 🇧🇦 Bosnia and Herzegovina | 14.7% |
| 🇪🇸 Spain | 14.6% |
| 🇭🇷 Croatia | 14.6% |
| 🇦🇹 Austria | 14.4% |
| 🇭🇺 Hungary | 14.4% |
| 🇲🇹 Malta | 14.3% |
| 🇲🇴 Macao SAR, China | 14.0% |
| 🇬🇷 Greece | 13.9% |
| 🇩🇪 Germany | 13.8% |
| 🇶🇦 Qatar | 13.6% |
| 🇵🇹 Portugal | 13.3% |
| 🇮🇹 Italy | 13.2% |
| 🇰🇷 South Korea | 12.7% |
| 🇯🇵 Japan | 12.6% |
| 🇭🇰 Hong Kong SAR, China | 12.3% |
| 🇸🇬 Singapore | 12.3% |
Young countries have significant opportunities ahead of them. A younger population means a larger upcoming workforce and more opportunities for innovation and economic growth.
While domestic markets in Africa grow in terms of labor supply, innovation, and potential consumers, there are also challenges that arise in these countries. Corruption, political instability and unemployment, particularly in Africa, are all potential barriers to prosperity for the continent’s Gen Z population.
Populations Skewing Older
The world’s oldest country is Japan, where 28% of the population is older than 65. However, it’s an anomaly—the rest of the oldest countries in the top 10 are all in Europe.
Globally, it’s the 65+ age group that is growing the fastest. According to the same UN estimates, it is predicted that by 2050 that one in six people will be over 65 years old.
Here’s a full list of global countries, sorted by percentage of population over 65 years old:
| Country | Share of Population Older Than 65 (% of total, 2019) |
|---|---|
| 🇯🇵 Japan | 28.0% |
| 🇮🇹 Italy | 23.0% |
| 🇵🇹 Portugal | 22.4% |
| 🇫🇮 Finland | 22.1% |
| 🇬🇷 Greece | 21.9% |
| 🇩🇪 Germany | 21.5% |
| 🇧🇬 Bulgaria | 21.2% |
| 🇭🇷 Croatia | 20.8% |
| 🇲🇹 Malta | 20.8% |
| 🇫🇷 France | 20.3% |
| 🇱🇻 Latvia | 20.3% |
| 🇸🇪 Sweden | 20.1% |
| 🇸🇮 Slovenia | 20.1% |
| 🇱🇹 Lithuania | 20.1% |
| 🇪🇪 Estonia | 19.9% |
| 🇩🇰 Denmark | 19.9% |
| 🇻🇮 U.S. Virgin Islands | 19.8% |
| 🇨🇿 Czech Republic | 19.8% |
| 🇵🇷 Puerto Rico | 19.6% |
| 🇭🇺 Hungary | 19.6% |
| 🇪🇸 Spain | 19.6% |
| 🇳🇱 Netherlands | 19.6% |
| 🇦🇹 Austria | 19.0% |
| 🇧🇪 Belgium | 19.0% |
| 🇨🇭 Switzerland | 18.8% |
| 🇷🇴 Romania | 18.7% |
| 🇷🇸 Serbia | 18.7% |
| 🇬🇧 United Kingdom | 18.5% |
| 🇵🇱 Poland | 18.1% |
| 🇨🇦 Canada | 17.6% |
| Channel Islands | 17.6% |
| 🇭🇰 Hong Kong SAR, China | 17.4% |
| 🇳🇴 Norway | 17.2% |
| 🇧🇦 Bosnia and Herzegovina | 17.2% |
| 🇨🇼 Curaçao | 17.1% |
| 🇺🇦 Ukraine | 16.7% |
| 🇧🇧 Barbados | 16.2% |
| 🇺🇸 United States | 16.2% |
| 🇸🇰 Slovakia | 16.1% |
| 🇳🇿 New Zealand | 15.9% |
| 🇦🇺 Australia | 15.9% |
| 🇨🇺 Cuba | 15.5% |
| 🇲🇪 Montenegro | 15.3% |
| 🇧🇾 Belarus | 15.2% |
| 🇮🇸 Iceland | 15.1% |
| 🇷🇺 Russia | 15.0% |
| 🇬🇪 Georgia | 15.0% |
| 🇰🇷 South Korea | 15.0% |
| 🇺🇾 Uruguay | 14.9% |
| 🇱🇺 Luxembourg | 14.2% |
| 🇮🇪 Ireland | 14.2% |
| 🇦🇱 Albania | 14.2% |
| 🇲🇰 North Macedonia | 14.0% |
| 🇦🇼 Aruba | 14.0% |
| 🇨🇾 Cyprus | 14.0% |
| 🇹🇭 Thailand | 12.4% |
| 🇸🇬 Singapore | 12.3% |
| 🇮🇱 Israel | 12.2% |
| 🇲🇩 Moldova | 12.0% |
| 🇲🇺 Mauritius | 11.9% |
| 🇨🇱 Chile | 11.8% |
| 🇦🇲 Armenia | 11.4% |
| 🇨🇳 China | 11.4% |
| 🇦🇷 Argentina | 11.2% |
| 🇲🇴 Macao SAR, China | 11.2% |
| 🇹🇹 Trinidad and Tobago | 11.1% |
| 🇱🇰 Sri Lanka | 10.8% |
| 🇬🇺 Guam | 10.1% |
| 🇱🇨 St. Lucia | 10.0% |
| 🇨🇷 Costa Rica | 9.8% |
| 🇻🇨 St. Vincent and the Grenadines | 9.7% |
| 🇬🇩 Grenada | 9.6% |
| 🇳🇨 New Caledonia | 9.4% |
| 🇰🇵 North Korea | 9.2% |
| 🇧🇷 Brazil | 9.2% |
| 🇦🇬 Antigua and Barbuda | 9.0% |
| 🇯🇲 Jamaica | 8.9% |
| 🇨🇴 Colombia | 8.7% |
| 🇹🇷 Turkey | 8.7% |
| 🇵🇫 French Polynesia | 8.6% |
| 🇹🇳 Tunisia | 8.5% |
| 🇸🇻 El Salvador | 8.4% |
| 🇵🇪 Peru | 8.3% |
| 🇵🇦 Panama | 8.3% |
| 🇸🇨 Seychelles | 7.8% |
| 🇰🇿 Kazakhstan | 7.6% |
| 🇻🇪 Venezuela | 7.6% |
| 🇻🇳 Vietnam | 7.5% |
| 🇧🇸 Bahamas | 7.4% |
| 🇲🇽 Mexico | 7.4% |
| 🇪🇨 Ecuador | 7.3% |
| 🇧🇴 Bolivia | 7.3% |
| 🇲🇦 Morocco | 7.3% |
| 🇩🇴 Dominican Republic | 7.2% |
| 🇱🇧 Lebanon | 7.2% |
| 🇸🇷 Suriname | 7.0% |
| 🇲🇾 Malaysia | 6.9% |
| 🇬🇾 Guyana | 6.7% |
| 🇵🇾 Paraguay | 6.6% |
| 🇩🇿 Algeria | 6.5% |
| 🇦🇿 Azerbaijan | 6.4% |
| 🇮🇳 India | 6.3% |
| 🇮🇷 Iran | 6.3% |
| 🇧🇹 Bhutan | 6.0% |
| 🇮🇩 Indonesia | 6.0% |
| 🇲🇲 Myanmar | 6.0% |
| 🇹🇴 Tonga | 5.9% |
| 🇳🇵 Nepal | 5.7% |
| 🇫🇯 Fiji | 5.6% |
| 🇳🇮 Nicaragua | 5.4% |
| 🇿🇦 South Africa | 5.4% |
| 🇵🇭 Philippines | 5.3% |
| 🇪🇬 Egypt | 5.2% |
| 🇧🇳 Brunei | 5.2% |
| 🇧🇩 Bangladesh | 5.1% |
| 🇭🇹 Haiti | 5.0% |
| 🇼🇸 Samoa | 4.9% |
| 🇬🇹 Guatemala | 4.9% |
| 🇱🇸 Lesotho | 4.9% |
| 🇧🇿 Belize | 4.8% |
| 🇭🇳 Honduras | 4.8% |
| 🇰🇭 Cambodia | 4.7% |
| 🇨🇻 Cape Verde | 4.6% |
| 🇸🇾 Syria | 4.6% |
| 🇩🇯 Djibouti | 4.6% |
| 🇰🇬 Kyrgyzstan | 4.6% |
| 🇺🇿 Uzbekistan | 4.5% |
| 🇹🇲 Turkmenistan | 4.5% |
| 🇱🇾 Libya | 4.4% |
| 🇧🇼 Botswana | 4.3% |
| 🇵🇰 Pakistan | 4.3% |
| 🇹🇱 Timor-Leste | 4.2% |
| 🇫🇲 Micronesia | 4.1% |
| 🇲🇳 Mongolia | 4.1% |
| 🇱🇦 Laos | 4.1% |
| 🇰🇮 Kiribati | 4.0% |
| 🇸🇿 Eswatini | 4.0% |
| 🇯🇴 Jordan | 3.8% |
| 🇲🇻 Maldives | 3.6% |
| 🇸🇧 Solomon Islands | 3.6% |
| 🇸🇩 Sudan | 3.6% |
| 🇻🇺 Vanuatu | 3.6% |
| 🇳🇦 Namibia | 3.6% |
| 🇬🇦 Gabon | 3.5% |
| 🇪🇹 Ethiopia | 3.5% |
| 🇵🇬 Papua New Guinea | 3.5% |
| 🇸🇦 Saudi Arabia | 3.4% |
| 🇮🇶 Iraq | 3.3% |
| 🇸🇸 South Sudan | 3.3% |
| 🇱🇷 Liberia | 3.2% |
| 🇧🇯 Benin | 3.2% |
| 🇲🇷 Mauritania | 3.1% |
| 🇸🇳 Senegal | 3.0% |
| 🇬🇭 Ghana | 3.0% |
| 🇹🇯 Tajikistan | 3.0% |
| 🇰🇲 Comoros | 3.0% |
| 🇲🇬 Madagascar | 3.0% |
| 🇷🇼 Rwanda | 3.0% |
| 🇨🇩 Democratic Republic of the Congo | 3.0% |
| 🇿🇼 Zimbabwe | 2.9% |
| 🇸🇹 Sao Tome and Principe | 2.9% |
| 🇸🇱 Sierra Leone | 2.9% |
| 🇬🇳 Guinea | 2.9% |
| 🇾🇪 Yemen | 2.9% |
| 🇸🇴 Somalia | 2.8% |
| 🇹🇬 Togo | 2.8% |
| 🇲🇿 Mozambique | 2.8% |
| 🇨🇮 Cote d'Ivoire | 2.8% |
| 🇬🇼 Guinea-Bissau | 2.8% |
| 🇨🇫 Central African Republic | 2.8% |
| 🇰🇼 Kuwait | 2.7% |
| 🇳🇬 Nigeria | 2.7% |
| 🇨🇲 Cameroon | 2.7% |
| 🇨🇬 Congo | 2.7% |
| 🇲🇼 Malawi | 2.6% |
| 🇹🇿 Tanzania | 2.6% |
| 🇦🇫 Afghanistan | 2.6% |
| 🇳🇪 Niger | 2.5% |
| 🇬🇲 The Gambia | 2.5% |
| 🇧🇭 Bahrain | 2.5% |
| 🇲🇱 Mali | 2.4% |
| 🇹🇩 Chad | 2.4% |
| 🇴🇲 Oman | 2.4% |
| 🇬🇶 Equatorial Guinea | 2.4% |
| 🇰🇪 Kenya | 2.4% |
| 🇧🇫 Burkina Faso | 2.4% |
| 🇧🇮 Burundi | 2.3% |
| 🇦🇴 Angola | 2.1% |
| 🇿🇲 Zambia | 2.1% |
| 🇺🇬 Uganda | 1.9% |
| 🇶🇦 Qatar | 1.5% |
| 🇦🇪 United Arab Emirates | 1.1% |
Fewer births, and a resulting older population, is a trend attributed to the changing lifestyles of women. For example, Japan’s fertility rate has fallen to less than 1.5 children per woman due to modern access to contraceptives and the prioritization of work over marriage and family life.
However, fewer young people also means a smaller workforce on the horizon and a shrinking domestic market. There is also a rising social cost of caring for the elderly, as longer lifespans have resulted in a higher prevalence of chronic diseases and an increasing inability to care for oneself. This can result in an increased tax burden on the diminishing younger, working population.
Another Perspective on the Data
Looking at the data from the opposite angle also reveals information about our world. Here’s a look at the countries with the lowest proportions of younger or older people.
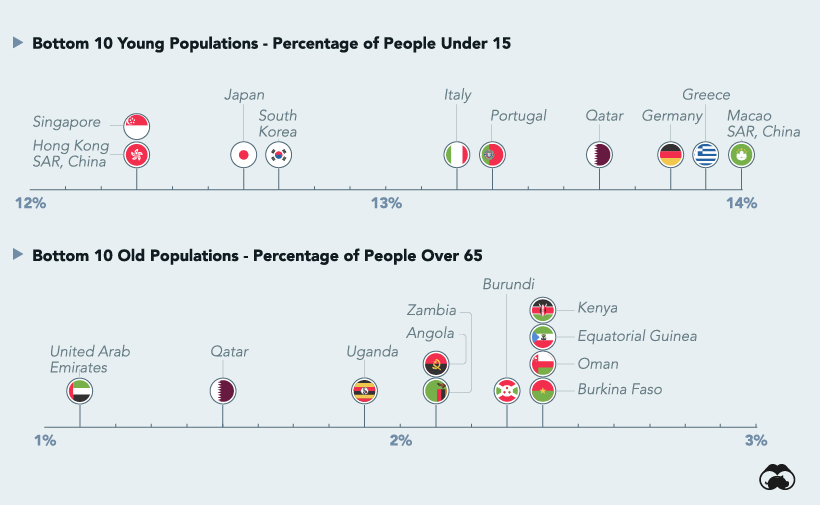
Hong Kong and Singapore have some of the lowest fertility rates in the world (1.1), so it’s no surprise to see low numbers of children in their demographic data.
In a country like the United Arab Emirates, the majority of the population is made up of foreign workers, so the number of people in the 65+ age group is extremely low. In the coming decades though, the situation is expected to shift dramatically with one in every five Emiratis residing that age group by 2050.
The Big Picture
While each country has its own unique demographic make up, one thing is clear. As education and wealth levels rise around the world, fertility rates are dropping almost everywhere.
The trend of long life expectancies and fewer births is likely to continue, but young outliers will remain and they present immense economic potential.


Markets
The European Stock Market: Attractive Valuations Offer Opportunities
On average, the European stock market has valuations that are nearly 50% lower than U.S. valuations. But how can you access the market?


European Stock Market: Attractive Valuations Offer Opportunities
Europe is known for some established brands, from L’Oréal to Louis Vuitton. However, the European stock market offers additional opportunities that may be lesser known.
The above infographic, sponsored by STOXX, outlines why investors may want to consider European stocks.
Attractive Valuations
Compared to most North American and Asian markets, European stocks offer lower or comparable valuations.
| Index | Price-to-Earnings Ratio | Price-to-Book Ratio |
|---|---|---|
| EURO STOXX 50 | 14.9 | 2.2 |
| STOXX Europe 600 | 14.4 | 2 |
| U.S. | 25.9 | 4.7 |
| Canada | 16.1 | 1.8 |
| Japan | 15.4 | 1.6 |
| Asia Pacific ex. China | 17.1 | 1.8 |
Data as of February 29, 2024. See graphic for full index names. Ratios based on trailing 12 month financials. The price to earnings ratio excludes companies with negative earnings.
On average, European valuations are nearly 50% lower than U.S. valuations, potentially offering an affordable entry point for investors.
Research also shows that lower price ratios have historically led to higher long-term returns.
Market Movements Not Closely Connected
Over the last decade, the European stock market had low-to-moderate correlation with North American and Asian equities.
The below chart shows correlations from February 2014 to February 2024. A value closer to zero indicates low correlation, while a value of one would indicate that two regions are moving in perfect unison.
| EURO STOXX 50 | STOXX EUROPE 600 | U.S. | Canada | Japan | Asia Pacific ex. China |
|
|---|---|---|---|---|---|---|
| EURO STOXX 50 | 1.00 | 0.97 | 0.55 | 0.67 | 0.24 | 0.43 |
| STOXX EUROPE 600 | 1.00 | 0.56 | 0.71 | 0.28 | 0.48 | |
| U.S. | 1.00 | 0.73 | 0.12 | 0.25 | ||
| Canada | 1.00 | 0.22 | 0.40 | |||
| Japan | 1.00 | 0.88 | ||||
| Asia Pacific ex. China | 1.00 |
Data is based on daily USD returns.
European equities had relatively independent market movements from North American and Asian markets. One contributing factor could be the differing sector weights in each market. For instance, technology makes up a quarter of the U.S. market, but health care and industrials dominate the broader European market.
Ultimately, European equities can enhance portfolio diversification and have the potential to mitigate risk for investors.
Tracking the Market
For investors interested in European equities, STOXX offers a variety of flagship indices:
| Index | Description | Market Cap |
|---|---|---|
| STOXX Europe 600 | Pan-regional, broad market | €10.5T |
| STOXX Developed Europe | Pan-regional, broad-market | €9.9T |
| STOXX Europe 600 ESG-X | Pan-regional, broad market, sustainability focus | €9.7T |
| STOXX Europe 50 | Pan-regional, blue-chip | €5.1T |
| EURO STOXX 50 | Eurozone, blue-chip | €3.5T |
Data is as of February 29, 2024. Market cap is free float, which represents the shares that are readily available for public trading on stock exchanges.
The EURO STOXX 50 tracks the Eurozone’s biggest and most traded companies. It also underlies one of the world’s largest ranges of ETFs and mutual funds. As of November 2023, there were €27.3 billion in ETFs and €23.5B in mutual fund assets under management tracking the index.
“For the past 25 years, the EURO STOXX 50 has served as an accurate, reliable and tradable representation of the Eurozone equity market.”
— Axel Lomholt, General Manager at STOXX
Partnering with STOXX to Track the European Stock Market
Are you interested in European equities? STOXX can be a valuable partner:
- Comprehensive, liquid and investable ecosystem
- European heritage, global reach
- Highly sophisticated customization capabilities
- Open architecture approach to using data
- Close partnerships with clients
- Part of ISS STOXX and Deutsche Börse Group
With a full suite of indices, STOXX can help you benchmark against the European stock market.
Learn how STOXX’s European indices offer liquid and effective market access.

-

 Economy1 day ago
Economic Growth Forecasts for G7 and BRICS Countries in 2024
The IMF has released its economic growth forecasts for 2024. How do the G7 and BRICS countries compare?
-

 Markets1 week ago
U.S. Debt Interest Payments Reach $1 Trillion
U.S. debt interest payments have surged past the $1 trillion dollar mark, amid high interest rates and an ever-expanding debt burden.
-

 United States1 week ago
Ranked: The Largest U.S. Corporations by Number of Employees
We visualized the top U.S. companies by employees, revealing the massive scale of retailers like Walmart, Target, and Home Depot.
-

 Markets2 weeks ago
The Top 10 States by Real GDP Growth in 2023
This graphic shows the states with the highest real GDP growth rate in 2023, largely propelled by the oil and gas boom.
-

 Markets2 weeks ago
Ranked: The World’s Top Flight Routes, by Revenue
In this graphic, we show the highest earning flight routes globally as air travel continued to rebound in 2023.
-

 Markets2 weeks ago
Ranked: The Most Valuable Housing Markets in America
The U.S. residential real estate market is worth a staggering $47.5 trillion. Here are the most valuable housing markets in the country.

-

 Mining1 week ago
Gold vs. S&P 500: Which Has Grown More Over Five Years?
-
Markets2 weeks ago
Ranked: The Most Valuable Housing Markets in America
-

 Money2 weeks ago
Which States Have the Highest Minimum Wage in America?
-

 AI2 weeks ago
Ranked: Semiconductor Companies by Industry Revenue Share
-
Markets2 weeks ago
Ranked: The World’s Top Flight Routes, by Revenue
-

 Demographics2 weeks ago
Population Projections: The World’s 6 Largest Countries in 2075
-
Markets2 weeks ago
The Top 10 States by Real GDP Growth in 2023
-

 Demographics2 weeks ago
The Smallest Gender Wage Gaps in OECD Countries