Misc
The World’s Most Searched Consumer Brands
View the full-size version of this infographic.
The World’s Most Searched Consumer Brands
View the high resolution of this infographic by clicking here.
Strong brands create an emotional link with consumers, and tech brands are no exception.
In fact, Google, Amazon, Netflix, and even eBay rank as some of the most searched consumer brands worldwide. It’s hard to imagine life without these household names, but how do brand preferences shift and change across internet searches worldwide?
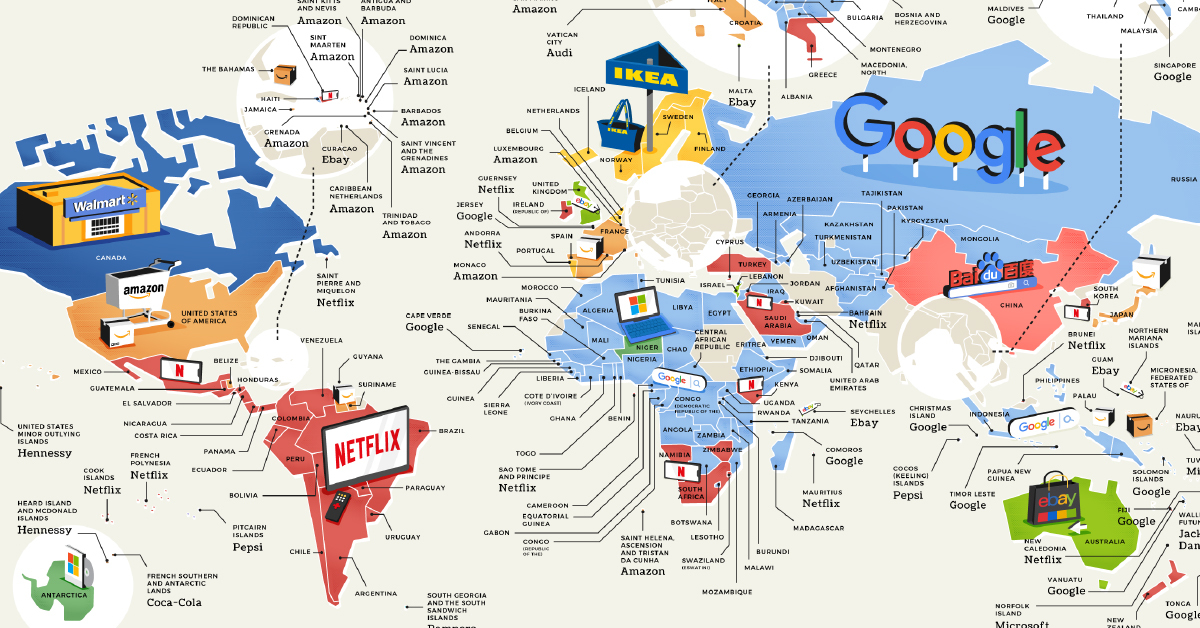
This graphic from Business Financing compiles 12 months of data from the Google Keyword Planner and other sources, to uncover the world’s most searched consumer brands.
Note: Due to data constraints, a number of countries on the map do not have sufficient information available.
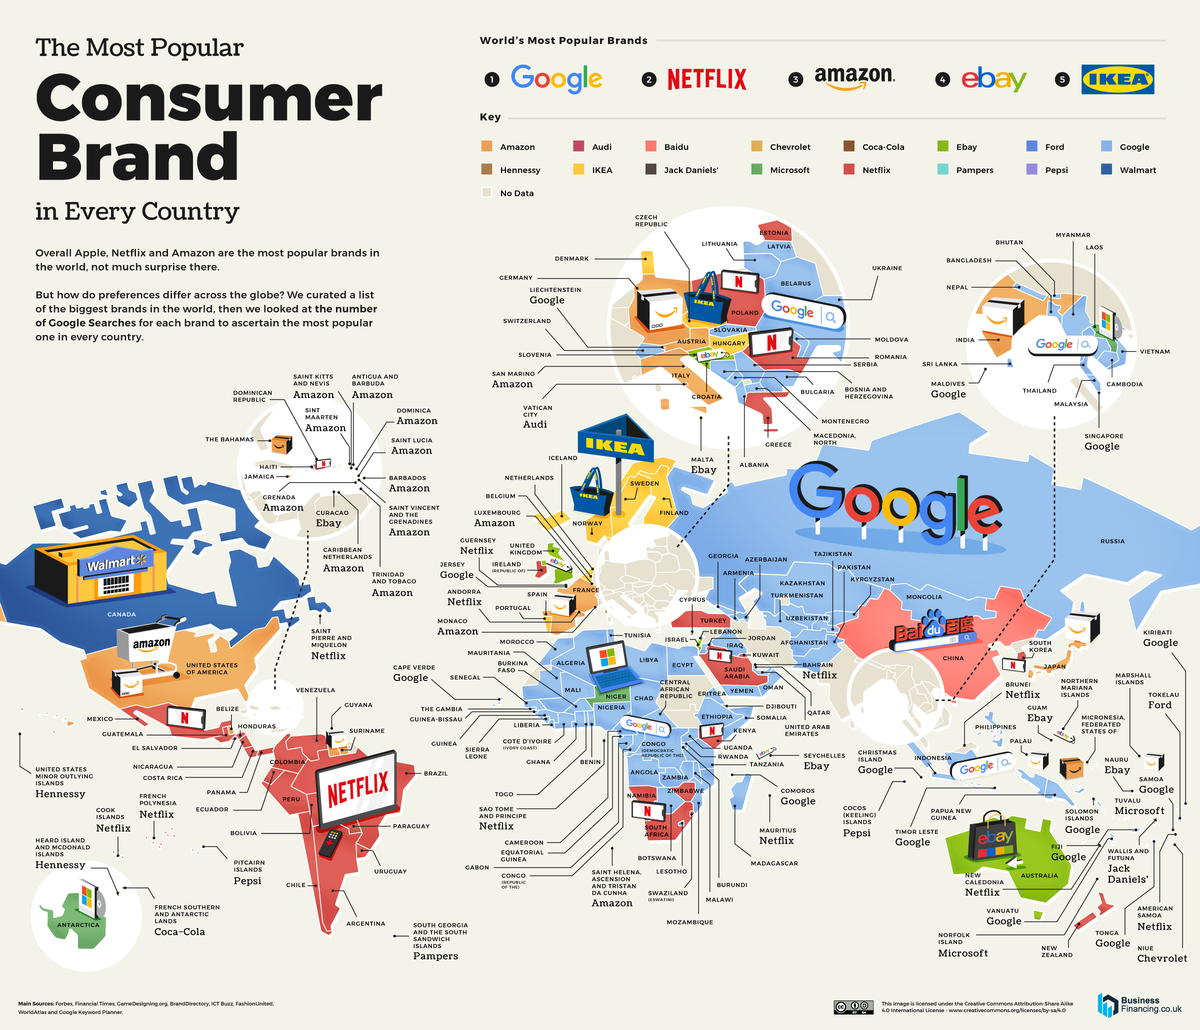
In Tech We Trust
By far, the world’s most searched consumer brand is Google, which seems very convenient.
It ranks at the top in 100 countries—that’s nearly half of all countries on the planet. With over 90 billion visits monthly, Google has unparalleled dominance in brand loyalty and website traffic.
Top 3 Most Searched Consumer Brands
- Google: 100 countries
- Netflix: 45 countries
- Amazon: 30 countries
Netflix, falling in second, ranks highest in 45 countries including Turkey, Brazil, and South Korea. In third, Amazon is the most popular in 30 countries. The only non-tech company in the top five is IKEA, in fifth place, after eBay.
Gaming the System
When it comes to sub-sectors of consumer brands, the gaming space tells an interesting story.
Namely, it is Epic Games—creator of Fortnite and Grand Theft Auto—that dominates global charts by a considerable margin. Founded in Potomac, Maryland, the company ranks at the top for 141 countries globally.
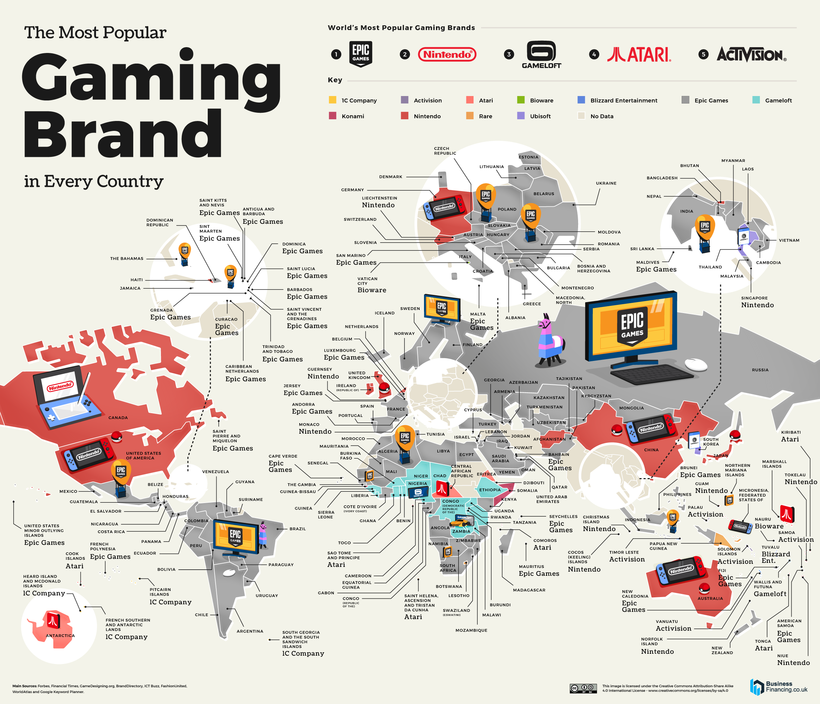
View the high resolution of this infographic by clicking here.
Additionally, Nintendo tops the list of 24 countries including Japan, Haiti, and Canada, while Paris-based Gameloft comes next in line.
Fast Fashion: Shoe Dog At the Top
Since its founding in 1964, Nike has become a remarkable brand builder. In fact, Nike is the most searched fashion brand among 49 countries.
Interestingly, founder Phil Knight only began to fully understand branding power after the company reached $1 billion in revenues. After a series of failures and missteps in the mid-1980s, Nike switched its focus from marketing and manufacturing, to instead, zeroing in on the consumer.
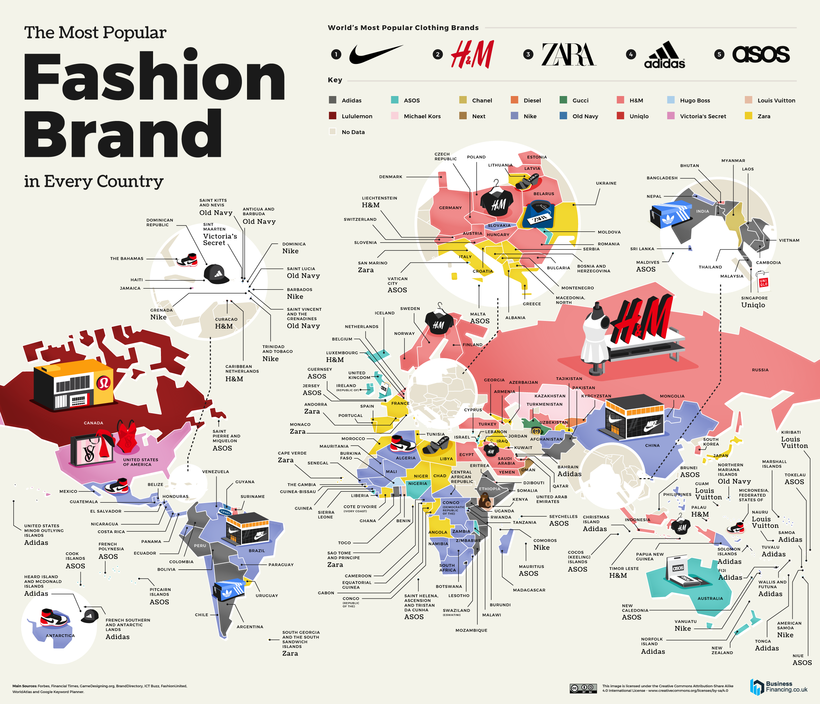
View the high resolution of this infographic by clicking here.
Like Nike, Swedish retailer H&M has a long history dating back to 1947. Prior to the pandemic, the fast-fashion retailer operated 5,000 stores globally. Since pandemic tailwinds, however, H&M plans to close 250 physical stores in 2021 and focus more on online sales.
Big Macs are Here to Stay
When you look closer at the most searched fast food chains, McDonald’s ranks highest on a global level, but not by far.
KFC comes in second, topping the list of 65 countries including Russia, Peru, and Thailand. Meanwhile, Pizza Hut, which is owned by the same parent company as KFC, attracted the highest number of searches in America.
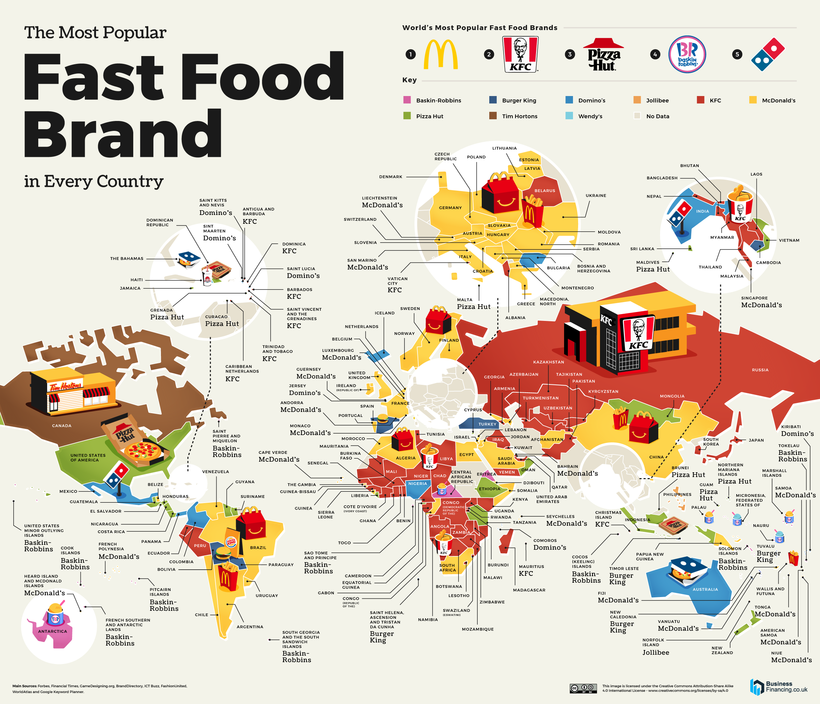
View the high resolution of this infographic by clicking here
On the other hand, Antarctica curiously ranks Baskin Robbins at the top, but this could be influenced from a low volume of searches in the region.
Consumer Brand Outliers
If there’s one recurring trend across the top consumer brands, it’s that they are unsurprisingly dominated by big players concentrated in America.
However, notable outliers are present. In China, search engine Baidu ranks as the top consumer brand on the internet. On the other hand, the Vatican’s most-searched gaming company is Canada-based BioWare, which developed the Mass Effect series (no pun intended).
Meanwhile, in Saint Helena—the island where Napoleon was exiled and later died—has Burger King as its most searched fast food brand. As it happens, the remote island appears to have no Burger King, or any other fast food chains. Kenya’s top fashion brand is Louis Vuitton, while Turkmenistan’s is Gucci.
Despite these differences, many consumer preferences, at least according to search volume, appear strikingly similar on global levels. As many of these multinational brands continue to gain even greater market share, the implications for the global consumer will be interesting to watch in the next year, or even decade.


VC+
VC+: Get Our Key Takeaways From the IMF’s World Economic Outlook
A sneak preview of the exclusive VC+ Special Dispatch—your shortcut to understanding IMF’s World Economic Outlook report.

Have you read IMF’s latest World Economic Outlook yet? At a daunting 202 pages, we don’t blame you if it’s still on your to-do list.
But don’t worry, you don’t need to read the whole April release, because we’ve already done the hard work for you.
To save you time and effort, the Visual Capitalist team has compiled a visual analysis of everything you need to know from the report—and our VC+ Special Dispatch is available exclusively to VC+ members. All you need to do is log into the VC+ Archive.
If you’re not already subscribed to VC+, make sure you sign up now to access the full analysis of the IMF report, and more (we release similar deep dives every week).
For now, here’s what VC+ members get to see.
Your Shortcut to Understanding IMF’s World Economic Outlook
With long and short-term growth prospects declining for many countries around the world, this Special Dispatch offers a visual analysis of the key figures and takeaways from the IMF’s report including:
- The global decline in economic growth forecasts
- Real GDP growth and inflation forecasts for major nations in 2024
- When interest rate cuts will happen and interest rate forecasts
- How debt-to-GDP ratios have changed since 2000
- And much more!

Get the Full Breakdown in the Next VC+ Special Dispatch
VC+ members can access the full Special Dispatch by logging into the VC+ Archive, where you can also check out previous releases.
Make sure you join VC+ now to see exclusive charts and the full analysis of key takeaways from IMF’s World Economic Outlook.
Don’t miss out. Become a VC+ member today.
What You Get When You Become a VC+ Member
VC+ is Visual Capitalist’s premium subscription. As a member, you’ll get the following:
- Special Dispatches: Deep dive visual briefings on crucial reports and global trends
- Markets This Month: A snappy summary of the state of the markets and what to look out for
- The Trendline: Weekly curation of the best visualizations from across the globe
- Global Forecast Series: Our flagship annual report that covers everything you need to know related to the economy, markets, geopolitics, and the latest tech trends
- VC+ Archive: Hundreds of previously released VC+ briefings and reports that you’ve been missing out on, all in one dedicated hub
You can get all of the above, and more, by joining VC+ today.

-

 Education1 week ago
How Hard Is It to Get Into an Ivy League School?
-

 Technology2 weeks ago
Ranked: Semiconductor Companies by Industry Revenue Share
-

 Markets2 weeks ago
Ranked: The World’s Top Flight Routes, by Revenue
-

 Demographics2 weeks ago
Population Projections: The World’s 6 Largest Countries in 2075
-

 Markets2 weeks ago
The Top 10 States by Real GDP Growth in 2023
-

 Demographics2 weeks ago
The Smallest Gender Wage Gaps in OECD Countries
-

 Economy2 weeks ago
Where U.S. Inflation Hit the Hardest in March 2024
-

 Environment2 weeks ago
Top Countries By Forest Growth Since 2001