Gaming
Switch to Success: 20 Years of Nintendo Console Sales
View the full-resolution version of this infographic
How the Nintendo Switch Brought Console Sales Back
Since its 2017 release, the Nintendo Switch has become a household game console for gamers and non-gamers alike.
Few consoles penetrate the mainstream deeply enough to have parents referring to a console by its proper name, instead of their children’s “Gameboy” or “Wii”. Even fewer come together as a complete package that ties together the ideologies and technical ideas of their preceding consoles like the Nintendo Switch has.
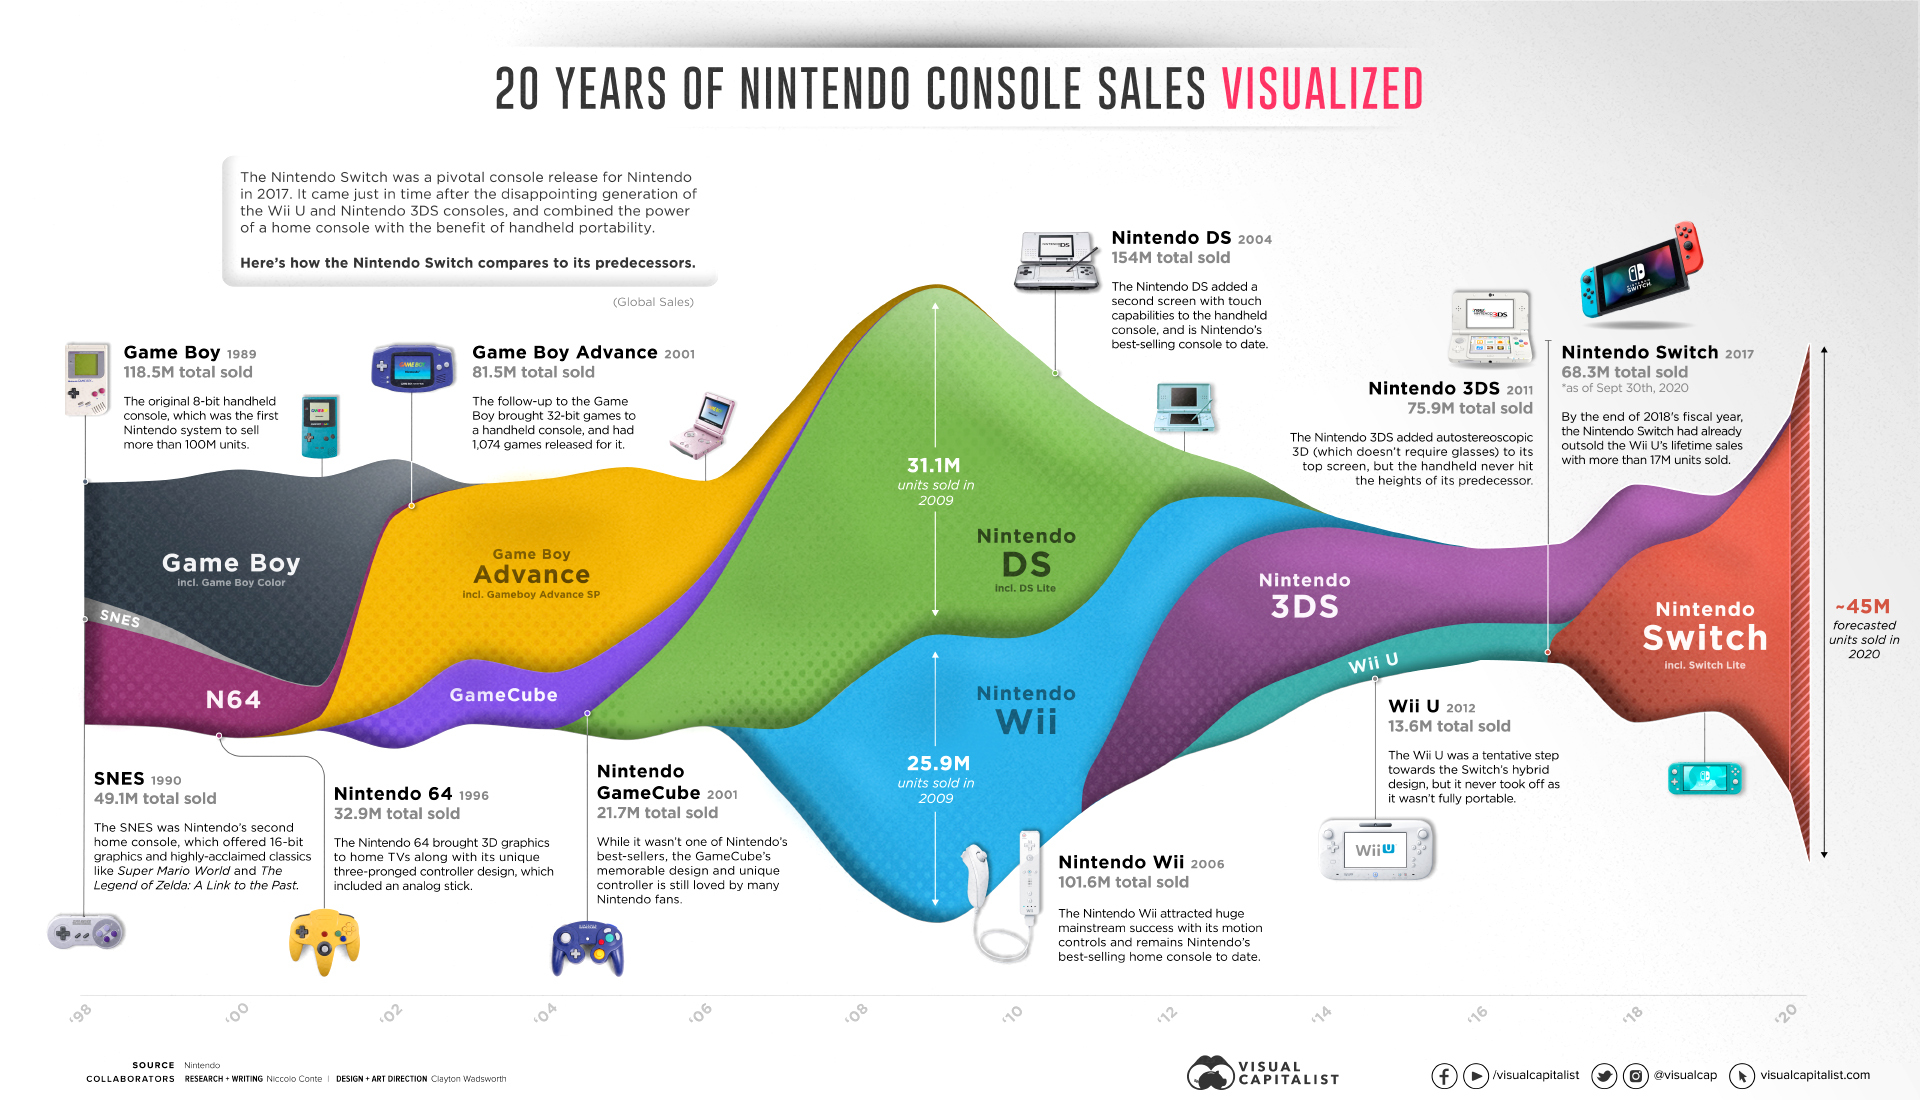
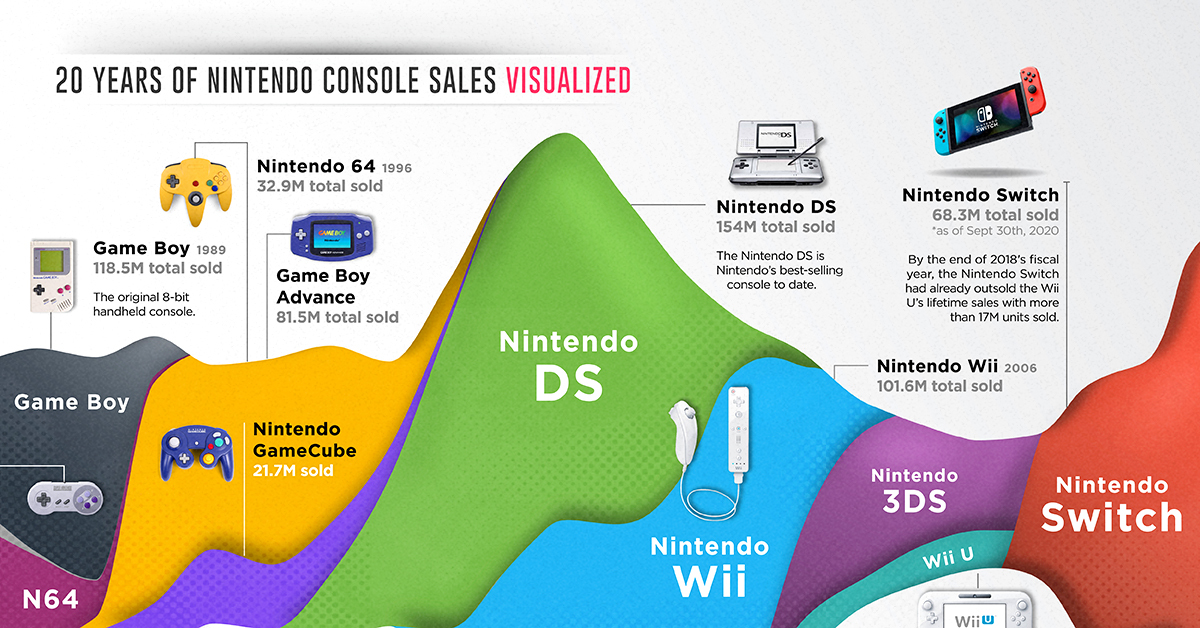
This graphic visualizes the Nintendo Switch sales success story alongside more than 20 years of Nintendo console sales.
The History of Nintendo Console Sales
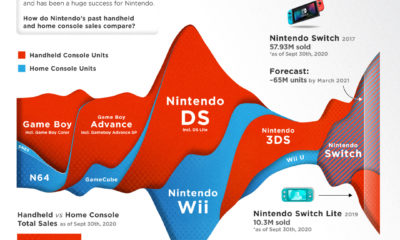
Nintendo has a long and storied history in gaming—but since the release of the original Game Boy in 1989, the company has favored a two-pronged approach with its game consoles: having both a portable handheld console and a home console which connects to a TV on the market.
The Game Boy and the SNES (1990) were the first iteration of this strategy, and they reached more than 160 million units sold combined while establishing legendary game franchises with revered sequels like Super Mario World and The Legend of Zelda: A Link to the Past.
The Game Boy’s variants like the Game Boy Pocket (1996) and Game Boy Color (1998) lengthened the handheld’s lifespan enough to accompany another home console, with the Nintendo 64 coming out in 1996 and selling 32.93 million units of its own.
These successes proved that the gaming audience would support two separate Nintendo consoles on the market, and Nintendo kept the strategy going the following generations.
Lifetime Nintendo Console Sales
| Console | Release Year | Units Sold (as of Sept 30, 2020) |
|---|---|---|
| NES | 1983 | 61.91 M |
| Game Boy | 1989 | 118.69 M |
| SNES | 1990 | 49.1 M |
| Nintendo 64 | 1996 | 32.93 M |
| Game Boy Advance | 2001 | 81.51 M |
| Nintendo GameCube | 2001 | 21.74 M |
| Nintendo DS | 2004 | 154.02 M |
| Nintendo Wii | 2006 | 101.63 M |
| Nintendo 3DS | 2011 | 75.94 M |
| Wii U | 2012 | 13.56 M |
| Nintendo Switch | 2017 | 68.3 M |
Source: Nintendo
The next generation made up of the Game Boy Advance (2001) and Nintendo GameCube (2001) saw slightly lower sales numbers, but was competing against Microsoft’s gaming debut with the original Xbox (2001) and Sony’s incredibly popular Playstation 2 (2000).
While the GameCube sold 21.7 million total units and the original Xbox sold ~24 million total units, the Playstation 2 dominated this generation and is still the best-selling video game console of all time with 155 million units sold.
The Sales Success of the Wii and Nintendo DS
As Sony and Microsoft pushed HD rendering and higher graphical fidelity in their next generation of consoles, Nintendo focused on how games were played rather than raw power.
This brought about the Nintendo DS (2004), which added a second touch screen for developers to build games around, and the Nintendo Wii (2006), which pioneered motion controls and accessibility with the simpler Wii Remote controller.
Both the Nintendo DS and the Nintendo Wii were runaway successes, dominating their generation with more than 255 million combined consoles sold.
At the same time, Sony had tried to replicate Nintendo’s strategy with handheld consoles of their own, the PSP (2004) and PS Vita (2011), and while they sold 80 million units and ~10-15 million units respectively, Sony ultimately abandoned the handheld console market.
The Sales Slump of the Nintendo 3DS and Wii U
Nintendo was clearly the king of the handheld console market. While mobile phones were feared to be a portable console killer, the Nintendo 3DS sold well when it released in 2011 (75.94 million units) and was Nintendo’s saving grace for its generation.
What didn’t hold up well was Nintendo’s home console follow-up to the Wii, the Wii U. The console only reached 13.56 million lifetime sales, and was quickly overshadowed by the Playstation 4 (113.5 million units sold) and Xbox One (~51 million units sold) releases in 2013.
The Wii U’s weak sales brought about one of Nintendo’s worst periods ever in recent history, with two unprofitable years for the company in 2012 and 2014. While developers previously flocked to create games for the Wii’s motion controls, the Wii U’s tablet controller didn’t attract the same kind of innovative software development.
Nintendo’s Net Income Since 2000
| Year | Net Income (USD) |
|---|---|
| 2000 | $490 M |
| 2001 | $734 M |
| 2002 | $896 M |
| 2003 | $627 M |
| 2004 | $324 M |
| 2005 | $742 M |
| 2006 | $827 M |
| 2007 | $1,561 M |
| 2008 | $2,838 M |
| 2009 | $3,003 M |
| 2010 | $2,819 M |
| 2011 | $1,010 M |
| 2012 | -$498 M |
| 2013 | $67 M |
| 2014 | -$194 M |
| 2015 | $348 M |
| 2016 | $141 M |
| 2017 | $910 M |
| 2018 | $1,273 M |
| 2019 | $1,787 M |
| 2020 | $2,500 M |
Source: Nintendo
How the Nintendo Switch Unified Nintendo’s Strategies
With the Wii U’s poor performance leaving Nintendo in a tough spot, the next console release was crucial to the success of the company.
The Nintendo Switch came just in time in 2017 as the Wii U’s sales dried up, and the new hybrid home and portable console was an instant success. By the end of 2018’s fiscal year, the Switch had already outsold the Wii U with 17 million units sold.
While the Nintendo Switch sales success story came largely from how it unified home and handheld gaming, the console brought to fruition many of Nintendo’s strategies and technical decisions over the generations.
Many of the Wii Remote’s abilities are still present in the Switch’s Joy-Cons, with built-in accelerometers and gyroscopes for motion controls, along with the ability to rotate them sideways for a more classic controller configuration. The Nintendo DS’s touch screen permeated many Nintendo consoles and is still present in the Switch, and looking back at the Wii U’s tablet controller, it now seems like an early prototype for the Switch’s free-form portability.
Combining Physical and Digital Play
Nintendo’s foray into physical toys, which started with Amiibo figures, is also gradually developing and merging physical and digital play thanks to the Switch.
In 2018, the company released Nintendo Labo, a custom cardboard building set which integrates with the Switch and its Joy-Cons for a variety of games and experiences. The 2020 release of Mario Kart Live: Home Circuit pushed this further, with players able to build a Mario Kart circuit in their home to race physical karts controlled by the Switch.
The company is continuing to branch out into other realms with the opening of Super Nintendo World theme park in Universal Studios in Osaka, Japan on February 4th, 2021. The theme park will also be combining the digital and physical world, with virtual coin collecting and other prizes tracked on mobile phones, gamifying the experience for visitors.
Broadening Nintendo’s Audience to More than Just Gamers
The success of the Nintendo Switch has brought on more experimentation and fresh ideas from the company, and the COVID-19 pandemic made it an essential product of 2020. With many families at home due to lockdowns, being able to slide the console out of its dock and off the TV to play in handheld mode has been a game-changer.
While Nintendo’s development team can prepare for their next console with a bit more financial breathing room thanks to the Switch’s superb sales, the company has been working hard to broaden its audience. The physical toys for younger audiences help capture a new generation of Nintendo fans, while older generations of fans will be excited to visit Super Nintendo World and indulge in nostalgia while introducing Nintendo to their children.
As the Nintendo Switch’s excellent game library continues to expand, new and old fans alike will be excited to see what consoles, games, and other products come next from the legendary game company.


Technology
Charting Grand Theft Auto: GTA’s Budget and Revenues
Dive into the GTA budget through the years, with GTA VI set to be the most expensive video game of all time.
Charting Grand Theft Auto: GTA’s Budget and Revenues
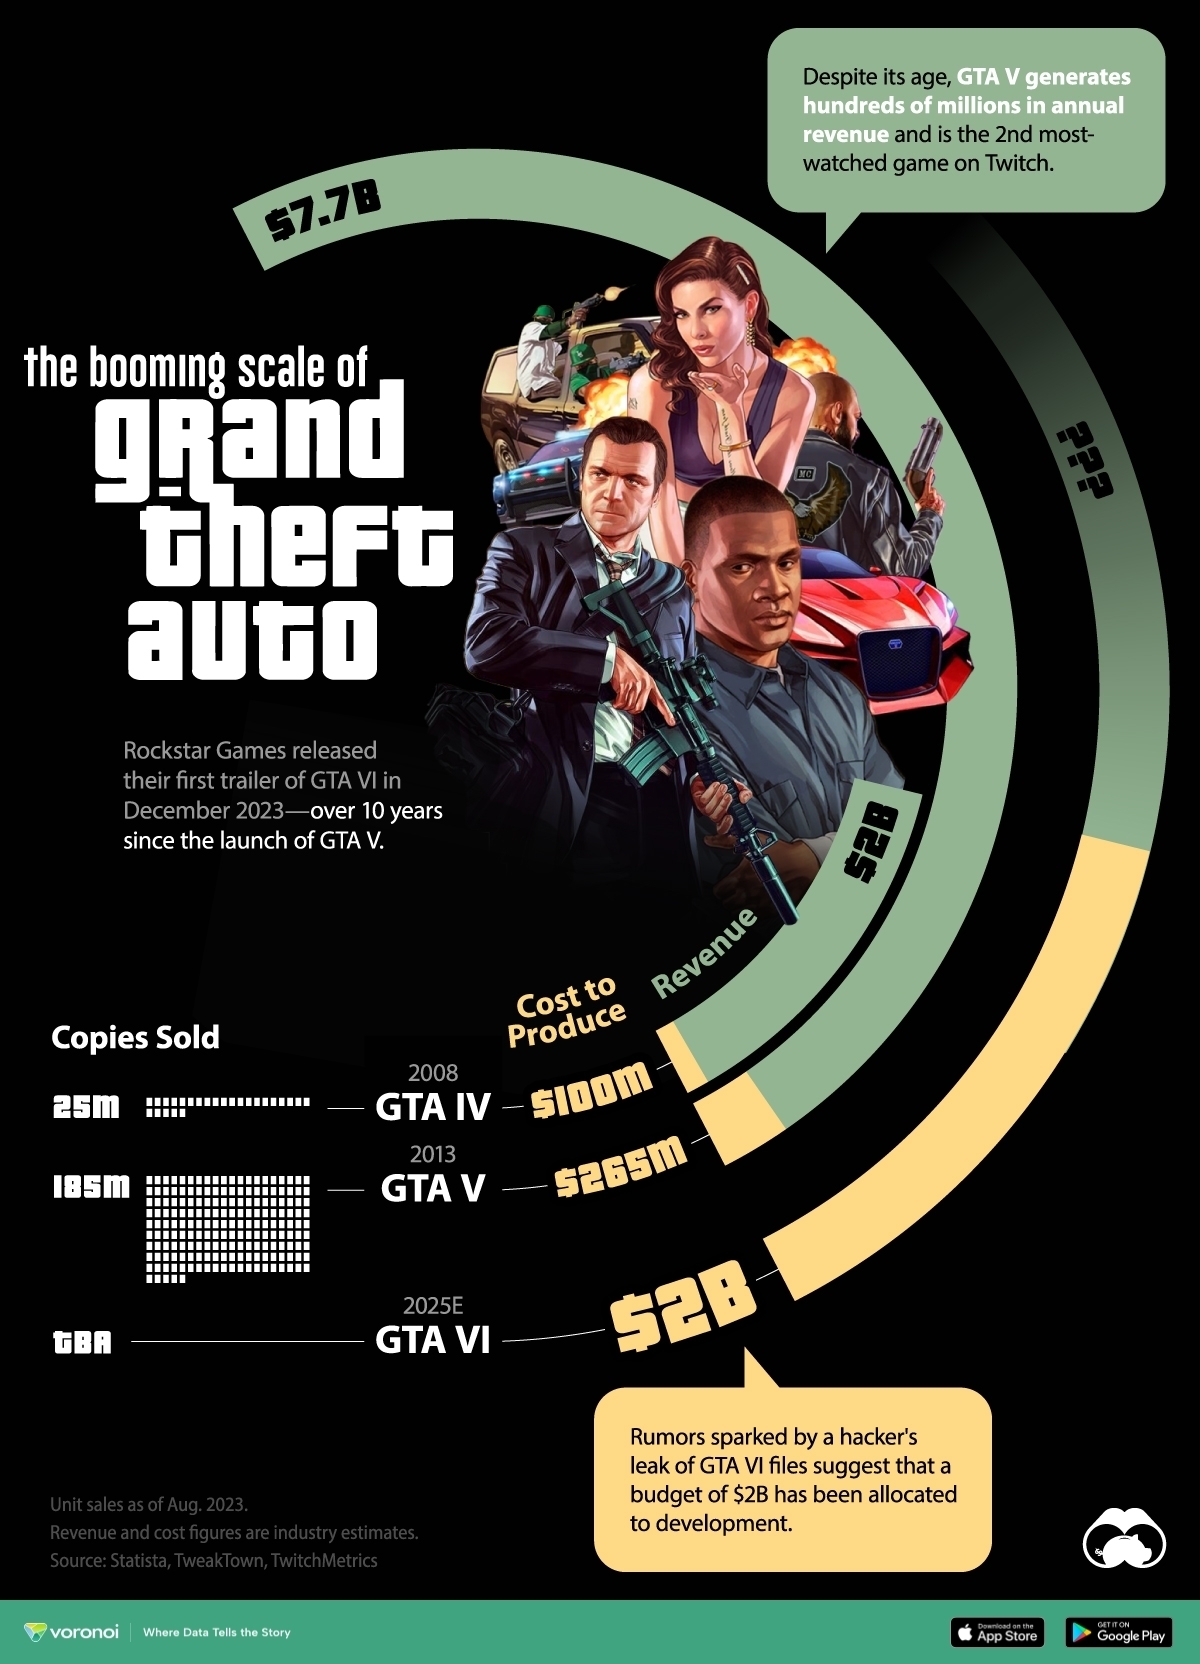
Over 10 years since the launch of Grand Theft Auto V (GTA V), the second most-sold video game in history, Rockstar Games has announced its sequel GTA VI will be “coming 2025.”
As the anticipation only grows for this next big entry in the franchise, we take a look at the GTA budget through the years. How much have the last two games cost to make, how much have they earned, and how do they compare with the latest entry?
Data for this visualization comes from Statista, TweakTown, and Twitch Metrics.
How Much Has GTA VI Cost to Make?
The GTA franchise has grown enormously in scale from humble beginnings as a top-down, 2D video game in 1997. Fifteen installments later, the upcoming release, GTA VI, is estimated to be the most expensive video game to be made yet.
Here’s a look at how much GTA VI and the last two major releases cost, and how much revenue they’ve earned as of August 2023.
| Year | Title | Production Costs ($) | Revenue ($) | Copies Sold |
|---|---|---|---|---|
| 2025 (est.) | GTA VI | $2B (rumored) | N/A | N/A |
| 2013 | GTA V | $265M | $7.7B | 185M |
| 2008 | GTA IV | $100M | $2B | 25M |
In 2008, GTA IV cost around $100 million—already a budget that rivalled big Hollywood releases. However with 25 million copies sold, the game earned nearly $2 billion—a five-fold return on its production cost.
Five years later, GTA V (2013) cost more than $200 million to make—twice GTA IV’s budget. A decade after its release, GTA V has generated close to $8 billion, with hundreds of millions in annual revenue from subscriptions and in-game purchases—a model that its successor is sure to follow.
In fact, subscription fees and in-game purchases represented 78% of Take-Two Interactive’s (parent of GTA developer Rockstar Games) revenues in 2023.
Analysts estimate the to-be-released GTA VI’s costs at $2 billion, including marketing and other expenses. A massive open-world (set in the Miami-inspired “Vice City”), cutting edge graphics, and a reportedly brand-new game engine are all reasons for the game’s outsized budget.
For comparison, the current most expensive games to have been made include Red Dead Redemption 2 (also by Rockstar) and Star Citizen, both reportedly with a $500 million budget.
Meanwhile, Take-Two Interactive shares are up more than 50% for the year.

-

 Education1 week ago
How Hard Is It to Get Into an Ivy League School?
-

 Technology2 weeks ago
Ranked: Semiconductor Companies by Industry Revenue Share
-

 Markets2 weeks ago
Ranked: The World’s Top Flight Routes, by Revenue
-

 Demographics2 weeks ago
Population Projections: The World’s 6 Largest Countries in 2075
-

 Markets2 weeks ago
The Top 10 States by Real GDP Growth in 2023
-

 Demographics2 weeks ago
The Smallest Gender Wage Gaps in OECD Countries
-

 Economy2 weeks ago
Where U.S. Inflation Hit the Hardest in March 2024
-

 Green2 weeks ago
Top Countries By Forest Growth Since 2001