Technology
How Do Esports Companies Compare with Sports Teams?


How Do Esports Companies Compare with Sports Teams?
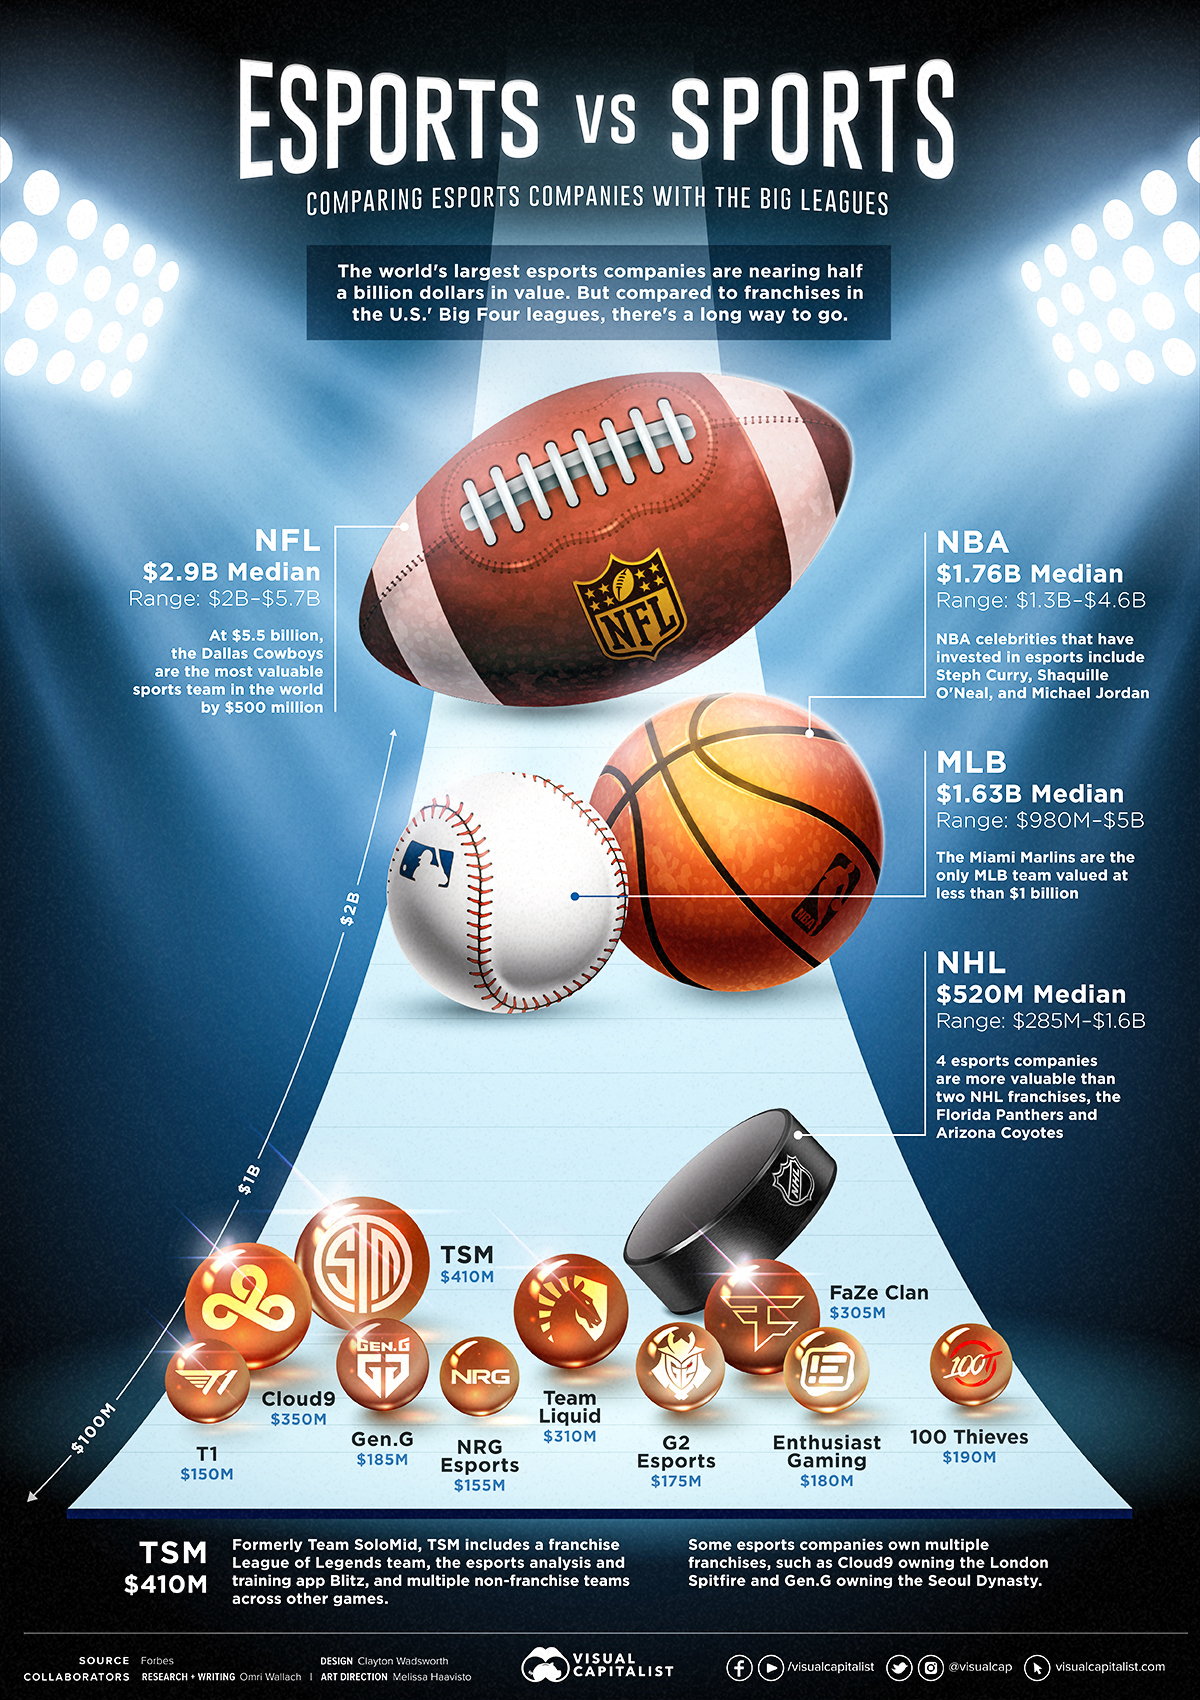
Are esports on the same level as “real” sports? These comparisons range from tricky to subjective, but the monetary value of companies speak for themselves.
The world’s largest esports companies have definitely risen to the occasion. Valued at almost half-a-billion dollars, they’ve started to pass some sports franchises in value.
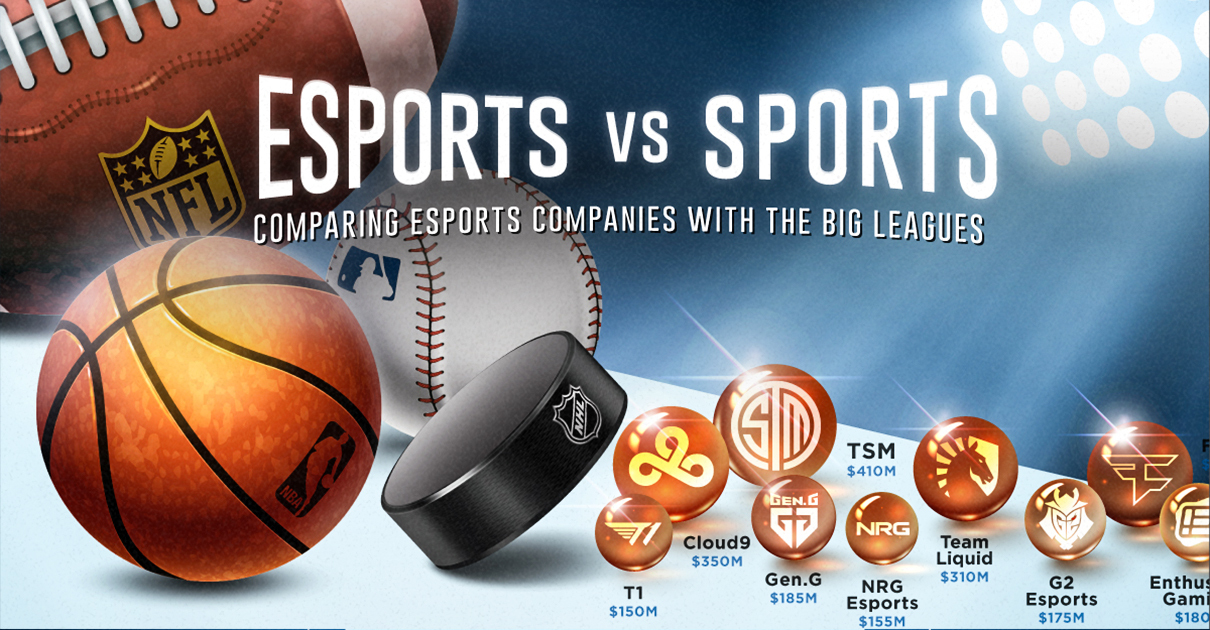
In the above graphic, we compare Forbes’ valuation of the top 10 esports companies in 2020 against median franchises in the “Big Four” major leagues (NFL, MLB, NBA, and NHL). Despite competitive gaming’s rapid growth, there’s still a long way left to go.
Esports Impress but NFL Teams Reign Supreme
The world’s top esports companies have grown quickly, and impressively.
As of 2018, there was only one esports company worth more than $300 million in valuation. By 2020, four of the top 10 were valued at more than $300 million.
| Esports Company | Games with Franchises | Value (2020) |
|---|---|---|
| TSM | League of Legends | $410M |
| Cloud9 | League of Legends, Overwatch | $350M |
| Team Liquid | League of Legends | $310M |
| FaZe Clan | Call of Duty | $305M |
| 100 Thieves | League of Legends, Call of Duty | $190M |
| Gen.G | League of Legends, Overwatch, NBA 2K | $185M |
| Enthusiast Gaming | Call of Duty, Overwatch | $180M |
| G2 Esports | League of Legends | $175M |
| NRG Esports | Call of Duty, Overwatch | $155M |
| T1 | League of Legends | $150M |
When compared to traditional sports valuations, esports companies have already reached major league hockey status.
TSM, the world’s most valuable esports company in 2020, has a higher valuation than five NHL franchises. In fact, four esports companies were estimated to be more valuable than two NHL franchises, the Florida Panthers and Arizona Coyotes.
But other sports leagues are further away. While the median value of an NHL franchise in 2020 was $520 million, the MLB, NBA, and NFL all saw median values of over $1.6 billion.
| Esports vs. Sports Franchises | Lowest Valued Team | Highest Valued Team | Median |
|---|---|---|---|
| NFL | $2.0B | $5.7B | $3.0B |
| NBA | $1.3B | $4.6B | $1.8B |
| MLB | $980M | $5.0B | $1.6B |
| NHL | $285M | $1.6B | $520M |
| Esports (Top 10) | $150M | $410M | $188M |
Differences in Esports vs Sports Structures and Growth
Try as we might to make a clean apples-to-apples comparison between esports and traditional sports teams, there are significant differences in the business models to consider.
For starters, major esports companies own multiple franchises and non-franchise teams across many games. Cloud9 owns both the eponymous Cloud9 League of Legends franchise and the London Spitfire Overwatch franchise, for example, as well as non-franchise teams in Halo, Counter Strike: Global Offensive, Fortnite, and other games.
The revenue streams for esports companies are also extremely varied. Companies like TSM, 100 Thieves, FaZe Clan and Enthusiast Gaming made 50% or more of their revenue from outside of esports, having instead expanded into diverse companies with an equal focus on content creation and apps.
But it’s this greater ability to diversify, and the still-increasing size of esports fandom, that continues to grow esports valuations. In fact, TSM’s estimated 2020 revenue of $45 million is less than half of the Arizona Coyotes’ estimated revenue of $95 million, despite a $100+ million valuation difference in favor of TSM.
That’s why the continued maturation of esports is only going to make traditional sports comparisons easier, and closer. Instead of having to pit companies against franchises, direct league-to-league comparisons will be possible, and the differences will likely shrink from billions to millions.


Technology
All of the Grants Given by the U.S. CHIPS Act
Intel, TSMC, and more have received billions in subsidies from the U.S. CHIPS Act in 2024.


All of the Grants Given by the U.S. CHIPS Act
This was originally posted on our Voronoi app. Download the app for free on iOS or Android and discover incredible data-driven charts from a variety of trusted sources.
This visualization shows which companies are receiving grants from the U.S. CHIPS Act, as of April 25, 2024. The CHIPS Act is a federal statute signed into law by President Joe Biden that authorizes $280 billion in new funding to boost domestic research and manufacturing of semiconductors.
The grant amounts visualized in this graphic are intended to accelerate the production of semiconductor fabrication plants (fabs) across the United States.
Data and Company Highlights
The figures we used to create this graphic were collected from a variety of public news sources. The Semiconductor Industry Association (SIA) also maintains a tracker for CHIPS Act recipients, though at the time of writing it does not have the latest details for Micron.
| Company | Federal Grant Amount | Anticipated Investment From Company |
|---|---|---|
| 🇺🇸 Intel | $8,500,000,000 | $100,000,000,000 |
| 🇹🇼 TSMC | $6,600,000,000 | $65,000,000,000 |
| 🇰🇷 Samsung | $6,400,000,000 | $45,000,000,000 |
| 🇺🇸 Micron | $6,100,000,000 | $50,000,000,000 |
| 🇺🇸 GlobalFoundries | $1,500,000,000 | $12,000,000,000 |
| 🇺🇸 Microchip | $162,000,000 | N/A |
| 🇬🇧 BAE Systems | $35,000,000 | N/A |
BAE Systems was not included in the graphic due to size limitations
Intel’s Massive Plans
Intel is receiving the largest share of the pie, with $8.5 billion in grants (plus an additional $11 billion in government loans). This grant accounts for 22% of the CHIPS Act’s total subsidies for chip production.
From Intel’s side, the company is expected to invest $100 billion to construct new fabs in Arizona and Ohio, while modernizing and/or expanding existing fabs in Oregon and New Mexico. Intel could also claim another $25 billion in credits through the U.S. Treasury Department’s Investment Tax Credit.
TSMC Expands its U.S. Presence
TSMC, the world’s largest semiconductor foundry company, is receiving a hefty $6.6 billion to construct a new chip plant with three fabs in Arizona. The Taiwanese chipmaker is expected to invest $65 billion into the project.
The plant’s first fab will be up and running in the first half of 2025, leveraging 4 nm (nanometer) technology. According to TrendForce, the other fabs will produce chips on more advanced 3 nm and 2 nm processes.
The Latest Grant Goes to Micron
Micron, the only U.S.-based manufacturer of memory chips, is set to receive $6.1 billion in grants to support its plans of investing $50 billion through 2030. This investment will be used to construct new fabs in Idaho and New York.

-

 Education1 week ago
How Hard Is It to Get Into an Ivy League School?
-

 Technology2 weeks ago
Ranked: Semiconductor Companies by Industry Revenue Share
-

 Markets2 weeks ago
Ranked: The World’s Top Flight Routes, by Revenue
-

 Demographics2 weeks ago
Population Projections: The World’s 6 Largest Countries in 2075
-

 Markets2 weeks ago
The Top 10 States by Real GDP Growth in 2023
-

 Demographics2 weeks ago
The Smallest Gender Wage Gaps in OECD Countries
-

 Economy2 weeks ago
Where U.S. Inflation Hit the Hardest in March 2024
-

 Environment2 weeks ago
Top Countries By Forest Growth Since 2001