Mining
How the World’s Top Gold Mining Stocks Performed in 2020
How Top Gold Mining Stocks Performed in 2020
Gold mining stocks and the GDX saw strong returns in 2020 as gold was one of the most resilient and best performing assets in a highly volatile year.
But picking gold mining stocks isn’t easy, as each company has a variety of individual projects and risks worth assessing. This is why the GDX (VanEck Vectors Gold Miners ETF), is one of the most popular methods investors choose to get exposure to players in the gold mining industry.
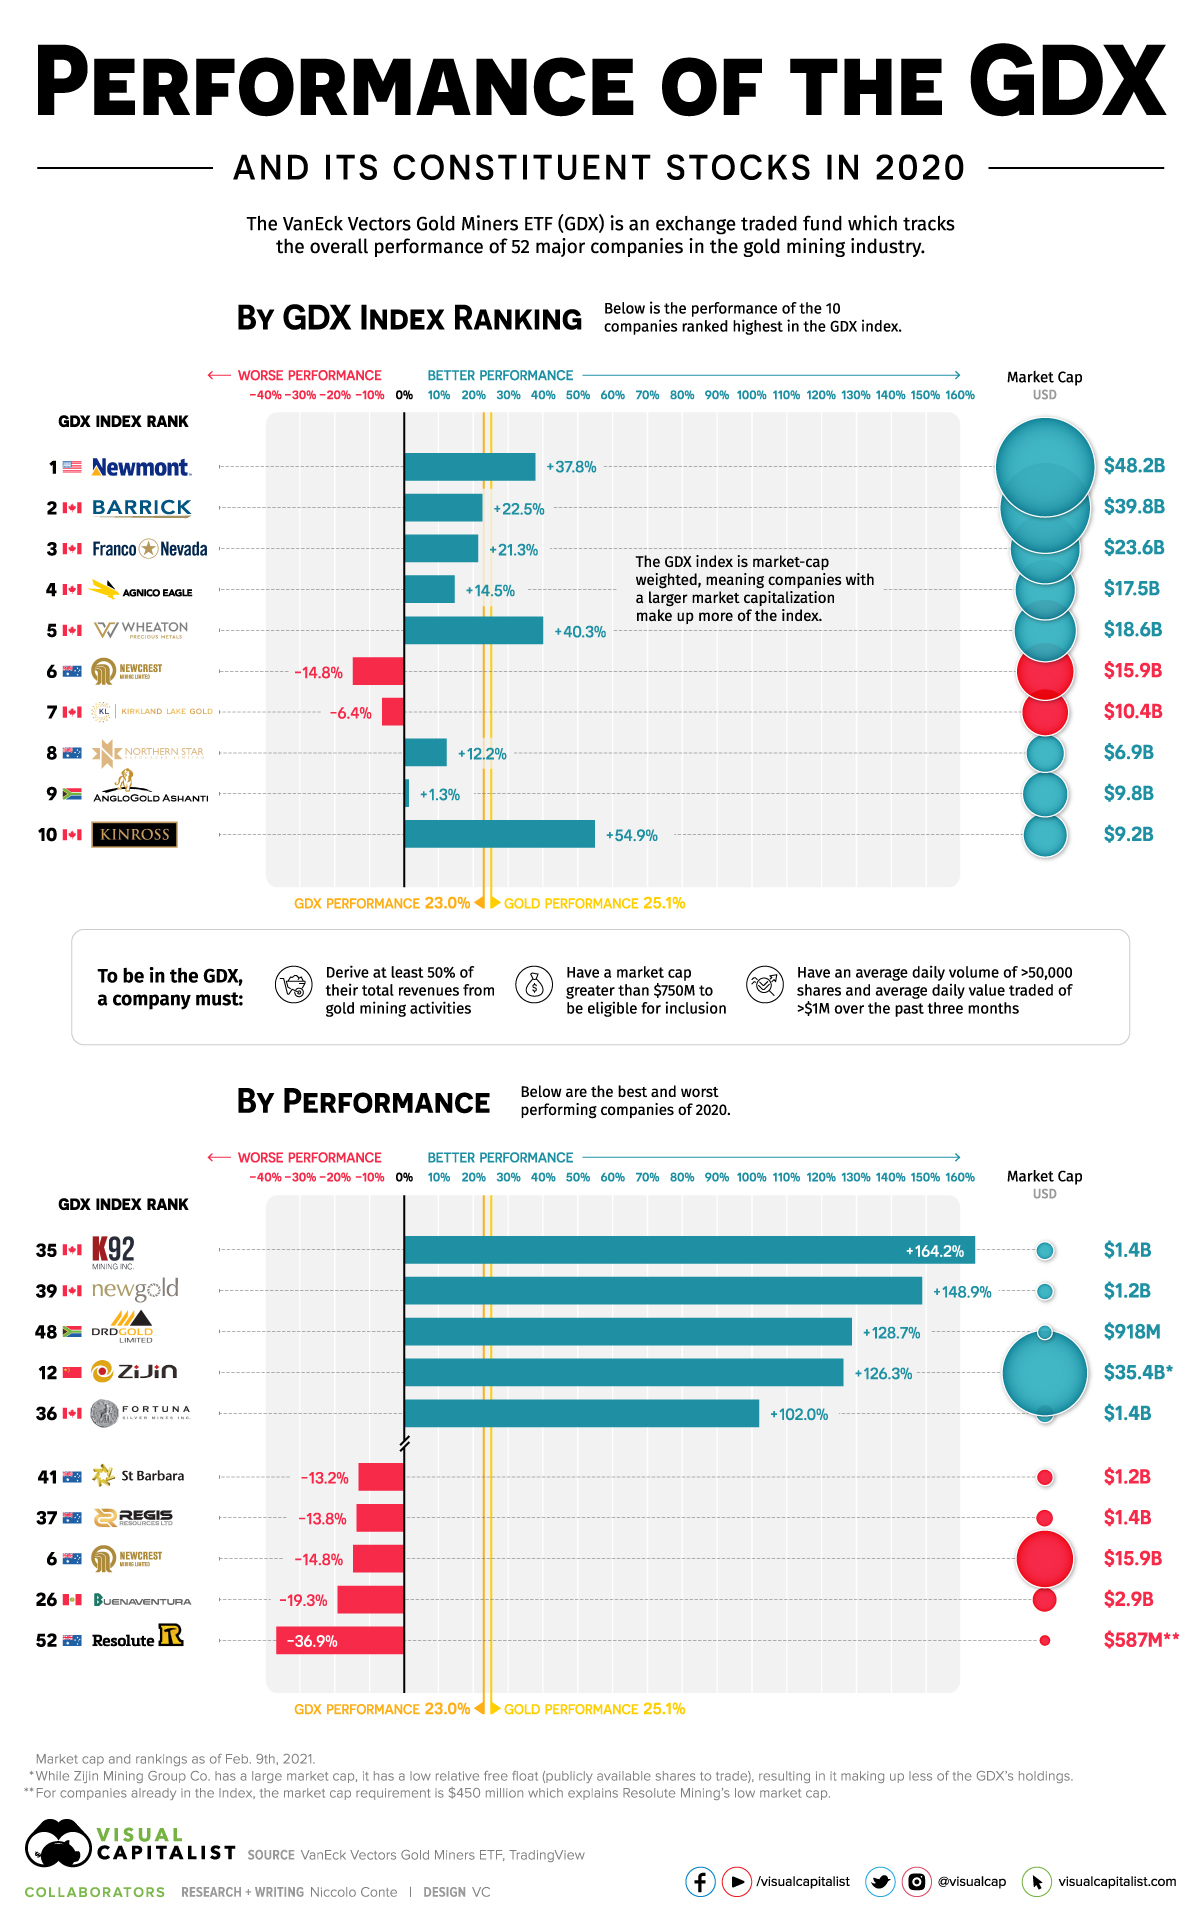
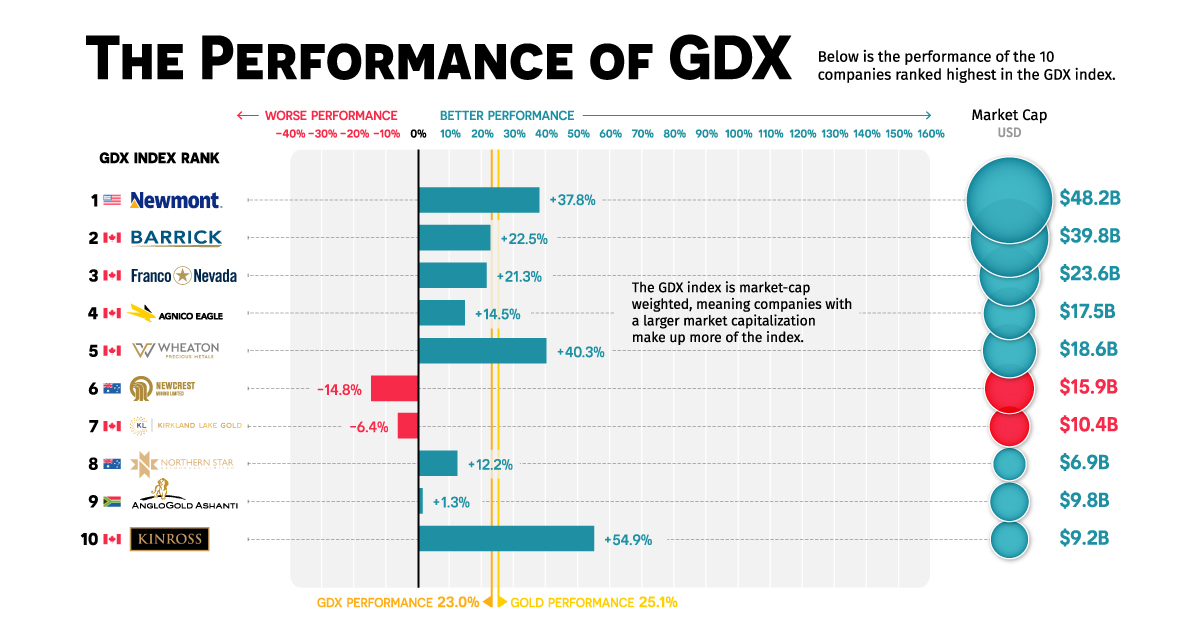
While the GDX and gold miners can generally offer leveraged upside compared to gold during bull markets, in 2020 the GDX returned 23%, just a couple of points shy from spot gold’s 25.1% return.
This graphic compares the returns of gold, the GDX, and the best and worst performing gold mining equities in the index.
Understanding the GDX ETF and its Value
The GDX is one of many index ETFs created by investment management firm VanEck and offers exposure to 52 of the top gold mining stocks.
It provides a straightforward way to invest in the largest names in the gold mining industry, while cutting down on some of the individual risks that many mining companies are exposed to. The GDX is VanEck’s largest and most popular ETF averaging ~$25M in volume every day, with the largest amount of total net assets at $15.3B.
In terms of its holdings, the GDX attempts to replicate the returns of the NYSE Arca Gold Miners Index (GDM), which tracks the overall performance of companies in the gold mining industry.
How the Largest Gold Miners Performed in 2020
As a market-cap weighted ETF, the GDX allocates more assets towards constituents with a higher market cap, resulting in larger gold mining companies making up more of the index’s holdings.
This results in the five largest companies in the GDX making up 39.5% of the index’s holdings, and the top 10 making up 59.3%.
An equally-weighted index of the top five GDX constituents returned 27.3% for the year, outperforming gold and the index by a few points. Meanwhile, an equally-weighted index of the top 10 constituents significantly underperformed, only returning 18.4%.
Newmont was the only company of the top five which outperformed gold and the overall index, returning 37.8% for the year. Wheaton Precious Metals (40.3%) and Kinross Gold (54.9%) were the only other companies in the top 10 that managed to outperform.
Kinross Gold was the best performer among the top constituents largely due to its strong Q3 results, where the company generated significant free cash flow while quadrupling reported net earnings. Along with these positive results, the company also announced its expectation to increase gold production by 20% over the next three years.
The Best and Worst Performers in 2020
Among the best and worst performers of the GDX, it was the smaller-sized companies in the bottom half of the ranking which either significantly over- or underperformed.
K92 Mining’s record gold production from their Kainantu gold mine, along with a significant resource increase at their high-grade Kora deposit nearby saw a return of 164.2%, with the company graduating from the TSX-V to the TSX at the end of 2020.
Four of the five worst performers for 2020 were Australian mining companies as the country entered its first recession in 30 years after severe COVID-19 lockdowns and restrictions. Bushfires early in the year disrupted shipments from Newcrest’s Cadia mine, and rising tensions with China (Australia’s largest trading partner) also contributed to double-digit drawdowns for some Australian gold miners.
The worst performer and last-ranked company in the index, Resolute Mining (-36.9%), had further disruptions in H2’2020 at their Syama gold mine in Mali. The military coup and resignation of Mali’s president Ibrahim Keïta in August was followed by unionized workers threatening strikes in September, slowing operations at Syama gold mine. Outright strikes eventually occurred before year’s end.
How Gold Mining Stocks are Chosen for the GDX
There are some ground rules which dictate how the index is weighted to ensure the GDM and GDX properly reflect the gold mining industry.
Along with the rules on the index’s weighting, there are company-specific requirements for inclusion into the GDM, and as a result the GDX:
- Derive >50% of revenues from gold mining and related activities
- Market capitalization >$750M
- Average daily volume >50,000 shares over the past three months
- Average daily value traded >$1M over the past three months
Gold mining stocks already in the index have some leeway regarding these requirements, and ultimately inclusion or exclusion from the index us up to the Index Administrator.
What 2021 Will Bring for Gold Mining Stocks
The GDX has had a muted start to the new year, with the index at -2.3% as it has mostly followed spot gold’s price.
Gold and gold mining stocks cooled off significantly following their strong rally Q1-Q3’2020, as positive developments regarding the COVID-19 vaccine have resulted in a stronger-than-expected U.S. dollar and a rise in treasury yields.
This being said, the arrival of new monetary stimulus in the U.S. could spur inflation-fearing investors towards gold and gold mining stocks as the year progresses.


Lithium
Ranked: The Top 10 EV Battery Manufacturers in 2023
Asia dominates this ranking of the world’s largest EV battery manufacturers in 2023.


The Top 10 EV Battery Manufacturers in 2023
This was originally posted on our Voronoi app. Download the app for free on iOS or Android and discover incredible data-driven charts from a variety of trusted sources.
Despite efforts from the U.S. and EU to secure local domestic supply, all major EV battery manufacturers remain based in Asia.
In this graphic we rank the top 10 EV battery manufacturers by total battery deployment (measured in megawatt-hours) in 2023. The data is from EV Volumes.
Chinese Dominance
Contemporary Amperex Technology Co. Limited (CATL) has swiftly risen in less than a decade to claim the title of the largest global battery group.
The Chinese company now has a 34% share of the market and supplies batteries to a range of made-in-China vehicles, including the Tesla Model Y, SAIC’s MG4/Mulan, and various Li Auto models.
| Company | Country | 2023 Production (megawatt-hour) | Share of Total Production |
|---|---|---|---|
| CATL | 🇨🇳 China | 242,700 | 34% |
| BYD | 🇨🇳 China | 115,917 | 16% |
| LG Energy Solution | 🇰🇷 Korea | 108,487 | 15% |
| Panasonic | 🇯🇵 Japan | 56,560 | 8% |
| SK On | 🇰🇷 Korea | 40,711 | 6% |
| Samsung SDI | 🇰🇷 Korea | 35,703 | 5% |
| CALB | 🇨🇳 China | 23,493 | 3% |
| Farasis Energy | 🇨🇳 China | 16,527 | 2% |
| Envision AESC | 🇨🇳 China | 8,342 | 1% |
| Sunwoda | 🇨🇳 China | 6,979 | 1% |
| Other | - | 56,040 | 8% |
In 2023, BYD surpassed LG Energy Solution to claim second place. This was driven by demand from its own models and growth in third-party deals, including providing batteries for the made-in-Germany Tesla Model Y, Toyota bZ3, Changan UNI-V, Venucia V-Online, as well as several Haval and FAW models.
The top three battery makers (CATL, BYD, LG) collectively account for two-thirds (66%) of total battery deployment.
Once a leader in the EV battery business, Panasonic now holds the fourth position with an 8% market share, down from 9% last year. With its main client, Tesla, now sourcing batteries from multiple suppliers, the Japanese battery maker seems to be losing its competitive edge in the industry.
Overall, the global EV battery market size is projected to grow from $49 billion in 2022 to $98 billion by 2029, according to Fortune Business Insights.

-

 Debt1 week ago
How Debt-to-GDP Ratios Have Changed Since 2000
-

 Markets2 weeks ago
Ranked: The World’s Top Flight Routes, by Revenue
-

 Countries2 weeks ago
Population Projections: The World’s 6 Largest Countries in 2075
-

 Markets2 weeks ago
The Top 10 States by Real GDP Growth in 2023
-

 Demographics2 weeks ago
The Smallest Gender Wage Gaps in OECD Countries
-

 United States2 weeks ago
Where U.S. Inflation Hit the Hardest in March 2024
-

 Green2 weeks ago
Top Countries By Forest Growth Since 2001
-

 United States2 weeks ago
Ranked: The Largest U.S. Corporations by Number of Employees