Mining
Why Gold Mining Stocks Outperform Gold in Bull Markets
Why Gold Mining Stocks Outperform Gold in Bull Markets
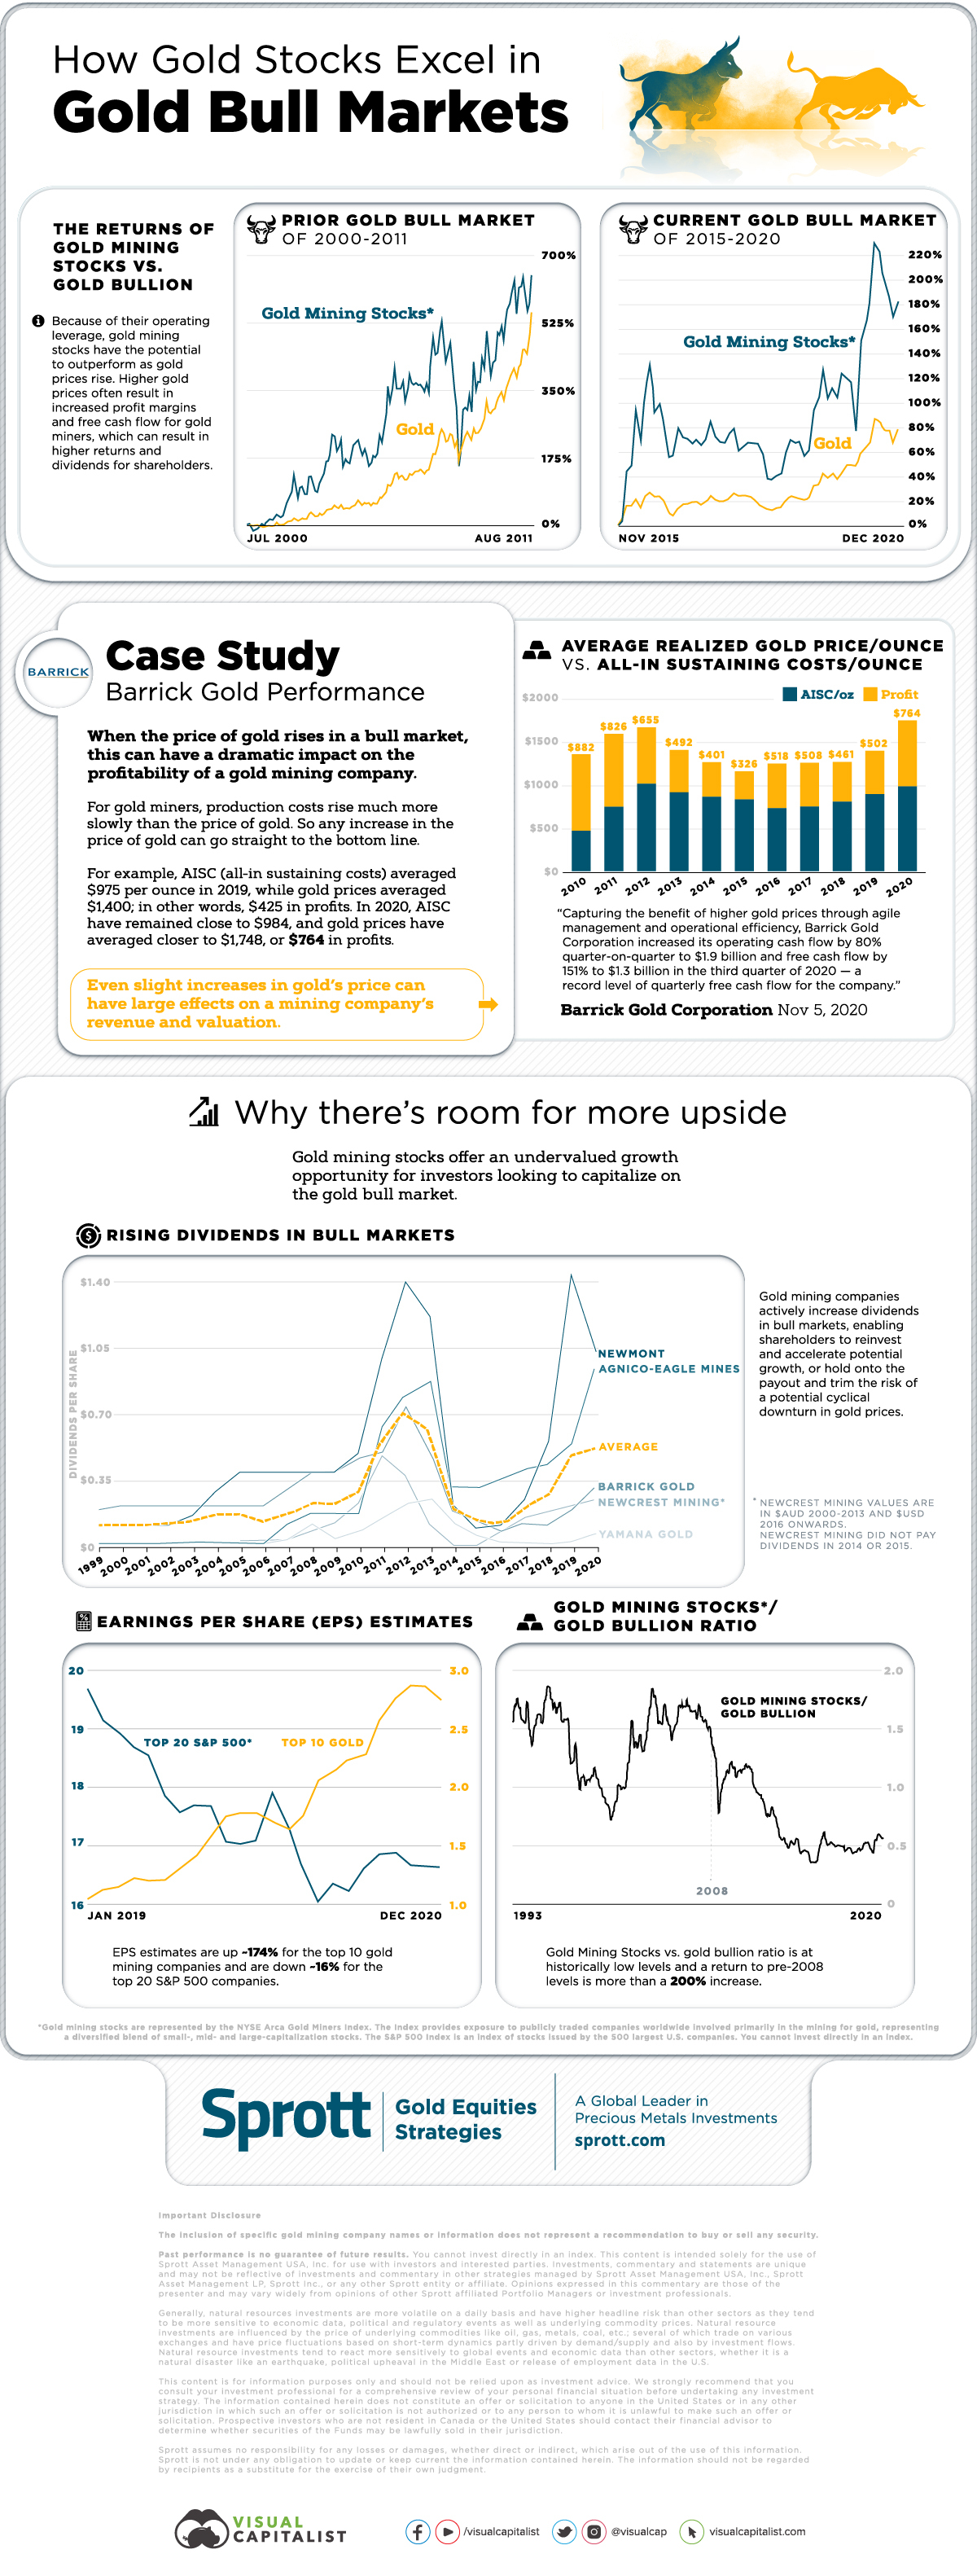
Gold is highly revered for its great returns and resilience during economic downturns, but during gold bull markets there’s something that regularly provides even greater returns: the ownership of gold mining stocks.
Over the past 20 years, gold mining stocks have outperformed the price of gold bullion in bull markets, offering what can be seen as a leveraged play on gold’s price appreciation.
While gold miners offer more potential upside, they also have higher volatility and greater downside during dips, making market timing and strong hands all the more important.
This infographic comes to us from Sprott and compares the returns of gold stocks and gold bullion in bull markets. It also explains how gold stocks outperform thanks to profit expansion, and shows why there might be more upside for gold miners to come.
How Operating Leverage Benefits Gold Mining Companies
During the 2000-2011 gold bull market, the price of physical gold rose 550%. While you might think that number is hard to beat, over the same period of time gold mining equities (represented by the NYSE Arca Gold Miners Index) returned more than 690%.
In the current gold bull market which started in 2015, gold mining stocks are up more than 182%, more than doubling gold bullion’s 78% returns.
This outperformance in bull markets is largely due to how gold mining companies use their operating leverage to maximize profits, resulting in their share prices appreciating.
Breaking Down Gold Mining Costs and Profits
As a gold mining company mines and produces gold, the gold is sold on the market fairly quickly to avoid the risk of gold’s price depreciating.
When the price of gold rises, miners immediately start to see greater profits from selling their ounces on the market. While the costs to mine gold also rise in bull markets, they rise less and at a slower rate.
The result of this is profit expansion: when operationally efficient gold mining companies are able to capture larger profits, resulting in increased operating and free cash flow.
Breakdown of Barrick Gold’s Profit per Ounce of Gold
| Year | All-in Sustaining Costs/oz (in USD) | Realized Gold Price/oz (in USD) | Profit/oz (in USD) |
|---|---|---|---|
| 2015 | $831 | $1,157 | $326 |
| 2016 | $730 | $1,248 | $518 |
| 2017 | $750 | $1,258 | $508 |
| 2018 | $806 | $1,267 | $461 |
| 2019 | $894 | $1,396 | $502 |
| 2020 | $984 | $1,748 | $764 |
During the current gold bull run which started in 2015, Barrick Gold’s average realized price per troy ounce of gold increased by 50%, while their all-in sustaining costs per troy ounce only went up by 18%.
This has resulted in the company increasing their profit per ounce of gold sold by a staggering 134% over the past six years.
Making the Most of Golden Times
While higher profit margins during bull markets are great, it’s up to the individual company to ensure the extra cash is being used prudently to efficiently support their operations.
Bull markets don’t last forever, and gold miners must use these prosperous times to strengthen their balance sheets, reward shareholders, and reinvest into projects which will provide future value and returns.
Dividend-paying gold stocks increase dividends to reward loyal shareholders, with the average dividend increase of top gold mining stocks in a bull market often doubling.
Over the decades, companies have gotten better at making the most of bull markets in order to be well-guarded for when gold prices stop appreciating, and eventually start declining.
Why Gold Mining Stocks May Still Be Undervalued
Even if gold mining stocks have already seen impressive returns over the past five years, there are some technical indicators which point to them still being undervalued compared to other equities and gold bullion.
- The top 10 gold mining companies have seen their earnings per share estimates almost triple in the past two years.
- The top 20 S&P 500 companies have seen around a -15% decline in their earnings per share estimates.
Along with having better earnings per share compared to the top U.S. equities, gold mining stocks may also be undervalued compared to gold bullion.
The gold mining stocks to gold bullion ratio is at historically low levels after having dropped more than 60% following the 2008 financial crisis. While gold bullion is increasingly seen as a safe haven asset for investors, gold miners are still overlooked despite their strong technicals.
Gold and Gold Miners’ Role in the Future Economy
As money printing has been the Federal Reserve’s main answer to an increasingly volatile economic climate, gold and its producers are set to play a crucial role in helping investors preserve their wealth.
Gold has yet again outperformed just about every other asset class in 2020, and gold miners offer even greater returns for those willing to manage the additional risk they present.
Gold mining stocks are much more volatile compared to gold bullion, and have a variety of additional risks dependent on their company structure, jurisdiction of operations, and operational efficiency. But for investors who are looking for exceptional returns in gold bull markets, they can be an alluring option.


Lithium
Ranked: The Top 10 EV Battery Manufacturers in 2023
Asia dominates this ranking of the world’s largest EV battery manufacturers in 2023.


The Top 10 EV Battery Manufacturers in 2023
This was originally posted on our Voronoi app. Download the app for free on iOS or Android and discover incredible data-driven charts from a variety of trusted sources.
Despite efforts from the U.S. and EU to secure local domestic supply, all major EV battery manufacturers remain based in Asia.
In this graphic we rank the top 10 EV battery manufacturers by total battery deployment (measured in megawatt-hours) in 2023. The data is from EV Volumes.
Chinese Dominance
Contemporary Amperex Technology Co. Limited (CATL) has swiftly risen in less than a decade to claim the title of the largest global battery group.
The Chinese company now has a 34% share of the market and supplies batteries to a range of made-in-China vehicles, including the Tesla Model Y, SAIC’s MG4/Mulan, and various Li Auto models.
| Company | Country | 2023 Production (megawatt-hour) | Share of Total Production |
|---|---|---|---|
| CATL | 🇨🇳 China | 242,700 | 34% |
| BYD | 🇨🇳 China | 115,917 | 16% |
| LG Energy Solution | 🇰🇷 Korea | 108,487 | 15% |
| Panasonic | 🇯🇵 Japan | 56,560 | 8% |
| SK On | 🇰🇷 Korea | 40,711 | 6% |
| Samsung SDI | 🇰🇷 Korea | 35,703 | 5% |
| CALB | 🇨🇳 China | 23,493 | 3% |
| Farasis Energy | 🇨🇳 China | 16,527 | 2% |
| Envision AESC | 🇨🇳 China | 8,342 | 1% |
| Sunwoda | 🇨🇳 China | 6,979 | 1% |
| Other | - | 56,040 | 8% |
In 2023, BYD surpassed LG Energy Solution to claim second place. This was driven by demand from its own models and growth in third-party deals, including providing batteries for the made-in-Germany Tesla Model Y, Toyota bZ3, Changan UNI-V, Venucia V-Online, as well as several Haval and FAW models.
The top three battery makers (CATL, BYD, LG) collectively account for two-thirds (66%) of total battery deployment.
Once a leader in the EV battery business, Panasonic now holds the fourth position with an 8% market share, down from 9% last year. With its main client, Tesla, now sourcing batteries from multiple suppliers, the Japanese battery maker seems to be losing its competitive edge in the industry.
Overall, the global EV battery market size is projected to grow from $49 billion in 2022 to $98 billion by 2029, according to Fortune Business Insights.

-

 Debt1 week ago
How Debt-to-GDP Ratios Have Changed Since 2000
-

 Markets2 weeks ago
Ranked: The World’s Top Flight Routes, by Revenue
-

 Countries2 weeks ago
Population Projections: The World’s 6 Largest Countries in 2075
-

 Markets2 weeks ago
The Top 10 States by Real GDP Growth in 2023
-

 Demographics2 weeks ago
The Smallest Gender Wage Gaps in OECD Countries
-

 United States2 weeks ago
Where U.S. Inflation Hit the Hardest in March 2024
-

 Green2 weeks ago
Top Countries By Forest Growth Since 2001
-

 United States2 weeks ago
Ranked: The Largest U.S. Corporations by Number of Employees