Energy
The Periodic Table of Commodity Returns (2021 Edition)
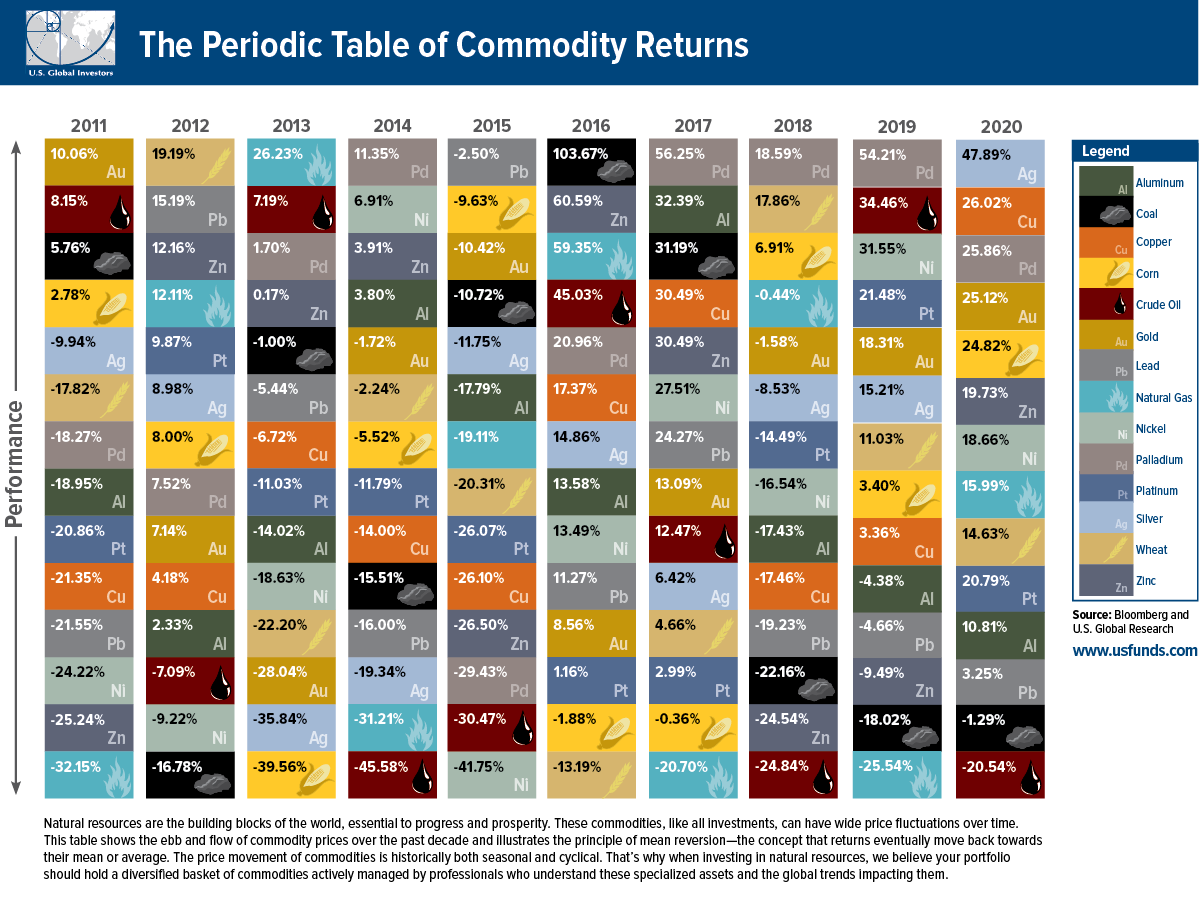
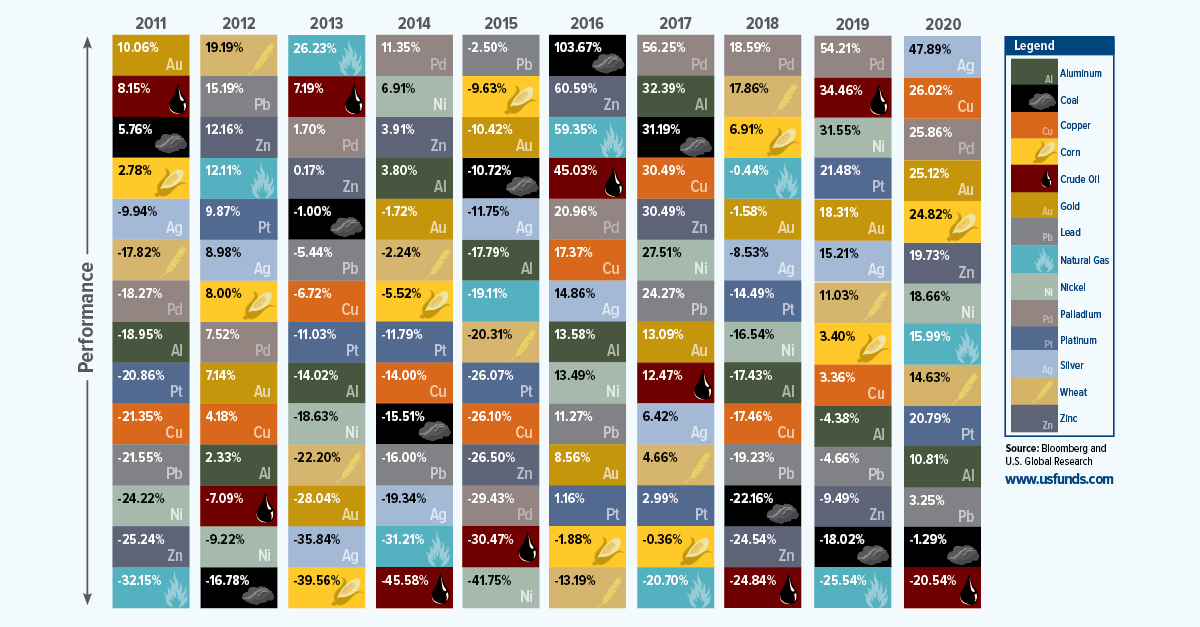
The Periodic Table of Commodity Returns (2011-2020)
Being a commodity investor can feel like riding a roller coaster.
Take silver. Typically known for sharp, idiosyncratic price movements, it faced double-digit declines in the first half of the decade, falling over 35% in just 2013 alone. By contrast, it jumped over 47% in 2020. Similarly, oil, corn, and others witnessed either steep declines or rapid gains.
The above graphic from U.S. Global Investors traces 10 years of commodity price performance, highlighting 14 different commodities and their annual ranking over the years.
Commodity Price Performance, From Best to Worst
Which commodities were the top performers in 2020?
The aforementioned silver tripled its returns year-over-year, climbing 47.9% in 2020. In July, the metal actually experienced its strongest month since 1979.
| Rank | Commodity | Return (2020) | Return (2019) | Return (2018) |
|---|---|---|---|---|
| 1 | Silver | 47.9% | 15.2% | -8.5% |
| 2 | Copper | 26.0% | 3.4% | -17.5% |
| 3 | Palladium | 25.9% | 54.2% | 18.6% |
| 4 | Gold | 25.1% | 18.3% | -1.6% |
| 5 | Corn | 24.8% | 3.4% | 6.9% |
| 6 | Zinc | 19.7% | -9.5% | -24.5% |
| 7 | Nickel | 18.7% | 31.6% | -16.5% |
| 8 | Gas | 16.0% | -25.5% | -0.4% |
| 9 | Wheat | 14.6% | 11.0% | 17.9% |
| 10 | Platinum | 10.9% | 21.5% | -14.5% |
| 11 | Aluminum | 10.8% | -4.4% | -17.4% |
| 12 | Lead | 3.3% | -4.7% | -19.2% |
| 13 | Coal | -1.3% | -18.0% | -22.2% |
| 14 | Oil | -20.5% | 34.5% | -24.8% |
Along with silver, at least seven other commodities had stronger returns than the S&P 500 in 2020, which closed off the year with 16.3% gains. This included copper (26.0%), palladium (25.9%), gold (25.1%) and corn (24.8%).
Interestingly, copper prices moved in an unconventional pattern compared to gold in 2020. Often, investors rush to gold in uncertain economic climates, while sectors such as construction and manufacturing—which both rely heavily on copper—tend to decline. Instead, both copper and gold saw their prices rise in conjunction.
Nowadays, copper is also a vital material in electric vehicles (EVs), with recent demand for EVs also influencing the price of copper.
Silver Linings
As investors flocked to safety, silver’s price reached heights not seen since 2010.
The massive scale of monetary and fiscal stimulus led to inflationary fears, also boosting the price of silver. How does this compare to its returns over the last decade?
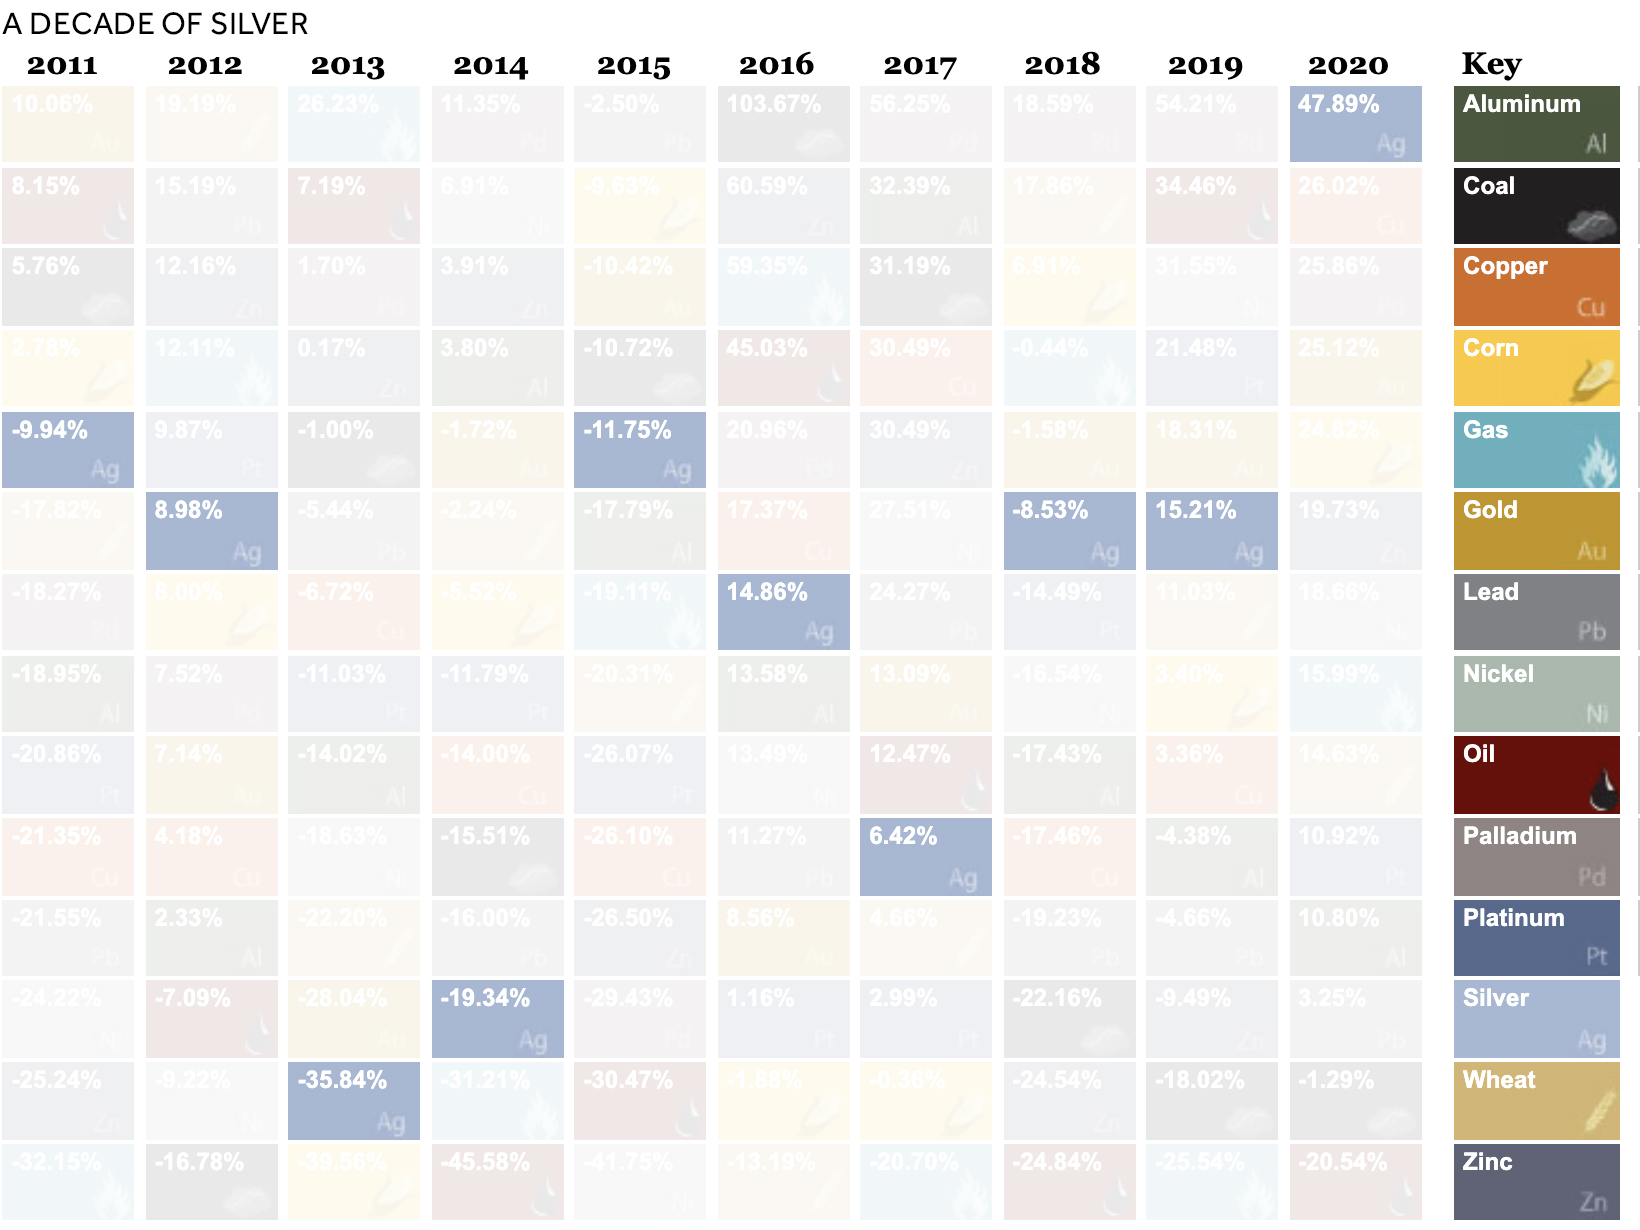
In 2013, silver crashed over 35% as confidence grew in global markets. By contrast, in 2016, the Brexit referendum stirred uncertainty in global markets. Investors allocated money in silver, and prices shifted upwards.
As Gold as the Hills
Like silver, market uncertainty has historically boosted the price of gold.
What else contributed to gold’s rise?
- U.S. debt continues to climb, pushing down confidence in the U.S. dollar
- A weaker U.S. dollar makes gold cheaper for other countries to buy
- Low interest rates kept the returns of other safe haven assets low, making gold more attractive by comparison
Here’s how the price of gold has changed in recent years.
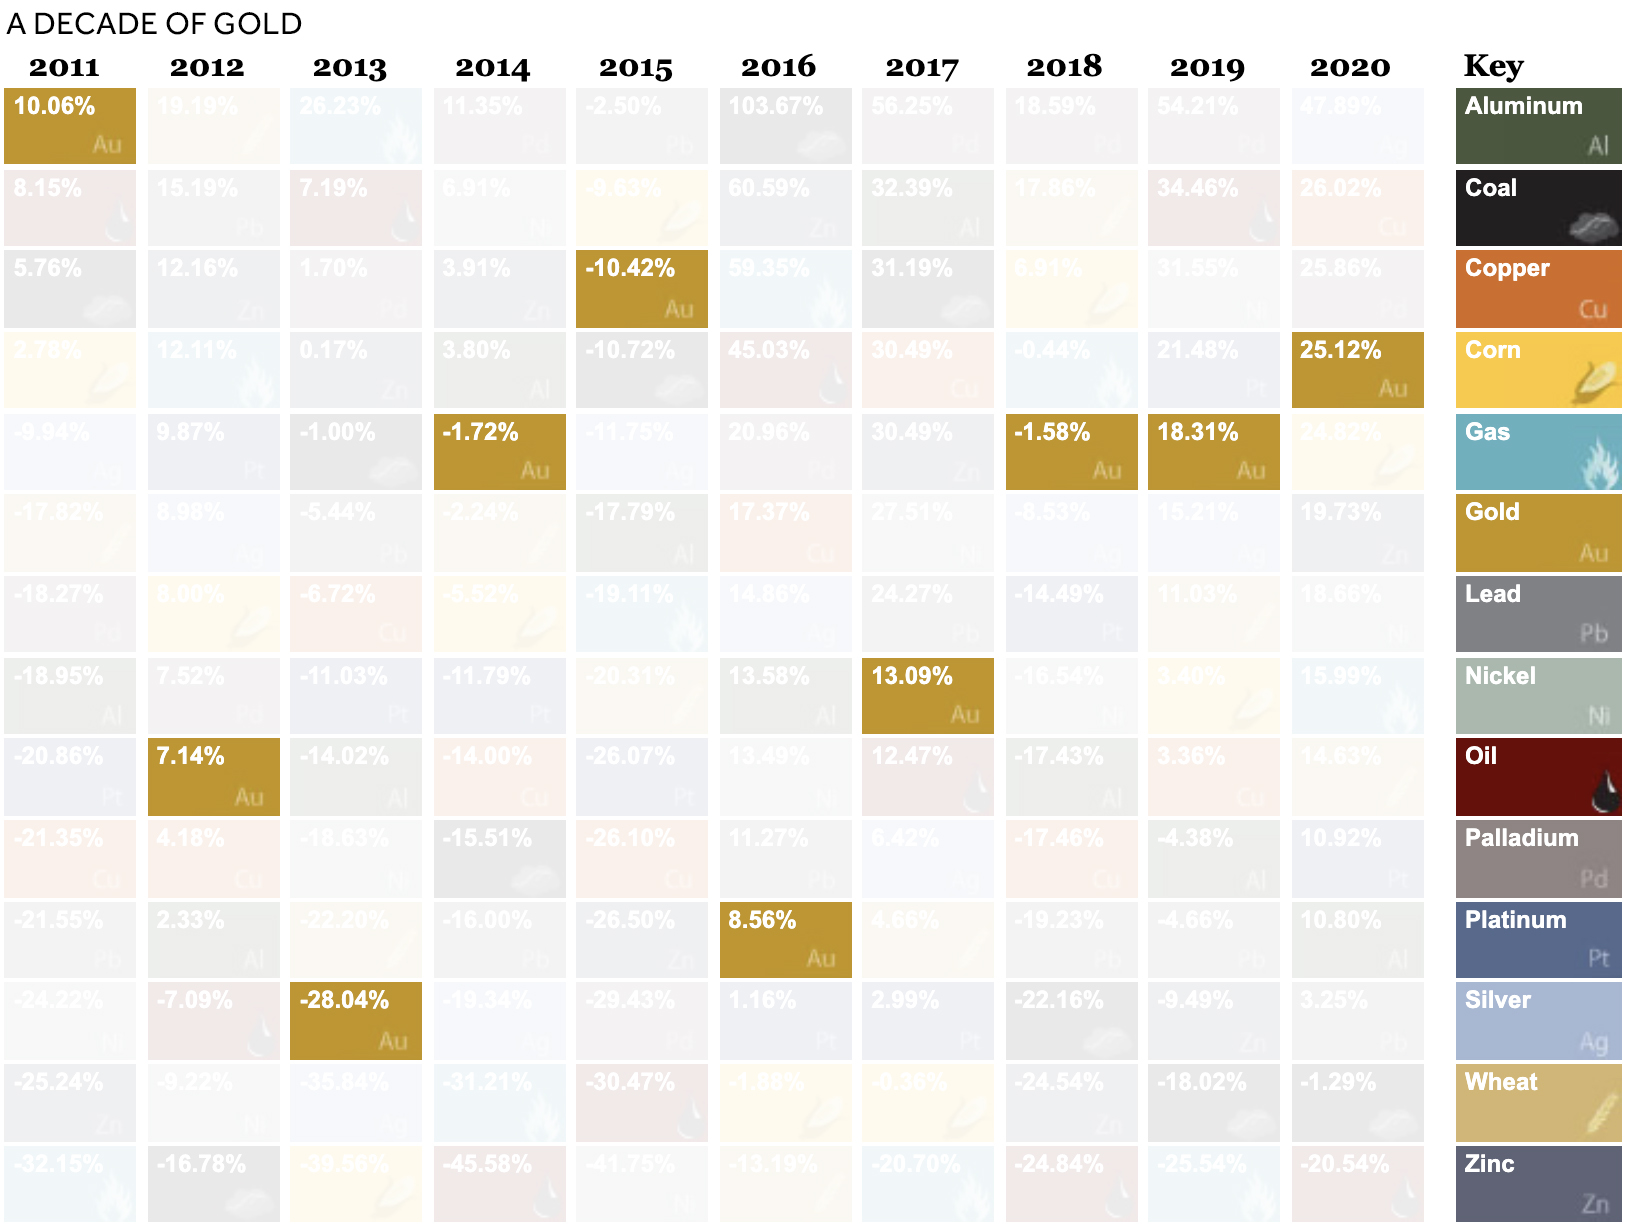
Gold faced its steepest recent declines in 2013, when the Federal Reserve bank discussed tapering down its quantitative easing program in light of economic recovery.
Hitting the Brakes On Oil
Oil suffered the worst commodity price performance in 2020, with -20.5% returns.
For the first time in history, oil prices went negative as demand plummeted. To limit its oversupply, oil producers shrunk investment, closed wells, and turned off valves. Unfortunately, many companies still faced bankruptcies. By November, 45 oil producers had proceeded with bankruptcy filings year-to-date.
This stood in stark contrast to 2019, when prices soared 34.5%.
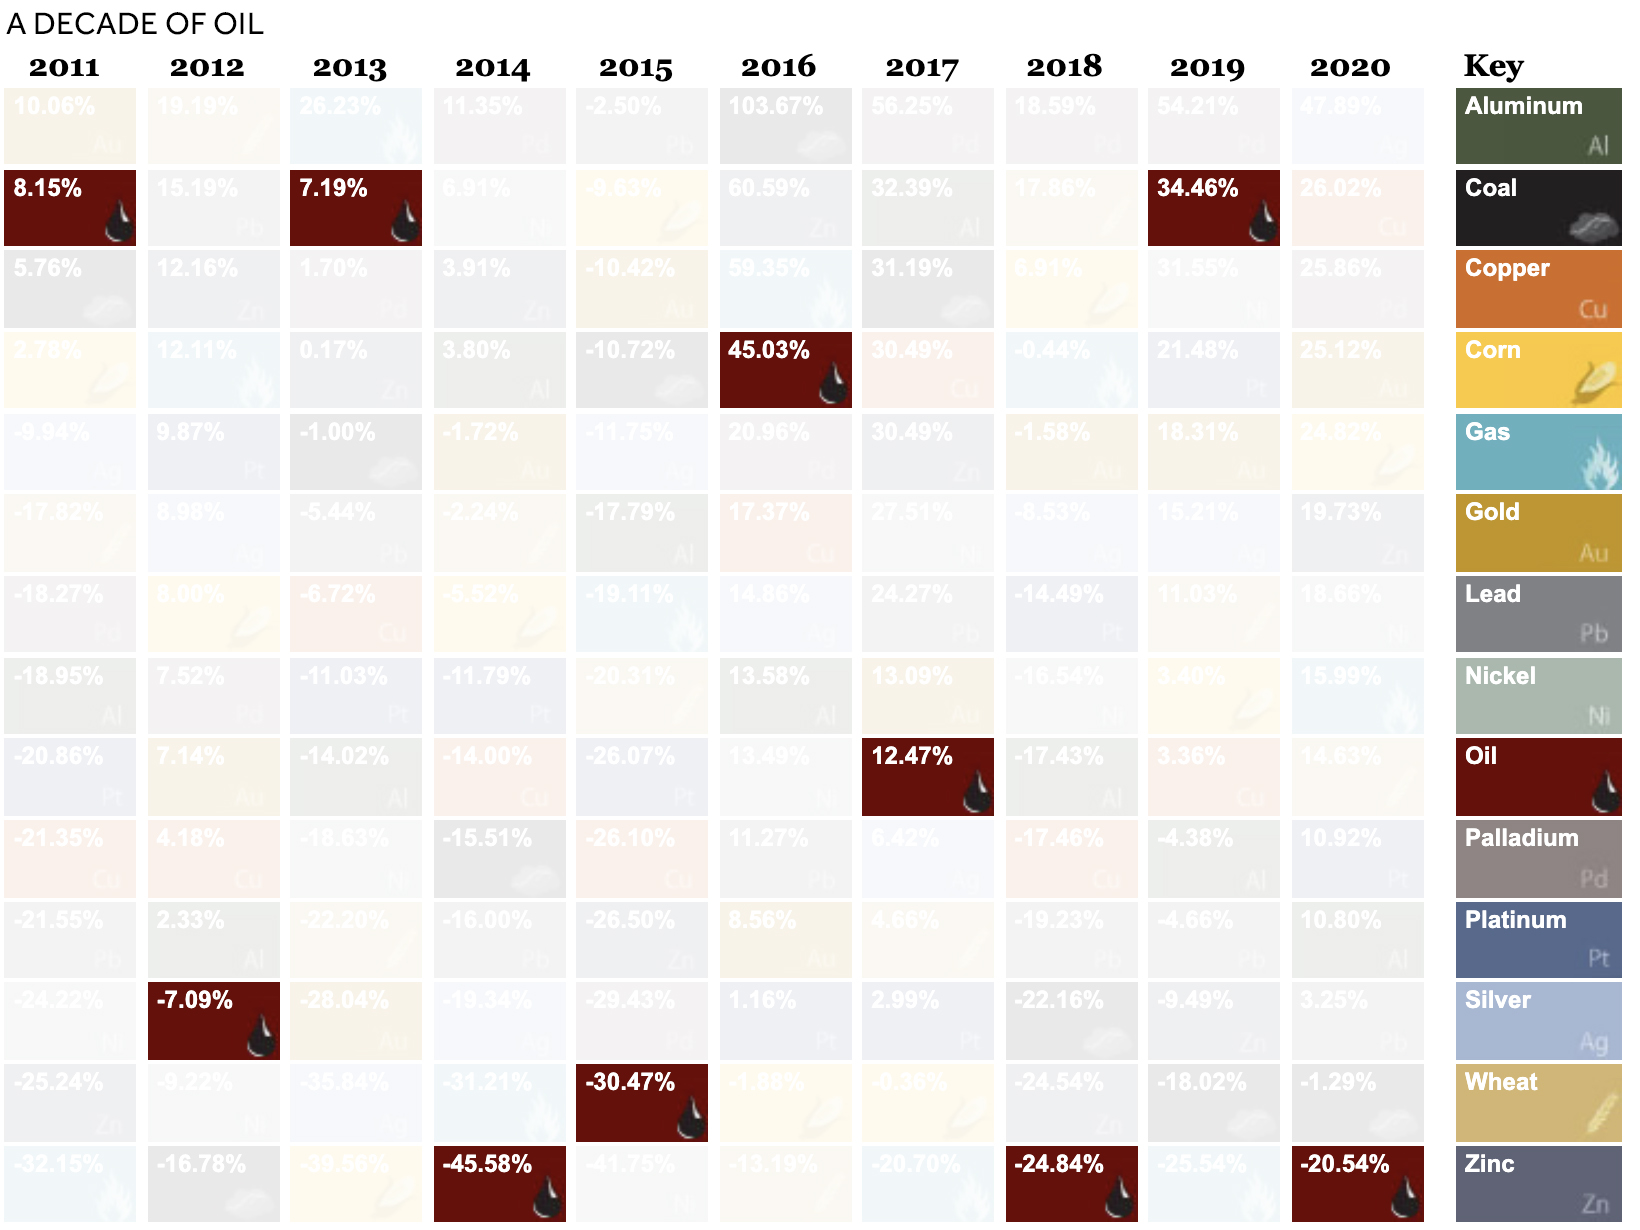
As is custom for oil, prices see-sawed over the decade. In 2016 and 2019, it witnessed gains of over 30%. However, like 2020, in 2014 it saw huge losses due to an oversupply of global petroleum.
In 2020, total production cuts hit 7.2 million barrels a day in December, equal to 7% of global demand, in response to COVID-19.


Energy
Charted: 4 Reasons Why Lithium Could Be the Next Gold Rush
Visual Capitalist has partnered with EnergyX to show why drops in prices and growing demand may make now the right time to invest in lithium.


4 Reasons Why You Should Invest in Lithium
Lithium’s importance in powering EVs makes it a linchpin of the clean energy transition and one of the world’s most precious minerals.
In this graphic, Visual Capitalist partnered with EnergyX to explore why now may be the time to invest in lithium.
1. Lithium Prices Have Dropped
One of the most critical aspects of evaluating an investment is ensuring that the asset’s value is higher than its price would indicate. Lithium is integral to powering EVs, and, prices have fallen fast over the last year:
| Date | LiOH·H₂O* | Li₂CO₃** |
|---|---|---|
| Feb 2023 | $76 | $71 |
| March 2023 | $71 | $61 |
| Apr 2023 | $43 | $33 |
| May 2023 | $43 | $33 |
| June 2023 | $47 | $45 |
| July 2023 | $44 | $40 |
| Aug 2023 | $35 | $35 |
| Sept 2023 | $28 | $27 |
| Oct 2023 | $24 | $23 |
| Nov 2023 | $21 | $21 |
| Dec 2023 | $17 | $16 |
| Jan 2024 | $14 | $15 |
| Feb 2024 | $13 | $14 |
Note: Monthly spot prices were taken as close to the 14th of each month as possible.
*Lithium hydroxide monohydrate MB-LI-0033
**Lithium carbonate MB-LI-0029
2. Lithium-Ion Battery Prices Are Also Falling
The drop in lithium prices is just one reason to invest in the metal. Increasing economies of scale, coupled with low commodity prices, have caused the cost of lithium-ion batteries to drop significantly as well.
In fact, BNEF reports that between 2013 and 2023, the price of a Li-ion battery dropped by 82%.
| Year | Price per KWh |
|---|---|
| 2023 | $139 |
| 2022 | $161 |
| 2021 | $150 |
| 2020 | $160 |
| 2019 | $183 |
| 2018 | $211 |
| 2017 | $258 |
| 2016 | $345 |
| 2015 | $448 |
| 2014 | $692 |
| 2013 | $780 |

3. EV Adoption is Sustainable
One of the best reasons to invest in lithium is that EVs, one of the main drivers behind the demand for lithium, have reached a price point similar to that of traditional vehicle.
According to the Kelly Blue Book, Tesla’s average transaction price dropped by 25% between 2022 and 2023, bringing it in line with many other major manufacturers and showing that EVs are a realistic transport option from a consumer price perspective.
| Manufacturer | September 2022 | September 2023 |
|---|---|---|
| BMW | $69,000 | $72,000 |
| Ford | $54,000 | $56,000 |
| Volkswagon | $54,000 | $56,000 |
| General Motors | $52,000 | $53,000 |
| Tesla | $68,000 | $51,000 |
4. Electricity Demand in Transport is Growing
As EVs become an accessible transport option, there’s an investment opportunity in lithium. But possibly the best reason to invest in lithium is that the IEA reports global demand for the electricity in transport could grow dramatically by 2030:
| Transport Type | 2022 | 2025 | 2030 |
|---|---|---|---|
| Buses 🚌 | 23,000 GWh | 50,000 GWh | 130,000 GWh |
| Cars 🚙 | 65,000 GWh | 200,000 GWh | 570,000 GWh |
| Trucks 🛻 | 4,000 GWh | 15,000 GWh | 94,000 GWh |
| Vans 🚐 | 6,000 GWh | 16,000 GWh | 72,000 GWh |
The Lithium Investment Opportunity
Lithium presents a potentially classic investment opportunity. Lithium and battery prices have dropped significantly, and recently, EVs have reached a price point similar to other vehicles. By 2030, the demand for clean energy, especially in transport, will grow dramatically.
With prices dropping and demand skyrocketing, now is the time to invest in lithium.
EnergyX is poised to exploit lithium demand with cutting-edge lithium extraction technology capable of extracting 300% more lithium than current processes.

-

 Lithium5 days ago
Ranked: The Top 10 EV Battery Manufacturers in 2023
Asia dominates this ranking of the world’s largest EV battery manufacturers in 2023.
-

 Energy1 week ago
The World’s Biggest Nuclear Energy Producers
China has grown its nuclear capacity over the last decade, now ranking second on the list of top nuclear energy producers.
-

 Energy1 month ago
The World’s Biggest Oil Producers in 2023
Just three countries accounted for 40% of global oil production last year.
-

 Energy1 month ago
How Much Does the U.S. Depend on Russian Uranium?
Currently, Russia is the largest foreign supplier of nuclear power fuel to the U.S.
-

 Uranium2 months ago
Charted: Global Uranium Reserves, by Country
We visualize the distribution of the world’s uranium reserves by country, with 3 countries accounting for more than half of total reserves.
-

 Energy3 months ago
Visualizing the Rise of the U.S. as Top Crude Oil Producer
Over the last decade, the United States has established itself as the world’s top producer of crude oil, surpassing Saudi Arabia and Russia.

-

 Debt1 week ago
How Debt-to-GDP Ratios Have Changed Since 2000
-

 Markets2 weeks ago
Ranked: The World’s Top Flight Routes, by Revenue
-

 Countries2 weeks ago
Population Projections: The World’s 6 Largest Countries in 2075
-

 Markets2 weeks ago
The Top 10 States by Real GDP Growth in 2023
-

 Demographics2 weeks ago
The Smallest Gender Wage Gaps in OECD Countries
-

 United States2 weeks ago
Where U.S. Inflation Hit the Hardest in March 2024
-

 Green2 weeks ago
Top Countries By Forest Growth Since 2001
-

 United States2 weeks ago
Ranked: The Largest U.S. Corporations by Number of Employees