Energy
Tracking the Growing Wave of Oil & Gas Bankruptcies in 2020


The Growing Wave of Oil & Gas Bankruptcies in 2020
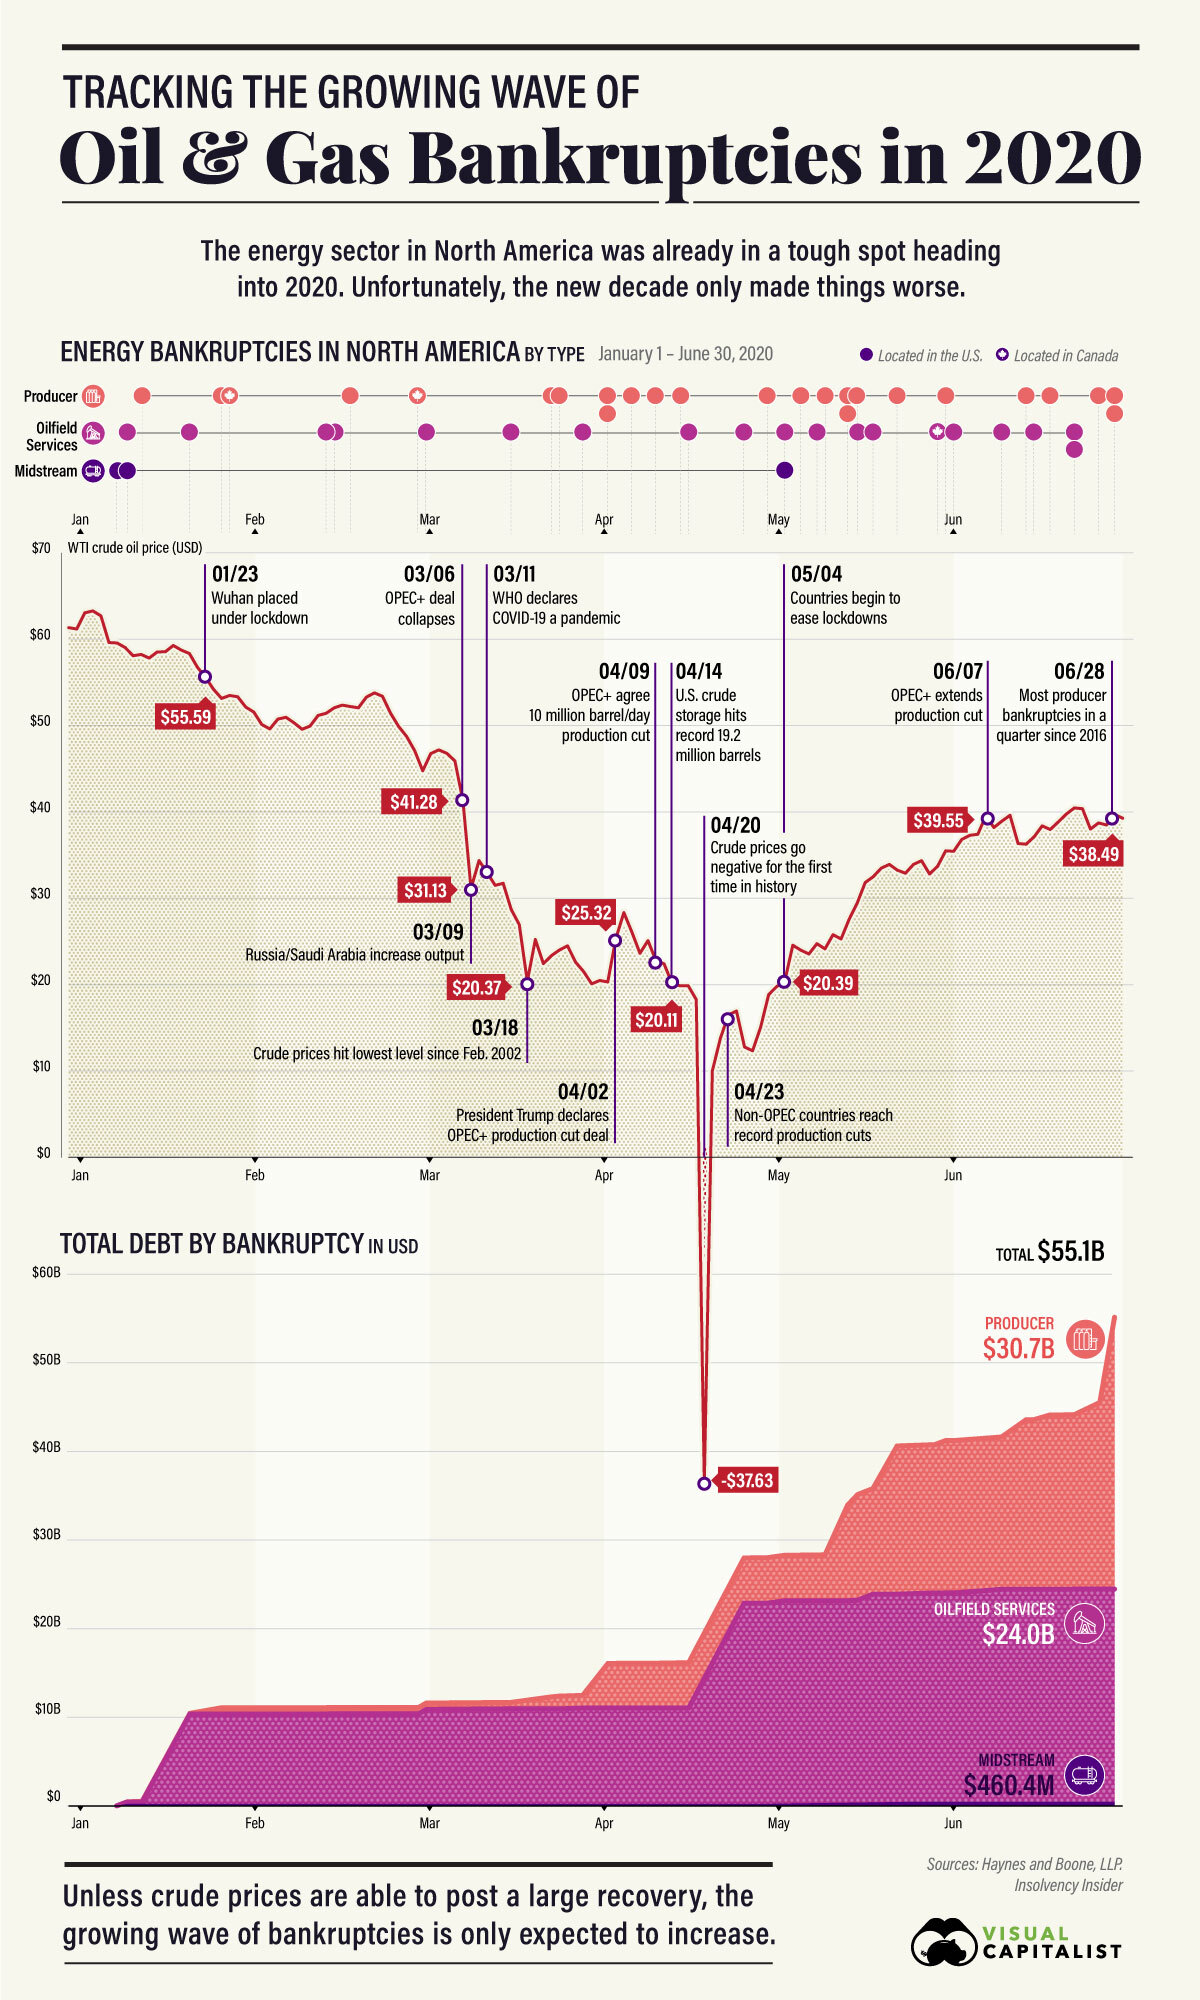
2020 hasn’t been kind to the energy sector, and a growing wave of energy bankruptcies has started to build.
After a difficult year marred by rising geopolitical tensions in the Middle East and crude prices in the $50-60 per barrel range, analysts warned that the energy sector needed a strong recovery to offset a rising (and expiring) mountain of debt.
Instead, the oil patch has seen one bombshell after another, and the impacts are adding up.
Fueling the Wave’s Growth
The new year opened with a U.S. attack on a top-ranking Iranian general in Baghdad, followed by an Iranian counterattack on two bases in Iraq that hosted U.S. military personnel.
Then, the energy industry worried that the Organization of the Petroleum Exporting Countries (OPEC) wouldn’t renew its production deal with non-member countries, causing increased production and negative pressure on crude prices.
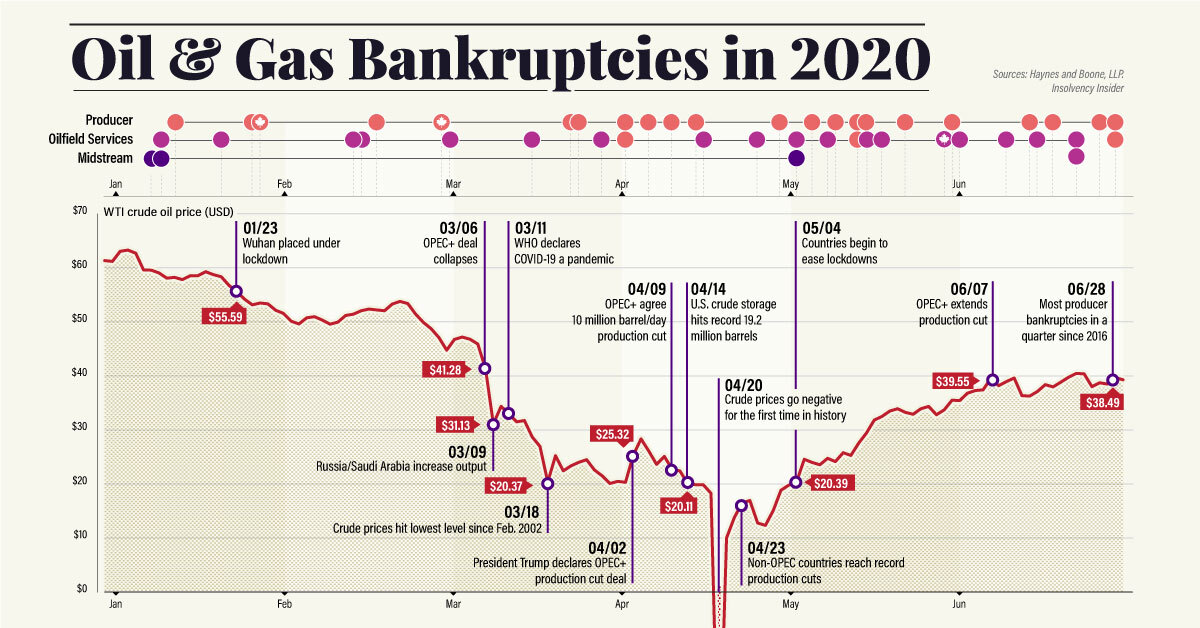
All the while, the threat of COVID-19 grew and started to spread. In March, the new coronavirus hit markets hardest, right as the OPEC+ deal collapsed. Russia and Saudi Arabia subsequently flooded the markets with cheap oil, starting a price war to drive out competition.
What developed was the perfect storm of nonexistent demand matched up against oversupply. Crude prices plummeted and hit a historic sub-zero low on April 20th, with futures for West Texas Intermediate (WTI) Crude closing at -$37.63.
The Wave’s Initial Damage
Now, following a renewed OPEC+ deal limiting production agreed upon on April 9th and slowly restarting economies driving up crude demand, prices have started to tick up.
Unfortunately, the damage has already been done and will take a long time to recover. By charting the sector’s bankruptcies over the first half of 2020—tracked by law firm Haynes and Boone, LLP for the U.S. and Insolvency Insider for Canada—we can see the wave start to swell:
| Company Type | Q1 Bankruptcies | Q2 Bankruptcies | Total (H1 2020) |
|---|---|---|---|
| Oil & Gas Producer | 7 | 18 | 25 |
| Oilfield Services | 7 | 12 | 19 |
| Midstream Services | 2 | 1 | 3 |
| Total | 16 | 31 | 47 |
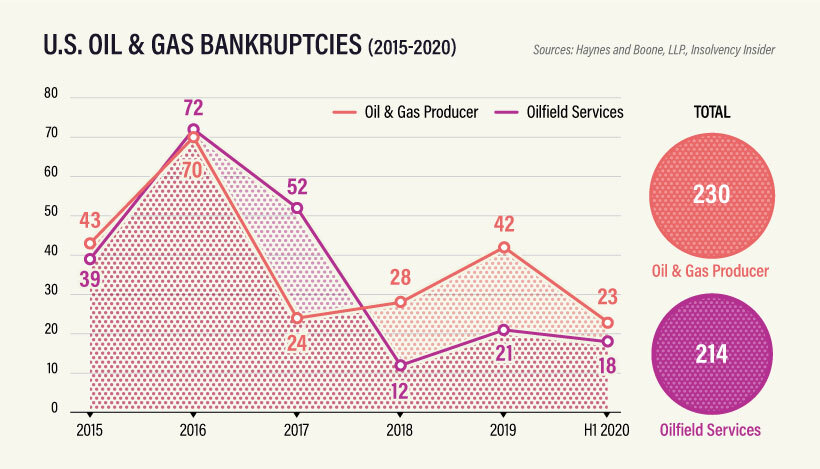
For oil and gas producers, the second quarter of 2020 saw 18 bankruptcies, the highest quarterly total since 2016.
So far, they’re largely centered in the U.S., which saw a boom of surface-level shale oil production in the 2010’s to take advantage of rising crude prices. As prices have dropped, many heavily leveraged companies have started to run out of options.
| Company Type | Q1 Total Debt | Q2 Total Debt | Total (H1 2020) |
|---|---|---|---|
| Oil & Gas Producer | $1.4 billion | $29.2 billion | $30.7 billion |
| Oilfield Services | $10.8 billion | $13.2 billion | $24 billion |
| Midstream Services | $0.2 billion | $0.2 billion | $0.5 billion |
| Total | $12.5 billion | $42.7 billion | $55.1 billion |
The biggest victim in the first half of 2020 was Chesapeake Energy, a shale giant that declared bankruptcy on June 28 with more than $9 billion in debt.
Canada has also seen an uptick in energy bankruptcies, especially after facing years of stiff competition from U.S. shale producers. However, the number of cases in Canada is far fewer than in the United States.
One reason is that companies staved off bankruptcy or receivership in four of the seven insolvency cases in Canada since January 2020, at least temporarily. Instead, they are seeking protection under the country’s Companies’ Creditors Arrangement Act, giving them a chance to restructure and avoid insolvency.
A Prolonged Fallout
Another reason for the discrepancy in bankruptcy numbers is timing. The energy sector faced its biggest challenges in 2015/2016, causing many companies to take on debt.
Unfortunately, much of that debt is starting to expire, or becoming too difficult to pay off in the current market conditions.
That’s why, despite the wave of bankruptcies caused by COVID-19 gaining steam, the wave will continue well into 2020 and likely beyond.
July has already seen more companies declaring bankruptcy or seeking creditor protection. The question is, how many more are waiting to surface?


Energy
Charted: 4 Reasons Why Lithium Could Be the Next Gold Rush
Visual Capitalist has partnered with EnergyX to show why drops in prices and growing demand may make now the right time to invest in lithium.


4 Reasons Why You Should Invest in Lithium
Lithium’s importance in powering EVs makes it a linchpin of the clean energy transition and one of the world’s most precious minerals.
In this graphic, Visual Capitalist partnered with EnergyX to explore why now may be the time to invest in lithium.
1. Lithium Prices Have Dropped
One of the most critical aspects of evaluating an investment is ensuring that the asset’s value is higher than its price would indicate. Lithium is integral to powering EVs, and, prices have fallen fast over the last year:
| Date | LiOH·H₂O* | Li₂CO₃** |
|---|---|---|
| Feb 2023 | $76 | $71 |
| March 2023 | $71 | $61 |
| Apr 2023 | $43 | $33 |
| May 2023 | $43 | $33 |
| June 2023 | $47 | $45 |
| July 2023 | $44 | $40 |
| Aug 2023 | $35 | $35 |
| Sept 2023 | $28 | $27 |
| Oct 2023 | $24 | $23 |
| Nov 2023 | $21 | $21 |
| Dec 2023 | $17 | $16 |
| Jan 2024 | $14 | $15 |
| Feb 2024 | $13 | $14 |
Note: Monthly spot prices were taken as close to the 14th of each month as possible.
*Lithium hydroxide monohydrate MB-LI-0033
**Lithium carbonate MB-LI-0029
2. Lithium-Ion Battery Prices Are Also Falling
The drop in lithium prices is just one reason to invest in the metal. Increasing economies of scale, coupled with low commodity prices, have caused the cost of lithium-ion batteries to drop significantly as well.
In fact, BNEF reports that between 2013 and 2023, the price of a Li-ion battery dropped by 82%.
| Year | Price per KWh |
|---|---|
| 2023 | $139 |
| 2022 | $161 |
| 2021 | $150 |
| 2020 | $160 |
| 2019 | $183 |
| 2018 | $211 |
| 2017 | $258 |
| 2016 | $345 |
| 2015 | $448 |
| 2014 | $692 |
| 2013 | $780 |

3. EV Adoption is Sustainable
One of the best reasons to invest in lithium is that EVs, one of the main drivers behind the demand for lithium, have reached a price point similar to that of traditional vehicle.
According to the Kelly Blue Book, Tesla’s average transaction price dropped by 25% between 2022 and 2023, bringing it in line with many other major manufacturers and showing that EVs are a realistic transport option from a consumer price perspective.
| Manufacturer | September 2022 | September 2023 |
|---|---|---|
| BMW | $69,000 | $72,000 |
| Ford | $54,000 | $56,000 |
| Volkswagon | $54,000 | $56,000 |
| General Motors | $52,000 | $53,000 |
| Tesla | $68,000 | $51,000 |
4. Electricity Demand in Transport is Growing
As EVs become an accessible transport option, there’s an investment opportunity in lithium. But possibly the best reason to invest in lithium is that the IEA reports global demand for the electricity in transport could grow dramatically by 2030:
| Transport Type | 2022 | 2025 | 2030 |
|---|---|---|---|
| Buses 🚌 | 23,000 GWh | 50,000 GWh | 130,000 GWh |
| Cars 🚙 | 65,000 GWh | 200,000 GWh | 570,000 GWh |
| Trucks 🛻 | 4,000 GWh | 15,000 GWh | 94,000 GWh |
| Vans 🚐 | 6,000 GWh | 16,000 GWh | 72,000 GWh |
The Lithium Investment Opportunity
Lithium presents a potentially classic investment opportunity. Lithium and battery prices have dropped significantly, and recently, EVs have reached a price point similar to other vehicles. By 2030, the demand for clean energy, especially in transport, will grow dramatically.
With prices dropping and demand skyrocketing, now is the time to invest in lithium.
EnergyX is poised to exploit lithium demand with cutting-edge lithium extraction technology capable of extracting 300% more lithium than current processes.

-

 Lithium5 days ago
Ranked: The Top 10 EV Battery Manufacturers in 2023
Asia dominates this ranking of the world’s largest EV battery manufacturers in 2023.
-

 Energy1 week ago
The World’s Biggest Nuclear Energy Producers
China has grown its nuclear capacity over the last decade, now ranking second on the list of top nuclear energy producers.
-

 Energy1 month ago
The World’s Biggest Oil Producers in 2023
Just three countries accounted for 40% of global oil production last year.
-

 Energy1 month ago
How Much Does the U.S. Depend on Russian Uranium?
Currently, Russia is the largest foreign supplier of nuclear power fuel to the U.S.
-

 Uranium2 months ago
Charted: Global Uranium Reserves, by Country
We visualize the distribution of the world’s uranium reserves by country, with 3 countries accounting for more than half of total reserves.
-

 Energy3 months ago
Visualizing the Rise of the U.S. as Top Crude Oil Producer
Over the last decade, the United States has established itself as the world’s top producer of crude oil, surpassing Saudi Arabia and Russia.


-

 Debt1 week ago
How Debt-to-GDP Ratios Have Changed Since 2000
-

 Markets2 weeks ago
Ranked: The World’s Top Flight Routes, by Revenue
-

 Countries2 weeks ago
Population Projections: The World’s 6 Largest Countries in 2075
-

 Markets2 weeks ago
The Top 10 States by Real GDP Growth in 2023
-

 Demographics2 weeks ago
The Smallest Gender Wage Gaps in OECD Countries
-

 United States2 weeks ago
Where U.S. Inflation Hit the Hardest in March 2024
-

 Green2 weeks ago
Top Countries By Forest Growth Since 2001
-

 United States2 weeks ago
Ranked: The Largest U.S. Corporations by Number of Employees