Energy
Connected Workers: How Digital Transformation is Shaping Industry’s Future

Connected Workers: Shaping the Future of Industry
Digital transformation has upended businesses on a global scale, and no industry is immune from its powerful effects.
New technologies and enhancing customer experience are key drivers for companies investing in digital transformation, but the most important reason for prioritizing this shift is that it will allow them to leverage entirely new opportunities for growth.
However, with the speed of digital transformation accelerating at a furious pace, companies need to quickly adapt their working environment to keep up. This graphic from mCloud unearths the origins of the connected worker, and explores the potential applications of connected devices across industries.
The Rise of the Connected Worker
The mass adoption of smart devices has sparked a new wave of remote work. This type of working arrangement is estimated to inject $441 billion into the global economy every year, and save 2.5 million metric tonnes of CO2 by 2029—the equivalent of 1,280 flights between New York and London.
However, flexible or remote working looks different depending on the industry. For example, in the context of business services such as engineering or manufacturing, employees who carry out different tasks remotely using digital technologies are known as connected workers.
The term is not a one-size-fits-all, as there are many different types of connected workers with different roles, such as operators, field workers, engineers, and even executives. But regardless of an individual’s title, every connected worker plays a crucial role in achieving digital transformation.
Real Time Data, Real Time Benefits
When workers are connected to assets in real time, they can make better, more informed decisions—ultimately becoming a more efficient workforce overall. As a result, industries could unlock a wealth of benefits, such as:
- Reducing human error
- Increasing productivity
- Reducing dangerous incidents
- Saving time and money
- Monitoring assets 24/7
While connected workers can enhance the potential of industries, the tools they use to achieve these benefits are crucial to their success.
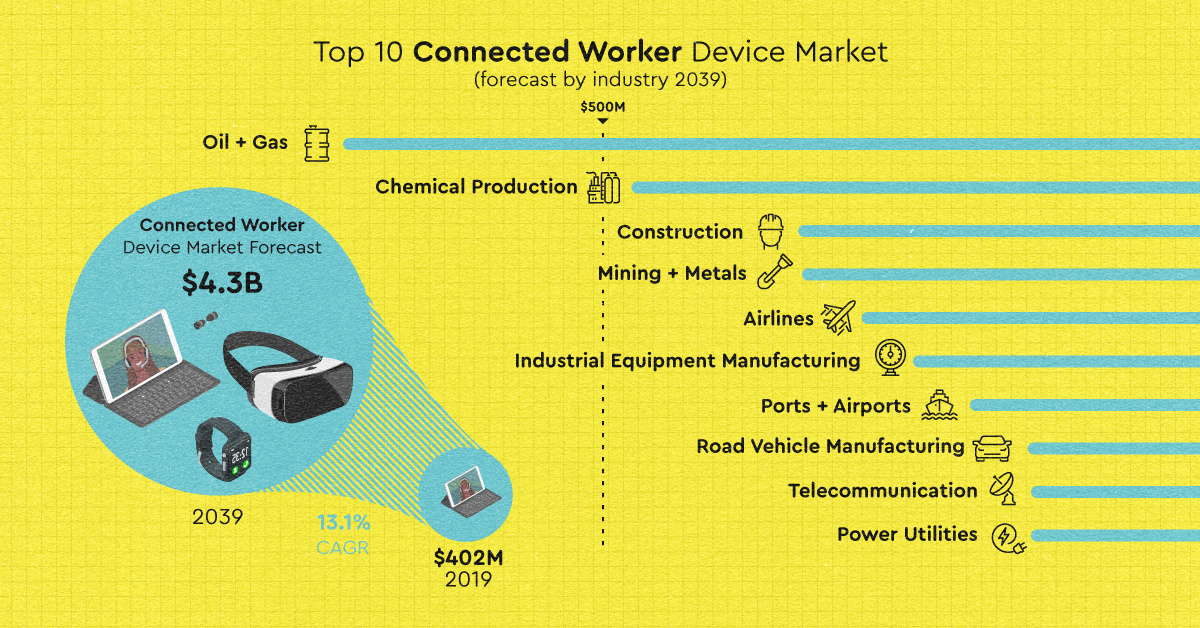
Connected Worker Technologies
A connected device has the ability to connect with other devices and systems through the internet. The connected worker device market is set for rapid growth over the next two decades, reaching $4.3 billion by 2039. Industries such as oil and gas, chemical production, and construction lead the way in the adoption of connected worker technologies, which include:
- Platforms: Hardware or software that uses artificial intelligence and data to allow engineers to create bespoke applications and control manufacturing processes remotely.
- Interfaces: Technologies such as 3D digital twins enable peer-to-peer information sharing. They also create an immersive reflection of surroundings that would have otherwise been inaccessible by workers, such as wind turbine blades.
- Smart sensors and IoT devices: Sensors that monitor assets provide a more holistic overview of industrial processes in real time and prevent dangerous incidents.
- Cloud and edge computing: Using the cloud allows workers to communicate with each other and manage shared data more efficiently.
Over time, connected devices are getting smarter and expanding their capabilities. Moreover, devices such as wearables are becoming more discreet than ever, and can even be embedded into personal protective equipment to gather data while remaining unobtrusive.
Real World Applications
With seemingly endless potential, these devices have the ability to provide game changing solutions to ongoing challenges across dozens of industries.
- Building Maintenance and Management
Facility managers can access real time information and connect with maintenance workers on site to resolve issues quickly. Building personnel can also access documentation and remote help through connected technologies. - Task Management
Operators in industrial settings such as mining can control activities in remote locations. They can also enable field personnel to connect with experts in other locations. - Communications Platform
Cloud-based communication platforms can provide healthcare practitioners with a tool to connect with the patient, the patient’s family and emergency care personnel.
By harnessing the power of artificial intelligence, the Internet of Things, and analytics, connected workers can continue to revolutionize businesses and industries across the globe.
Towards a More Connected Future
As companies navigate the challenges of COVID-19, implementing connected worker technologies and creating a data-driven work environment may quickly become an increasingly important priority.
Not only is digital transformation important for leveraging new growth opportunities to scale, it may be crucial for determining the future of certain businesses and industries.


Energy
Charted: 4 Reasons Why Lithium Could Be the Next Gold Rush
Visual Capitalist has partnered with EnergyX to show why drops in prices and growing demand may make now the right time to invest in lithium.


4 Reasons Why You Should Invest in Lithium
Lithium’s importance in powering EVs makes it a linchpin of the clean energy transition and one of the world’s most precious minerals.
In this graphic, Visual Capitalist partnered with EnergyX to explore why now may be the time to invest in lithium.
1. Lithium Prices Have Dropped
One of the most critical aspects of evaluating an investment is ensuring that the asset’s value is higher than its price would indicate. Lithium is integral to powering EVs, and, prices have fallen fast over the last year:
| Date | LiOH·H₂O* | Li₂CO₃** |
|---|---|---|
| Feb 2023 | $76 | $71 |
| March 2023 | $71 | $61 |
| Apr 2023 | $43 | $33 |
| May 2023 | $43 | $33 |
| June 2023 | $47 | $45 |
| July 2023 | $44 | $40 |
| Aug 2023 | $35 | $35 |
| Sept 2023 | $28 | $27 |
| Oct 2023 | $24 | $23 |
| Nov 2023 | $21 | $21 |
| Dec 2023 | $17 | $16 |
| Jan 2024 | $14 | $15 |
| Feb 2024 | $13 | $14 |
Note: Monthly spot prices were taken as close to the 14th of each month as possible.
*Lithium hydroxide monohydrate MB-LI-0033
**Lithium carbonate MB-LI-0029
2. Lithium-Ion Battery Prices Are Also Falling
The drop in lithium prices is just one reason to invest in the metal. Increasing economies of scale, coupled with low commodity prices, have caused the cost of lithium-ion batteries to drop significantly as well.
In fact, BNEF reports that between 2013 and 2023, the price of a Li-ion battery dropped by 82%.
| Year | Price per KWh |
|---|---|
| 2023 | $139 |
| 2022 | $161 |
| 2021 | $150 |
| 2020 | $160 |
| 2019 | $183 |
| 2018 | $211 |
| 2017 | $258 |
| 2016 | $345 |
| 2015 | $448 |
| 2014 | $692 |
| 2013 | $780 |

3. EV Adoption is Sustainable
One of the best reasons to invest in lithium is that EVs, one of the main drivers behind the demand for lithium, have reached a price point similar to that of traditional vehicle.
According to the Kelly Blue Book, Tesla’s average transaction price dropped by 25% between 2022 and 2023, bringing it in line with many other major manufacturers and showing that EVs are a realistic transport option from a consumer price perspective.
| Manufacturer | September 2022 | September 2023 |
|---|---|---|
| BMW | $69,000 | $72,000 |
| Ford | $54,000 | $56,000 |
| Volkswagon | $54,000 | $56,000 |
| General Motors | $52,000 | $53,000 |
| Tesla | $68,000 | $51,000 |
4. Electricity Demand in Transport is Growing
As EVs become an accessible transport option, there’s an investment opportunity in lithium. But possibly the best reason to invest in lithium is that the IEA reports global demand for the electricity in transport could grow dramatically by 2030:
| Transport Type | 2022 | 2025 | 2030 |
|---|---|---|---|
| Buses 🚌 | 23,000 GWh | 50,000 GWh | 130,000 GWh |
| Cars 🚙 | 65,000 GWh | 200,000 GWh | 570,000 GWh |
| Trucks 🛻 | 4,000 GWh | 15,000 GWh | 94,000 GWh |
| Vans 🚐 | 6,000 GWh | 16,000 GWh | 72,000 GWh |
The Lithium Investment Opportunity
Lithium presents a potentially classic investment opportunity. Lithium and battery prices have dropped significantly, and recently, EVs have reached a price point similar to other vehicles. By 2030, the demand for clean energy, especially in transport, will grow dramatically.
With prices dropping and demand skyrocketing, now is the time to invest in lithium.
EnergyX is poised to exploit lithium demand with cutting-edge lithium extraction technology capable of extracting 300% more lithium than current processes.

-

 Lithium5 days ago
Ranked: The Top 10 EV Battery Manufacturers in 2023
Asia dominates this ranking of the world’s largest EV battery manufacturers in 2023.
-

 Energy1 week ago
The World’s Biggest Nuclear Energy Producers
China has grown its nuclear capacity over the last decade, now ranking second on the list of top nuclear energy producers.
-

 Energy1 month ago
The World’s Biggest Oil Producers in 2023
Just three countries accounted for 40% of global oil production last year.
-

 Energy1 month ago
How Much Does the U.S. Depend on Russian Uranium?
Currently, Russia is the largest foreign supplier of nuclear power fuel to the U.S.
-

 Uranium2 months ago
Charted: Global Uranium Reserves, by Country
We visualize the distribution of the world’s uranium reserves by country, with 3 countries accounting for more than half of total reserves.
-

 Energy3 months ago
Visualizing the Rise of the U.S. as Top Crude Oil Producer
Over the last decade, the United States has established itself as the world’s top producer of crude oil, surpassing Saudi Arabia and Russia.

-

 Debt1 week ago
How Debt-to-GDP Ratios Have Changed Since 2000
-

 Markets2 weeks ago
Ranked: The World’s Top Flight Routes, by Revenue
-

 Countries2 weeks ago
Population Projections: The World’s 6 Largest Countries in 2075
-

 Markets2 weeks ago
The Top 10 States by Real GDP Growth in 2023
-

 Demographics2 weeks ago
The Smallest Gender Wage Gaps in OECD Countries
-

 United States2 weeks ago
Where U.S. Inflation Hit the Hardest in March 2024
-

 Green2 weeks ago
Top Countries By Forest Growth Since 2001
-

 United States2 weeks ago
Ranked: The Largest U.S. Corporations by Number of Employees