Technology
Animated Map: What America Searched for on Google, Over the Last Decade
What America Searched for on Google, in the Last Decade
Cultural shifts come in many shapes and forms, and some are harder to measure than others.
Thankfully, Google search volume provides an easy avenue for measuring large-scale cultural trends. And because Google makes up more than 90% of all internet searches in the U.S., looking at what’s trending on Google is a great way to understand the shifting questions and interests that are captivating society at any given time.
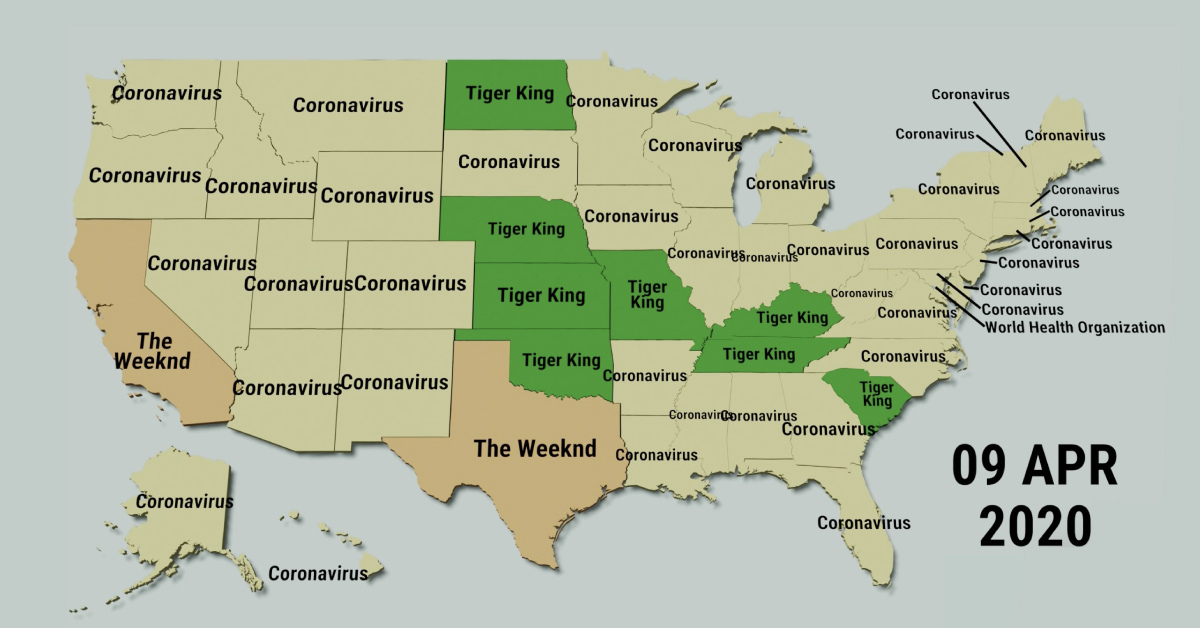
This animated map by V1 Analytics provides an overview of the top trending Google searches in every state over the last decade. It sheds light on what types of new information, events, and stories received the most attention in the last ten years—and more generally, it shows us what the U.S. population has been thinking about.
Trending Searches versus Top Searches
Before diving into the top trends of the decade, it’s worth taking a moment to distinguish between “trending searches” and “top searches”:
- Trending Searches: Keywords that had the largest increase in traffic, in a specific period of time
- Top Searches: The most searched keywords in a given time frame
This video would look a lot different, and a lot less interesting, if it showed Google’s top searches. To give some perspective, here are the Top 10 Searches in the U.S. (as of 2020):
| Rank | Keyword |
|---|---|
| #1 | |
| #2 | youtube |
| #3 | amazon |
| #4 | gmail |
| #5 | |
| #6 | weather |
| #7 | ebay |
| #8 | yahoo |
| #9 | walmart |
| #10 | yahoo mail |
Understanding the difference between trending searches and top searches is important because it gives us insight into why certain keywords trend in some places, but not others. For instance, in March 2020, the word “coronavirus” was trending throughout a majority of the U.S., with a few exceptions—it wasn’t trending in Massachusetts, California, Texas, Nevada, or Arizona.
It’s easy to make the assumption that people in these states were not concerned about COVID-19—however, that’s not necessarily the case.
It’s important to remember that trending searches are measured by the increase of traffic, not just the overall amount of searches. Therefore, in states where it wasn’t trending, the word “coronavirus” may have already been a popular search term for a while, so the keyword didn’t see a sudden spike in interest like it did in other places.
Undivided Attention
In the last decade, there were moments when the entire country was googling the same thing. Some keyword trends lasted a day, while others lasted over a week.
Here’s a look at keywords that took over the whole U.S, and when they were trending unanimously:
| Date Range | Category | Search Term |
|---|---|---|
| Feb 4, 2011 | Music | Adele |
| Feb 6 - Feb 23, 2011 | Music | Born This Way |
| Feb 28, 2011 | Music | Born This Way |
| March 22 - Apr 1, 2011 | Pop Culture | Rebecca Black |
| June 12 - June 27, 2011 | TV & Film | Game of Thrones |
| Nov 9, 2012 | Current Events | Abortion |
| Jan 10 - Jan 27, 2014 | TV & Film | Frozen |
| Feb 28 - March 2, 2014 | Electronics | Samsung Galaxy s5 |
| Jan 11 - Jan 13, 2015 | Music | Blank Space |
| Feb 26 - Mar 30, 2015 | Music | Uptown Funk |
| June 5, 2015 | Pop Culture | Caitlyn Jenner |
| June 16 - June 19, 2015 | TV & Film | Jurassic World |
| Feb 26, 2016 | Pop Culture | Damn Daniel |
| June 3, 2016 | Pop Culture | Harambe |
| June 20, 2016 | TV & Film | Finding Dory |
| June 30, 2016 | TV & Film | Finding Dory |
| July 6, 2016 | TV & Film | Finding Dory |
| Aug 4 - Aug 7, 2016 | TV & Film | Suicide Squad |
| Aug 24 - Sept 8, 2016 | Pop Culture | Harambe |
| Sept 23 - Sept 26, 2016 | Pop Culture | Brad Pitt |
| Oct 21, 2016 | Electronics | Google Pixel |
| Nov 24, 2016 | Electronics | Google Pixel |
| Dec 14 - Dec 20, 2016 | Current Events | Aleppo |
| Jan 7 - Jan 10, 2017 | TV & Film | This Is Us |
| Jan 23 - Feb 2, 2017 | TV & Film | This Is Us |
| Feb 8 - Feb 12, 2017 | Sports | Super bowl |
| Feb 22 - Feb 24, 2017 | TV & Film | This Is Us |
| March 7 - March 11, 2017 | Electronics | Nintendo Switch |
| March 21 - Apr 1, 2017 | TV & Film | Beauty and the Beast |
| May 7 - May 16, 2017 | Pop Culture | Fidget Spinner |
| June 17 - July 18, 2017 | Music | Despacito |
| Sept 22, 2017 | TV & Film | It |
| Oct 13, 2017 | Current Events | Harvey Weinstein |
| Nov 3, 2017 | Current Events | Kevin Spacey |
| Jan 12 - Jan 23, 2018 | Current Events | Logan Paul |
| Feb 6 - Feb 11, 2018 | TV & Film | Altered Carbon |
| March 15 - March 29, 2018 | Video Games | Fortnite |
| May 4, 2018 | Video Games | Fortnite |
| July 21, 2018 | Video Games | Fortnite |
| Aug 5 - Aug 22, 2018 | Video Games | Fortnite |
| Jan 17 - Feb 3, 2019 | Music | 7 Rings |
| Feb 21 - Feb 23, 2019 | Current Events | Jussie Smollett |
| March 12 - March 22, 2019 | TV & Film | Captain Marvel |
| March 27, 2019 | Music | Billie Eilish |
| March 30, 2019 | Music | Billie Eilish |
| Aug 24 - Aug 27, 2019 | Music | Billie Eilish |
| Oct 9 - Oct 29, 2019 | TV & Film | Joker |
| Nov 20 - Nov 24, 2019 | TV & Film | The Mandalorian |
| Dec 5 - Dec 14, 2019 | Pop Culture | Baby Yoda |
| Jan 15, 2020 | Current Events | Prince Harry |
| Jan 20, 2020 | Current Events | Prince Harry |
| Feb 13 - Feb 15, 2020 | TV & Film | Jojo Rabbit |
| May 5 - May 14, 2020 | Current Events | Elon Musk |
| June 24, 2020 | Current Events | Bubba Wallace |
It’s interesting to look at the variety of topics that dominate the population’s collective thoughts. There’s a unique mix of popular culture, entertainment, electronics, prominent figures, and public scandals.
Something else worth noting is how country-wide trends became a lot more common in the latter part of the decade—in 2019 for example, 9 keywords trended unanimously. This was more than in the entire first half of the decade.
While the secret to going viral remains a mystery, one thing remains clear—the public certainly has a broad range of interests. So really, it’s anyone’s game.


Brands
How Tech Logos Have Evolved Over Time
From complete overhauls to more subtle tweaks, these tech logos have had quite a journey. Featuring: Google, Apple, and more.


How Tech Logos Have Evolved Over Time
This was originally posted on our Voronoi app. Download the app for free on iOS or Android and discover incredible data-driven charts from a variety of trusted sources.
One would be hard-pressed to find a company that has never changed its logo. Granted, some brands—like Rolex, IBM, and Coca-Cola—tend to just have more minimalistic updates. But other companies undergo an entire identity change, thus necessitating a full overhaul.
In this graphic, we visualized the evolution of prominent tech companies’ logos over time. All of these brands ranked highly in a Q1 2024 YouGov study of America’s most famous tech brands. The logo changes are sourced from 1000logos.net.
How Many Times Has Google Changed Its Logo?
Google and Facebook share a 98% fame rating according to YouGov. But while Facebook’s rise was captured in The Social Network (2010), Google’s history tends to be a little less lionized in popular culture.
For example, Google was initially called “Backrub” because it analyzed “back links” to understand how important a website was. Since its founding, Google has undergone eight logo changes, finally settling on its current one in 2015.
| Company | Number of Logo Changes |
|---|---|
| 8 | |
| HP | 8 |
| Amazon | 6 |
| Microsoft | 6 |
| Samsung | 6 |
| Apple | 5* |
Note: *Includes color changes. Source: 1000Logos.net
Another fun origin story is Microsoft, which started off as Traf-O-Data, a traffic counter reading company that generated reports for traffic engineers. By 1975, the company was renamed. But it wasn’t until 2012 that Microsoft put the iconic Windows logo—still the most popular desktop operating system—alongside its name.
And then there’s Samsung, which started as a grocery trading store in 1938. Its pivot to electronics started in the 1970s with black and white television sets. For 55 years, the company kept some form of stars from its first logo, until 1993, when the iconic encircled blue Samsung logo debuted.
Finally, Apple’s first logo in 1976 featured Isaac Newton reading under a tree—moments before an apple fell on his head. Two years later, the iconic bitten apple logo would be designed at Steve Jobs’ behest, and it would take another two decades for it to go monochrome.

-

 Green1 week ago
Ranked: The Countries With the Most Air Pollution in 2023
-

 Automotive2 weeks ago
Almost Every EV Stock is Down After Q1 2024
-

 AI2 weeks ago
The Stock Performance of U.S. Chipmakers So Far in 2024
-

 Markets2 weeks ago
Charted: Big Four Market Share by S&P 500 Audits
-

 Real Estate2 weeks ago
Ranked: The Most Valuable Housing Markets in America
-

 Money2 weeks ago
Which States Have the Highest Minimum Wage in America?
-

 AI2 weeks ago
Ranked: Semiconductor Companies by Industry Revenue Share
-

 Travel2 weeks ago
Ranked: The World’s Top Flight Routes, by Revenue