Technology
The World’s Tech Giants, Ranked by Brand Value
The World’s Tech Giants, Ranked by Brand Value
The pandemic has businesses everywhere on the ropes, with many firms filing for bankruptcy since lockdowns began. Despite the uncertainty, tech giants and major digital retail brands are still thriving—and some are running circles around those that are less pandemic-proof.
Using data from Kantar and Bloomberg, a recent brand report released by BrandZ shows which tech companies are proving their worth to consumers during COVID-19 chaos. With data covering almost 4 million consumers, BrandZ also reveals that the tech sector leads the world’s 100 most valued brands in terms of financial power and consumer sentiment.
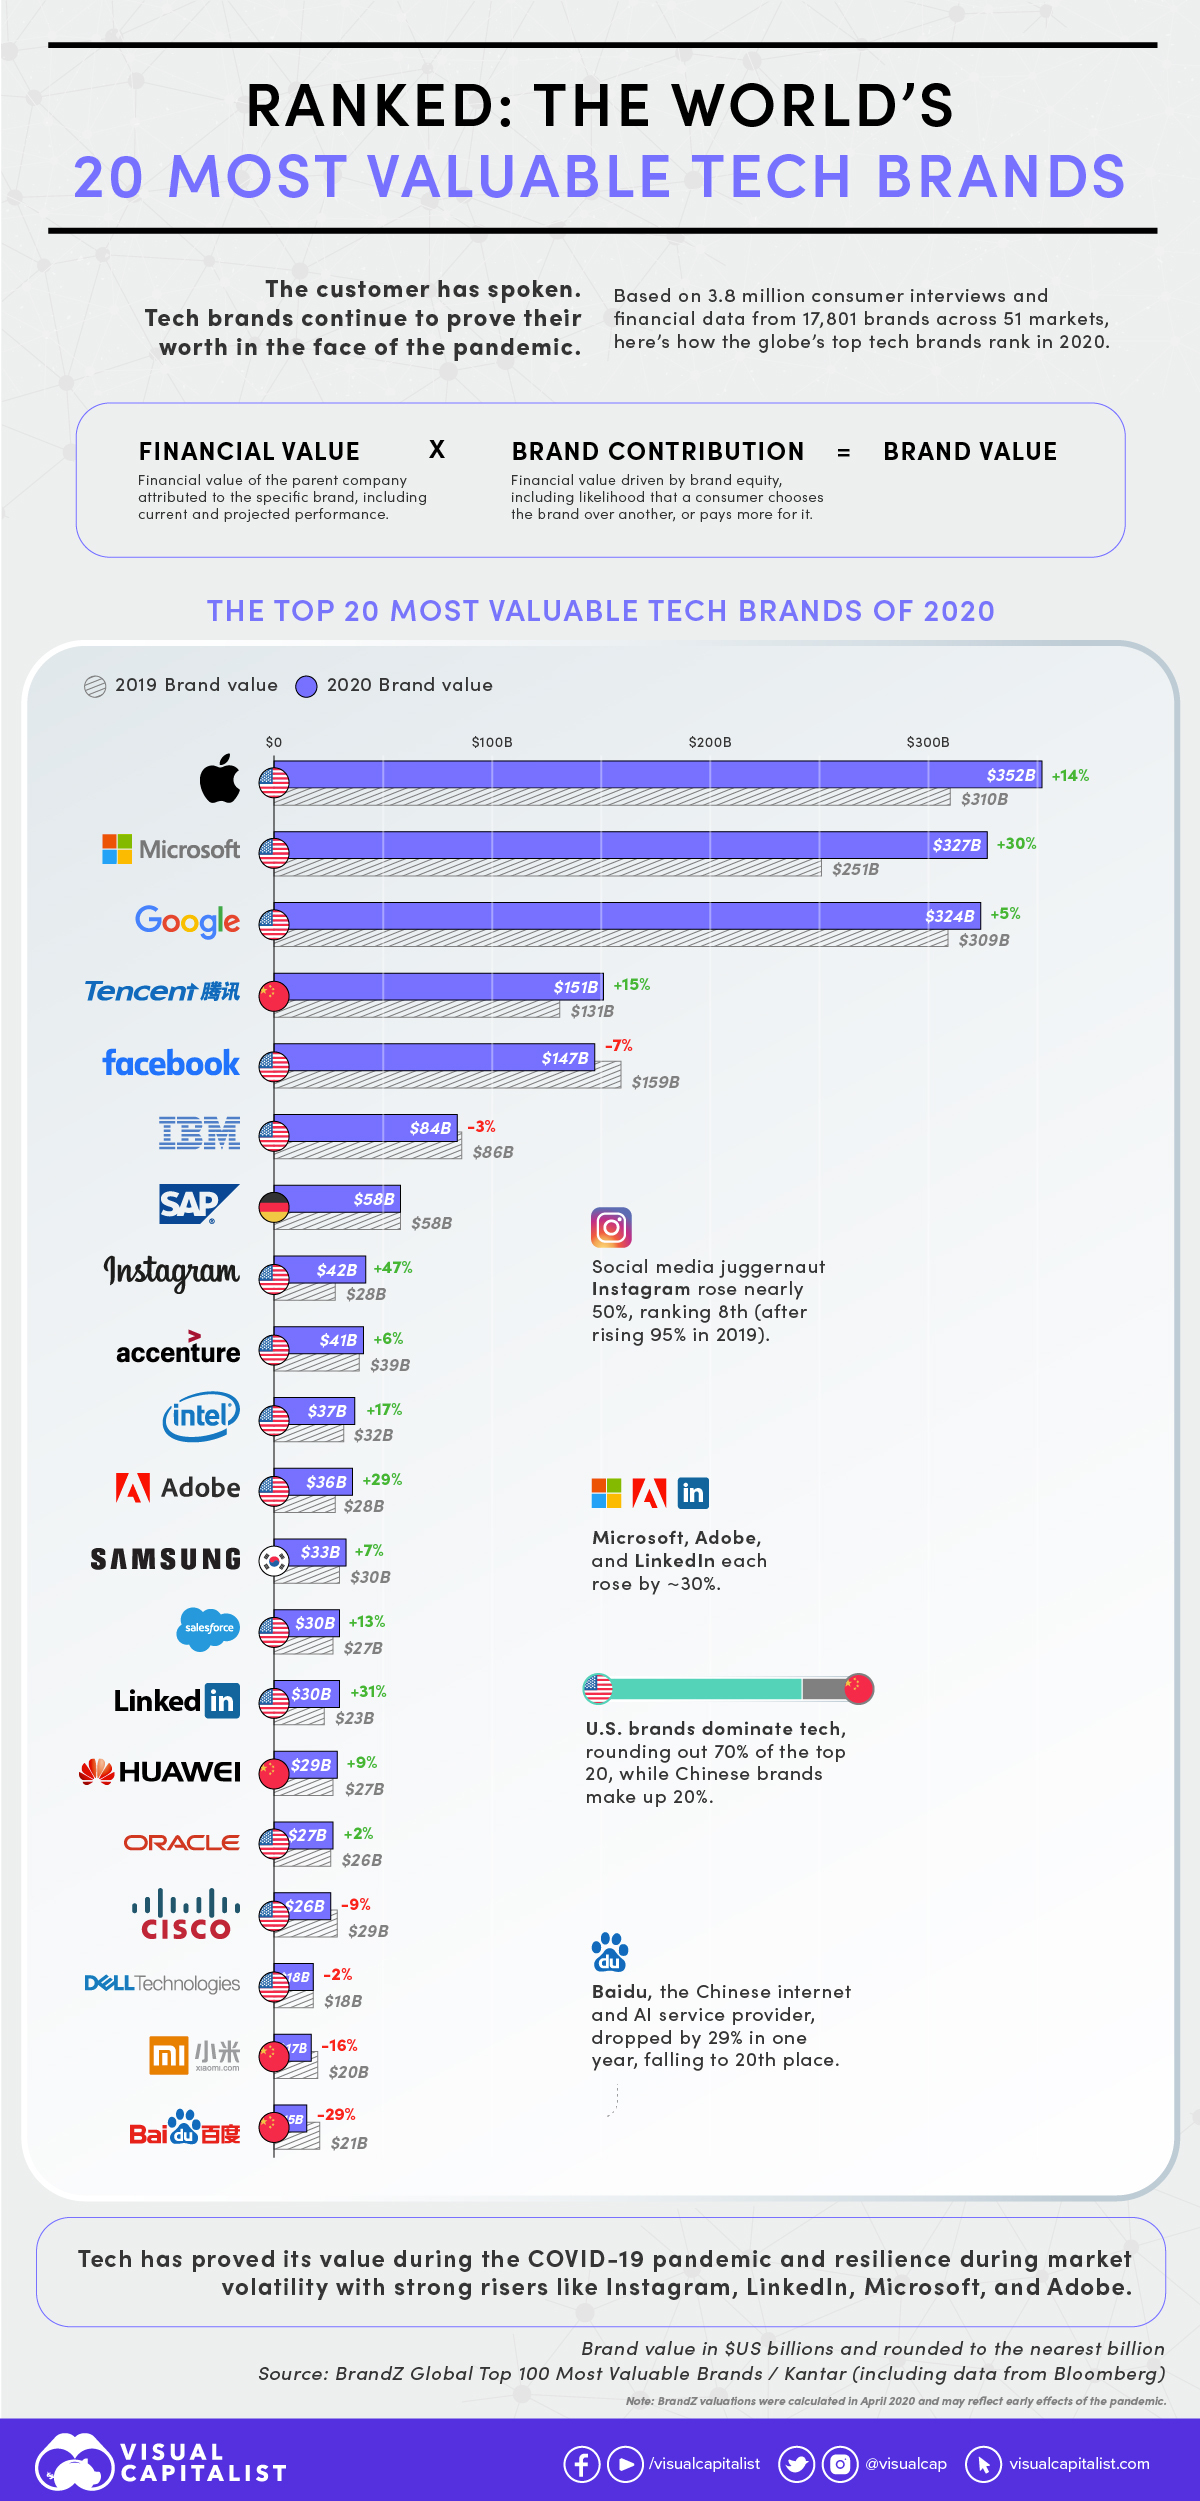
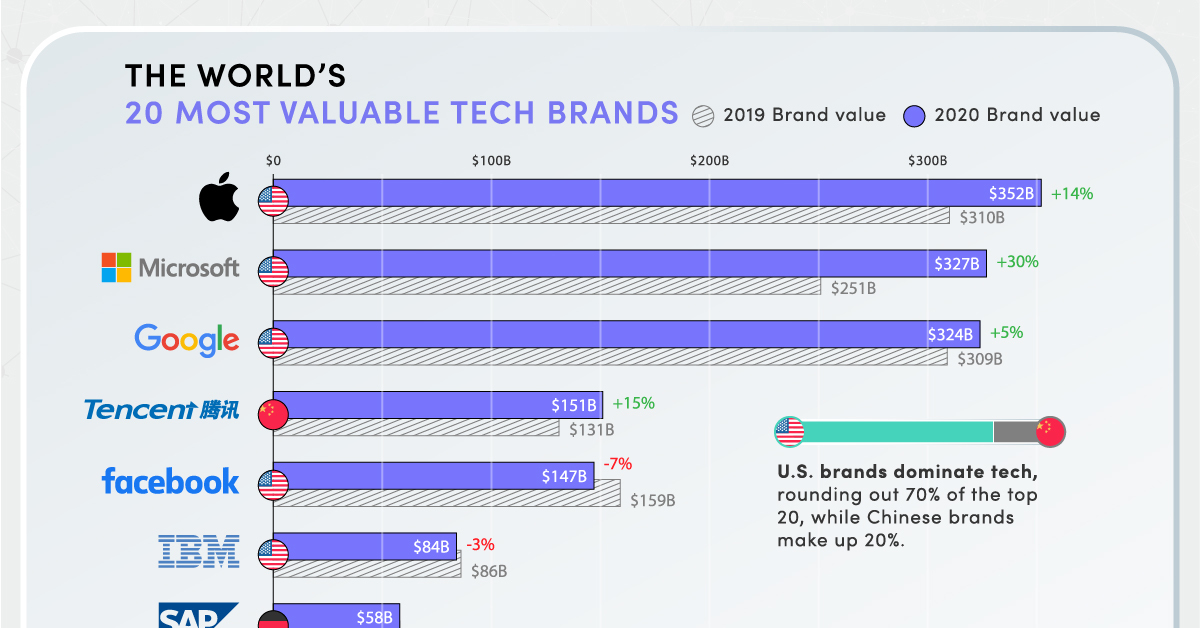
Here’s how the top 20 tech brands from the report stack up:
| Rank | Company | Brand Value (2020) | Change (%) |
|---|---|---|---|
| #1 | 🇺🇸 Apple | $352 billion | +14% |
| #2 | 🇺🇸 Microsoft | $327 billion | +30% |
| #3 | $324 billion | +5% | |
| #4 | 🇨🇳 Tencent | $151 billion | +15% |
| #5 | $147 billion | -7% | |
| #6 | 🇺🇸 IBM | $84 billion | -3% |
| #7 | 🇩🇪 SAP | $58 billion | 0% |
| #8 | $42 billion | +47% | |
| #9 | 🇺🇸 Accenture | $41 billion | +6% |
| #10 | 🇺🇸 Intel | $37 billion | +17% |
| #11 | 🇺🇸 Adobe | $36 billion | +29% |
| #12 | 🇰🇷 Samsung | $33 billion | +7% |
| #13 | 🇺🇸 Salesforce | $30 billion | +13% |
| #14 | $30 billion | +31% | |
| #15 | 🇨🇳 Huawei | $29 billion | +9% |
| #16 | 🇺🇸 Oracle | $27 billion | +2% |
| #17 | 🇺🇸 Cisco | $26 billion | -9% |
| #18 | 🇺🇸 Dell | $18 billion | -2% |
| #19 | 🇨🇳 Xiaomi | $17 billion | -16% |
| #20 | 🇨🇳 Baidu | $15 billion | -29% |
Out of the top five tech brands, Microsoft made the biggest moves with 30% brand value growth. Other big movers in the top 20 were Instagram (owned by Facebook), Adobe, and LinkedIn (owned by Microsoft), rising 47%, 29%, and 31%, respectively.
Broken down by nation, U.S. brands are dominating tech’s heavy hitters, claiming 14 of the world’s top 20 tech brands. Chinese brands round out much of the remaining top 20, including tech entertainment and social media giant Tencent, which rose 15% in brand value since 2019.
Big Tech’s Heavyweights
Tech’s top brands are raking in billions of dollars, capturing consumer mindshare, captivating people, and comforting them during volatile months. Apple, Microsoft, Google, Tencent, and Facebook—tech’s leading contingent—have made those moves look easy during what are rough times for many world brands.
While most tech brands in the upper half of the top 20 saw significant increases in brand value, only Facebook and IBM were in decline from 2019, at -7% and -3% respectively. The biggest loss in tech’s top 20 came from China’s Baidu, which fell by -29% in 2020.
Waning consumer trust, thanks in part to the perceived misuse of personal data, is a gap that tech’s popularity alone won’t fill forever. (Following the Cambridge Analytica scandal, nearly 25% of Facebook account holders reported being “extremely” or “very” concerned about their personal data.)
Pandemic-Proof Applications
Coming in at eighth place, Facebook-owned Instagram gained 47% in brand value—a huge percentage, but less than the whopping 95% growth it had in 2019.
On the whole, digital apps have been faring well during the pandemic, especially those built for entertainment, shopping, social connection, and delivery.
These brands had anticipated, even invented, the online-offline dynamics of modern life that became indispensable for survival during the lockdown homebound weeks of avoiding the contagion.
— BrandZ 2020 Global Top 100 Report
Top Brands, by Category
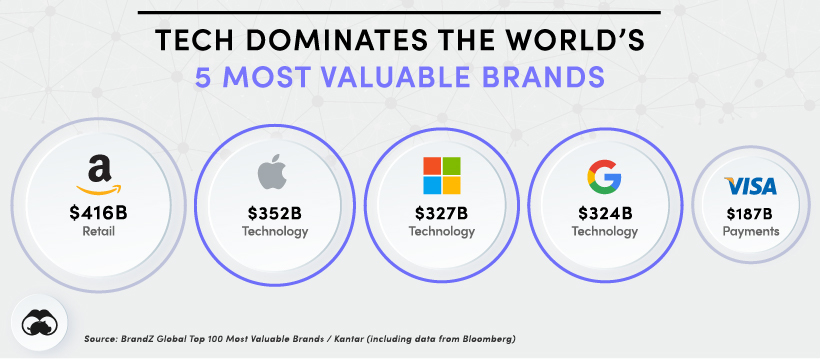
While the brand value growth rates of tech giants aren’t entirely immune to the effects of COVID-19, the likes of Apple, Microsoft, and Google are growing steadily, surpassed only by e-commerce leader Amazon.
With data collected into April 2020, BrandZ’s report on the world’s top 100 brands reflects multiple shifting needs and consumer concerns at a categorical scale.
While consumer affinity for e-commerce and social media brands has increased, fast food and beer brands took a hit, despite reports of increased alcohol consumption and food delivery during lockdown. It would seem then, that consumers have been valuing their tools and means of consumption.
Of the report’s 14 brand categories, only six increased in value, mostly by less than 5%. Of the top risers, six were tech brands and six were mainly e-commerce.
Other upwardly mobile brands were those in the apparel and personal care categories. Much like retail, those categories had an increasing reliance on technology to deliver their products.
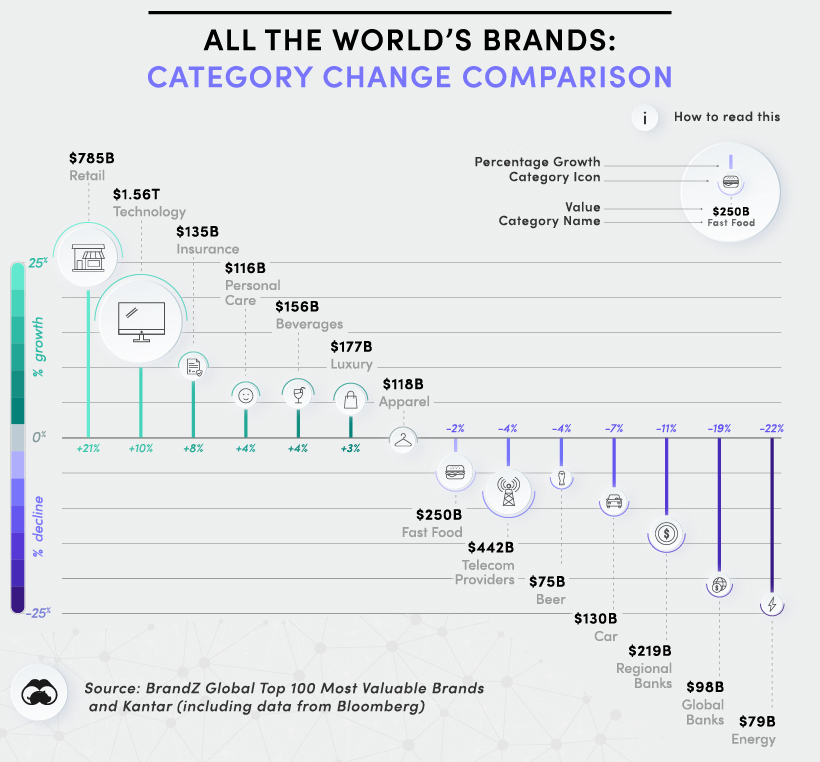
The above chart shows overall categorical changes for 2020 led by retail, tech, and insurance. In the opposite corner, energy, and bank brands took the biggest hits.
Rolling with the Punches
The economic impacts of COVID-19 are undeniable. Even still, BrandZ’s top 100 brands marked a steady increase of 6% in value in 2020, compared to 7% the previous year.
This pandemic has offered up era-defining change, with tech and e-commerce seizing the day. But in a climate where nothing can be taken for granted, brands large and small are still taking their knocks.
For now, the brands that are embraced by consumers will be those that can apply a salve to the blows that 2020 keeps delivering.


Technology
All of the Grants Given by the U.S. CHIPS Act
Intel, TSMC, and more have received billions in subsidies from the U.S. CHIPS Act in 2024.


All of the Grants Given by the U.S. CHIPS Act
This was originally posted on our Voronoi app. Download the app for free on iOS or Android and discover incredible data-driven charts from a variety of trusted sources.
This visualization shows which companies are receiving grants from the U.S. CHIPS Act, as of April 25, 2024. The CHIPS Act is a federal statute signed into law by President Joe Biden that authorizes $280 billion in new funding to boost domestic research and manufacturing of semiconductors.
The grant amounts visualized in this graphic are intended to accelerate the production of semiconductor fabrication plants (fabs) across the United States.
Data and Company Highlights
The figures we used to create this graphic were collected from a variety of public news sources. The Semiconductor Industry Association (SIA) also maintains a tracker for CHIPS Act recipients, though at the time of writing it does not have the latest details for Micron.
| Company | Federal Grant Amount | Anticipated Investment From Company |
|---|---|---|
| 🇺🇸 Intel | $8,500,000,000 | $100,000,000,000 |
| 🇹🇼 TSMC | $6,600,000,000 | $65,000,000,000 |
| 🇰🇷 Samsung | $6,400,000,000 | $45,000,000,000 |
| 🇺🇸 Micron | $6,100,000,000 | $50,000,000,000 |
| 🇺🇸 GlobalFoundries | $1,500,000,000 | $12,000,000,000 |
| 🇺🇸 Microchip | $162,000,000 | N/A |
| 🇬🇧 BAE Systems | $35,000,000 | N/A |
BAE Systems was not included in the graphic due to size limitations
Intel’s Massive Plans
Intel is receiving the largest share of the pie, with $8.5 billion in grants (plus an additional $11 billion in government loans). This grant accounts for 22% of the CHIPS Act’s total subsidies for chip production.
From Intel’s side, the company is expected to invest $100 billion to construct new fabs in Arizona and Ohio, while modernizing and/or expanding existing fabs in Oregon and New Mexico. Intel could also claim another $25 billion in credits through the U.S. Treasury Department’s Investment Tax Credit.
TSMC Expands its U.S. Presence
TSMC, the world’s largest semiconductor foundry company, is receiving a hefty $6.6 billion to construct a new chip plant with three fabs in Arizona. The Taiwanese chipmaker is expected to invest $65 billion into the project.
The plant’s first fab will be up and running in the first half of 2025, leveraging 4 nm (nanometer) technology. According to TrendForce, the other fabs will produce chips on more advanced 3 nm and 2 nm processes.
The Latest Grant Goes to Micron
Micron, the only U.S.-based manufacturer of memory chips, is set to receive $6.1 billion in grants to support its plans of investing $50 billion through 2030. This investment will be used to construct new fabs in Idaho and New York.

-

 Education1 week ago
How Hard Is It to Get Into an Ivy League School?
-

 Technology2 weeks ago
Ranked: Semiconductor Companies by Industry Revenue Share
-

 Markets2 weeks ago
Ranked: The World’s Top Flight Routes, by Revenue
-

 Demographics2 weeks ago
Population Projections: The World’s 6 Largest Countries in 2075
-

 Markets2 weeks ago
The Top 10 States by Real GDP Growth in 2023
-

 Demographics2 weeks ago
The Smallest Gender Wage Gaps in OECD Countries
-

 Economy2 weeks ago
Where U.S. Inflation Hit the Hardest in March 2024
-

 Green2 weeks ago
Top Countries By Forest Growth Since 2001