COVID-19
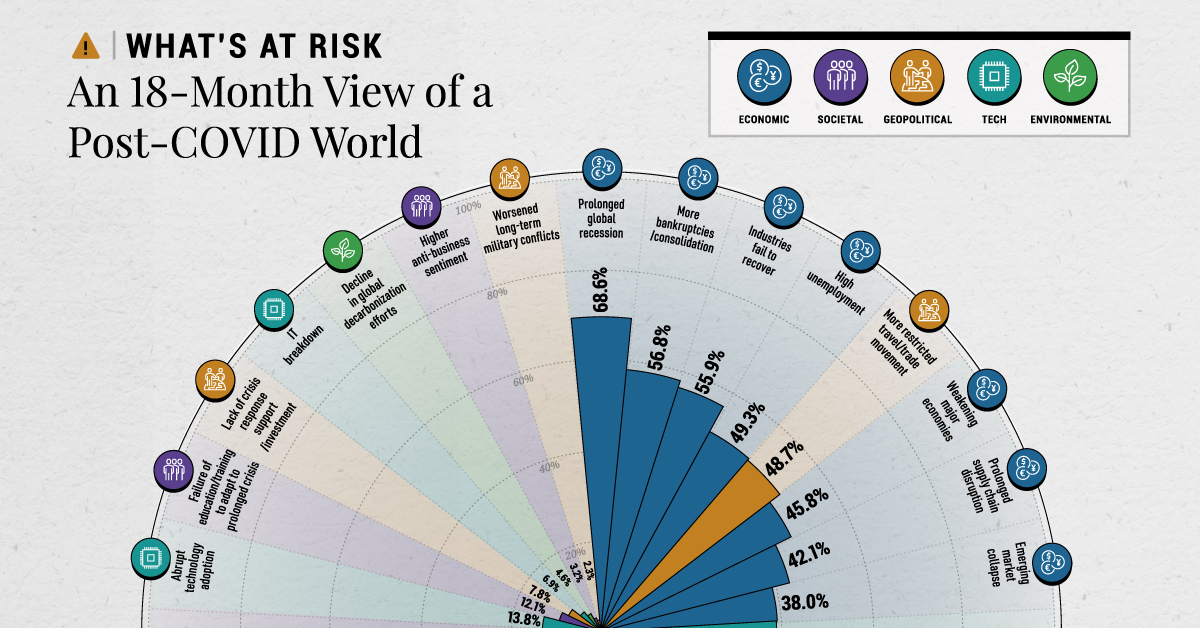
What’s At Risk: An 18-Month View of a Post-COVID World


What’s At Risk: An 18-Month View of a Post-COVID World
As the world continues to grapple with the effects of COVID-19, no part of society seems to be left unscathed. Fears are surmounting around the economy’s health, and dramatic changes in life as we know it are also underway.
In today’s graphic, we use data from a World Economic Forum survey of 347 risk analysts on how they rank the likelihood of major risks we face in the aftermath of the pandemic.
What are the most likely risks for the world over the next year and a half?
The Most Likely Risks
In the report, a “risk” is defined as an uncertain event or condition with the potential for significant negative impacts on various countries and industries. The 31 risks have been grouped into five major categories:
- Economic: 10 risks
- Societal: 9 risks
- Geopolitical: 6 risks
- Technological: 4 risks
- Environmental: 2 risks
Among these, risk analysts rank economic factors high on their list, but the far-reaching impacts of the remaining factors are not to be overlooked either. Let’s dive deeper into each category.
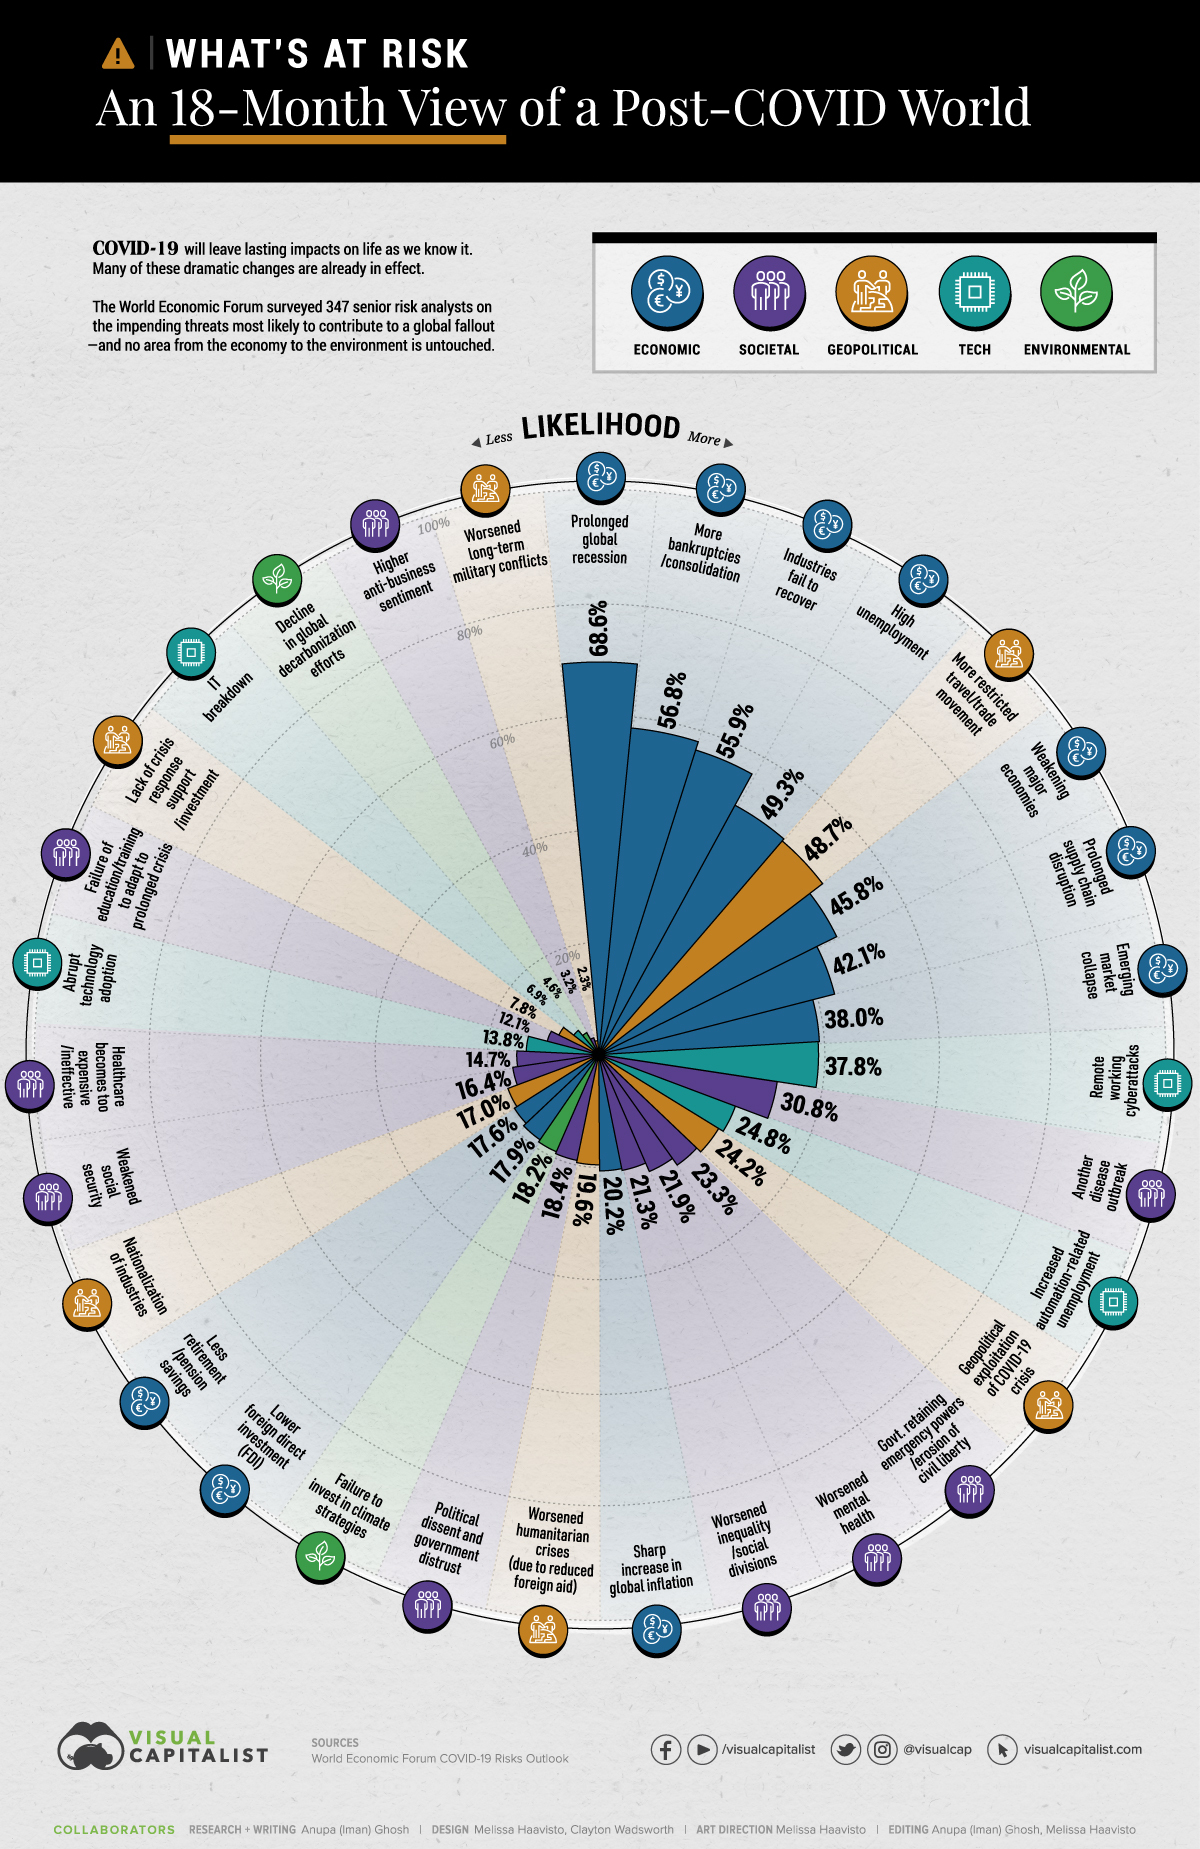
Economic Shifts
The survey reveals that economic fallout poses the most likely threat in the near future, dominating four of the top five risks overall. With job losses felt the world over, a prolonged recession has 68.6% of experts feeling worried.
| Rank | Economic Risk | % |
|---|---|---|
| #1 | Prolonged recession of the global economy | 68.6% |
| #2 | Surge in bankruptcies (big firms and SMEs) and a wave of industry consolidation | 56.8% |
| #3 | Failure of industries or sectors in certain countries to properly recover | 55.9% |
| #4 | High levels of structural unemployment (especially youth) | 49.3% |
| #6 | Weakening of fiscal positions in major economies | 45.8% |
| #7 | Protracted disruption of global supply chains | 42.1% |
| #8 | Economic collapse of an emerging market or developing economy | 38.0% |
| #16 | Sharp increase in inflation globally | 20.2% |
| #20 | Massive capital outflows and slowdown in foreign direct investment | 17.9% |
| #21 | Sharp underfunding of retirement due to pension fund devaluation | 17.6% |
The pandemic has accelerated structural change in the global economic system, but this does not come without consequences. As central banks offer trillions of dollars worth in response packages and policies, this may inadvertently burden countries with even more debt.
Another concern is that COVID-19 is now hitting developing economies hard, critically stalling the progress they’ve been making on the world stage. For this reason, 38% of the survey respondents anticipate this may cause these markets to collapse.
Social Anxieties
High on everyone’s mind is also the possibility of another COVID-19 outbreak, despite global efforts to flatten the curve of infections.
| Rank | Societal Risk | % |
|---|---|---|
| #10 | Another global outbreak of COVID-19 or different infectious disease | 30.8% |
| #13 | Governmental retention of emergency powers and/or erosion of civil liberties | 23.3% |
| #14 | Exacerbation of mental health issues | 21.9% |
| #15 | Fresh surge in inequality and social divisions | 21.3% |
| #18 | Anger with political leaders and distrust of government | 18.4% |
| #23 | Weakened capacity or collapse of national social security systems | 16.4% |
| #24 | Healthcare becomes prohibitively expensive or ineffective | 14.7% |
| #26 | Failure of education and training systems to adapt to a protracted crisis | 12.1% |
| #30 | Spike in anti-business sentiment | 3.2% |
With many countries moving to reopen, a few more intertwined risks come into play. 21.3% of analysts believe social inequality will be worsened, while 16.4% predict that national social safety nets could be under pressure.
Geopolitical Troubles
Further restrictions on trade and travel movements are an alarm bell for 48.7% of risk analysts—these relationships were already fraught to begin with.
| Rank | Geopolitical Risk | % |
|---|---|---|
| #5 | Tighter restrictions on the cross-border movement of people and goods | 48.7% |
| #12 | Exploitation of COVID-19 crisis for geopolitical advantage | 24.2% |
| #17 | Humanitarian crises exacerbated by reduction in foreign aid | 19.6% |
| #22 | Nationalization of strategic industries in certain countries | 17.0% |
| #27 | Failure to support and invest in multilateral organizations for global crisis response | 7.8% |
| #31 | Exacerbation of long-standing military conflicts | 2.3% |
In fact, global trade could drop sharply by 13-32% while foreign direct investment (FDI) is projected to decline by an additional 30-40% in 2020.
The drop in foreign aid could also put even more stress on existing humanitarian issues, such as food insecurity in conflict-ridden parts of the world.
Technology Overload
Technology has enabled a significant number of people to cope with the impact and spread of COVID-19. An increased dependence on digital tools has enabled wide-scale remote working for business—but for many more without this option, this accelerated adoption has hindered rather than helped.
| Rank | Technological Risk | % |
|---|---|---|
| #9 | Cyberattacks and data fraud due to sustained shift in working patterns | 37.8% |
| #11 | Additional unemployment from accelerated workforce automation | 24.8% |
| #25 | Abrupt adoption and regulation of technologies (e.g. e-voting, telemedicine, surveillance) | 13.8% |
| #28 | Breakdown of IT infrastructure and networks | 6.9% |
Over a third of the surveyed risk analysts see the emergence of cyberattacks due to remote working as a rising concern. Another near 25% see the threat of rapid automation as a drawback, especially for those in occupations that do not allow for remote work.
Environmental Setbacks
Last but certainly not least, COVID-19 is also potentially halting progress on climate action. While there were initial drops in pollution and emissions due to lockdown, some estimate there could be a severe bounce-back effect on the environment as economies reboot.
| Rank | Environmental Risk | % |
|---|---|---|
| #19 | Higher risk of failing to invest enough in climate resilience and adaptation | 18.2% |
| #29 | Sharp erosion of global decarbonization efforts | 4.6% |
As a result of the more immediate concerns, sustainability may take a back seat. But with environmental issues considered the biggest global risk this year, these delayed investments and missed climate targets could put the Earth further behind on action.
Which Risks Are of the Greatest Concern?
The risk analysts were also asked which of these risks they considered to be of the greatest concern for the world. The responses to this metric varied, with societal and geopolitical factors taking on more importance.
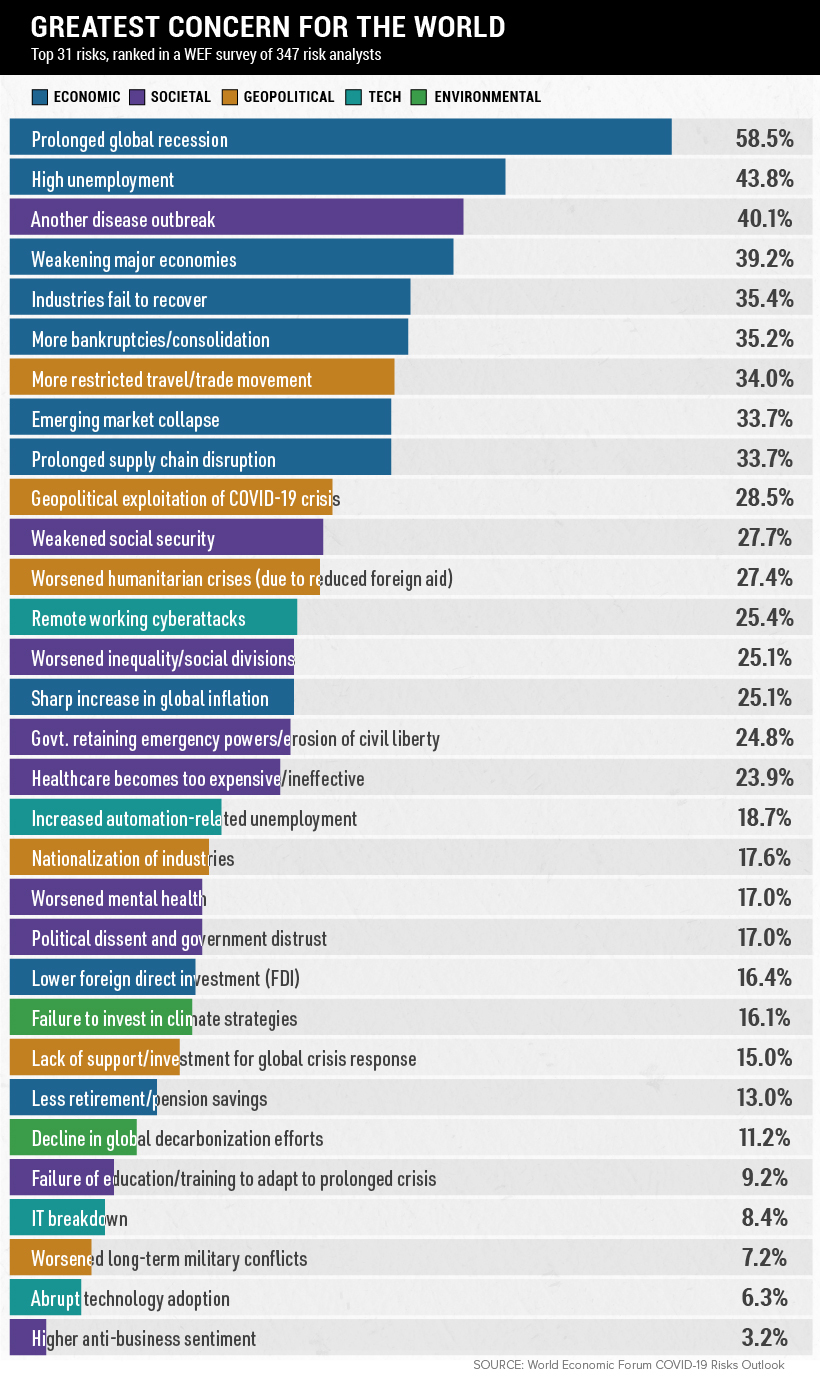
In particular, concerns around another disease outbreak weighed highly at 40.1%, and tighter cross-border movement came in at 34%.
On the bright side, many experts are also looking to this recovery trajectory as an opportunity for a “great reset” of our global systems.
This is a virus that doesn’t respect borders: it crosses borders. And as long as it is in full strength in any part of the world, it’s affecting everybody else. So it requires global cooperation to deal with it.
——Gita Gopinath, IMF Chief Economist


Healthcare
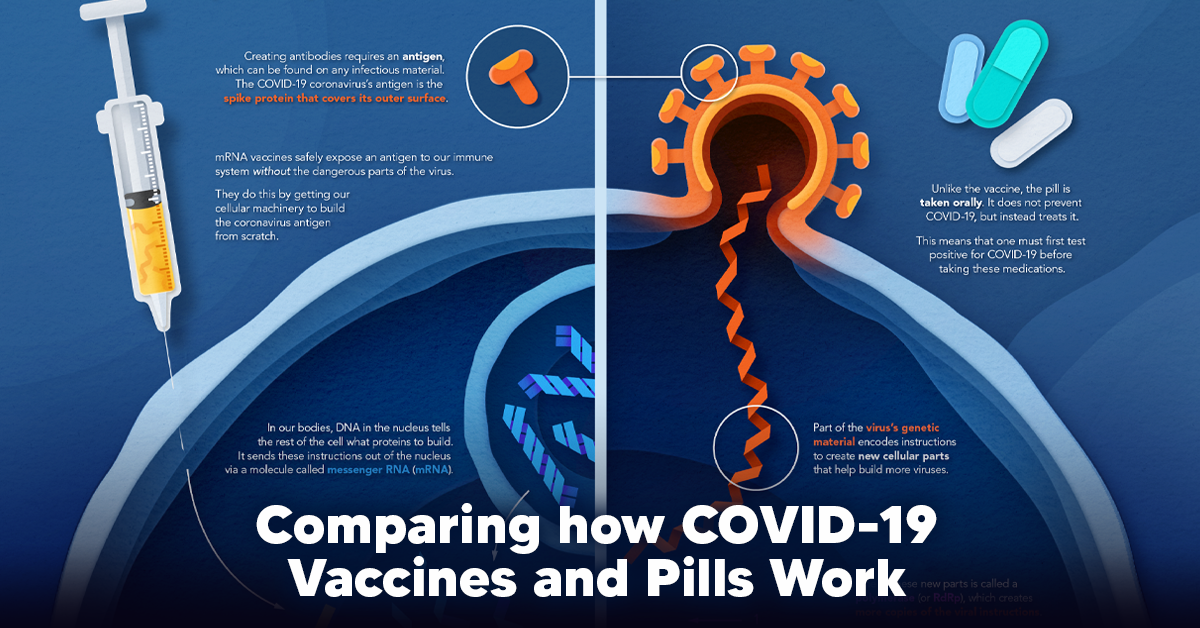
Visualizing How COVID-19 Antiviral Pills and Vaccines Work at the Cellular Level
Despite tackling the same disease, vaccines and antiviral pills work differently to combat COVID-19. We visualize how they work in the body.
Current Strategies to Tackle COVID-19
Since the pandemic started in 2020, a number of therapies have been developed to combat COVID-19.
The leading options for preventing infection include social distancing, mask-wearing, and vaccination. They are still recommended during the upsurge of the coronavirus’s latest mutation, the Omicron variant.
But in December 2021, The United States Food and Drug Administration (USDA) granted Emergency Use Authorization to two experimental pills for the treatment of new COVID-19 cases.
These medications, one made by Pfizer and the other by Merck & Co., hope to contribute to the fight against the coronavirus and its variants. Alongside vaccinations, they may help to curb extreme cases of COVID-19 by reducing the need for hospitalization.
Despite tackling the same disease, vaccines and pills work differently:
| Vaccines | Pills |
|---|---|
| Taken by injection | Taken by mouth |
| Used for prevention | Used for treatment only |
| Create an enhanced immune system by stimulating antibody production | Disrupt the assembly of new viral particles |
How a Vaccine Helps Prevent COVID-19
The main purpose of a vaccine is to prewarn the body of a potential COVID-19 infection by creating antibodies that target and destroy the coronavirus.
In order to do this, the immune system needs an antigen.
It’s difficult to do this risk-free since all antigens exist directly on a virus. Luckily, vaccines safely expose antigens to our immune systems without the dangerous parts of the virus.
In the case of COVID-19, the coronavirus’s antigen is the spike protein that covers its outer surface. Vaccines inject antigen-building instructions* and use our own cellular machinery to build the coronavirus antigen from scratch.
When exposed to the spike protein, the immune system begins to assemble antigen-specific antibodies. These antibodies wait for the opportunity to attack the real spike protein when a coronavirus enters the body. Since antibodies decrease over time, booster immunizations help to maintain a strong line of defense.
*While different vaccine technologies exist, they all do a similar thing: introduce an antigen and build a stronger immune system.
How COVID Antiviral Pills Work
Antiviral pills, unlike vaccines, are not a preventative strategy. Instead, they treat an infected individual experiencing symptoms from the virus.
Two drugs are now entering the market. Merck & Co.’s Lagevrio®, composed of one molecule, and Pfizer’s Paxlovid®, composed of two.
These medications disrupt specific processes in the viral assembly line to choke the virus’s ability to replicate.
The Mechanism of Molnupiravir
RNA-dependent RNA Polymerase (RdRp) is a cellular component that works similar to a photocopying machine for the virus’s genetic instructions. An infected host cell is forced to produce RdRp, which starts generating more copies of the virus’s RNA.
Molnupiravir, developed by Merck & Co., is a polymerase inhibitor. It inserts itself into the viral instructions that RdRp is copying, jumbling the contents. The RdRp then produces junk.
The Mechanism of Nirmatrelvir + Ritonavir
A replicating virus makes proteins necessary for its survival in a large, clumped mass called a polyprotein. A cellular component called a protease cuts a virus’s polyprotein into smaller, workable pieces.
Pfizer’s antiviral medication is a protease inhibitor made of two pills:
- The first pill, nirmatrelvir, stops protease from cutting viral products into smaller pieces.
- The second pill, ritonavir, protects nirmatrelvir from destruction by the body and allows it to keep working.
With a faulty polymerase or a large, unusable polyprotein, antiviral medications make it difficult for the coronavirus to replicate. If treated early enough, they can lessen the virus’s impact on the body.
The Future of COVID Antiviral Pills and Medications
Antiviral medications seem to have a bright future ahead of them.
COVID-19 antivirals are based on early research done on coronaviruses from the 2002-04 SARS-CoV and the 2012 MERS-CoV outbreaks. Current breakthroughs in this technology may pave the way for better pharmaceuticals in the future.
One half of Pfizer’s medication, ritonavir, currently treats many other viruses including HIV/AIDS.
Gilead Science is currently developing oral derivatives of remdesivir, another polymerase inhibitor currently only offered to inpatients in the United States.
More coronavirus antivirals are currently in the pipeline, offering a glimpse of control on the looming presence of COVID-19.
Author’s Note: The medical information in this article is an information resource only, and is not to be used or relied on for any diagnostic or treatment purposes. Please talk to your doctor before undergoing any treatment for COVID-19. If you become sick and believe you may have symptoms of COVID-19, please follow the CDC guidelines.

-

 Education1 week ago
How Hard Is It to Get Into an Ivy League School?
-

 Technology2 weeks ago
Ranked: Semiconductor Companies by Industry Revenue Share
-

 Markets2 weeks ago
Ranked: The World’s Top Flight Routes, by Revenue
-

 Demographics2 weeks ago
Population Projections: The World’s 6 Largest Countries in 2075
-

 Markets2 weeks ago
The Top 10 States by Real GDP Growth in 2023
-

 Demographics2 weeks ago
The Smallest Gender Wage Gaps in OECD Countries
-

 Economy2 weeks ago
Where U.S. Inflation Hit the Hardest in March 2024
-

 Green2 weeks ago
Top Countries By Forest Growth Since 2001