Advertising
The COVID-19 Impact on Advertising Spend
The COVID-19 Impact on Advertising Spend
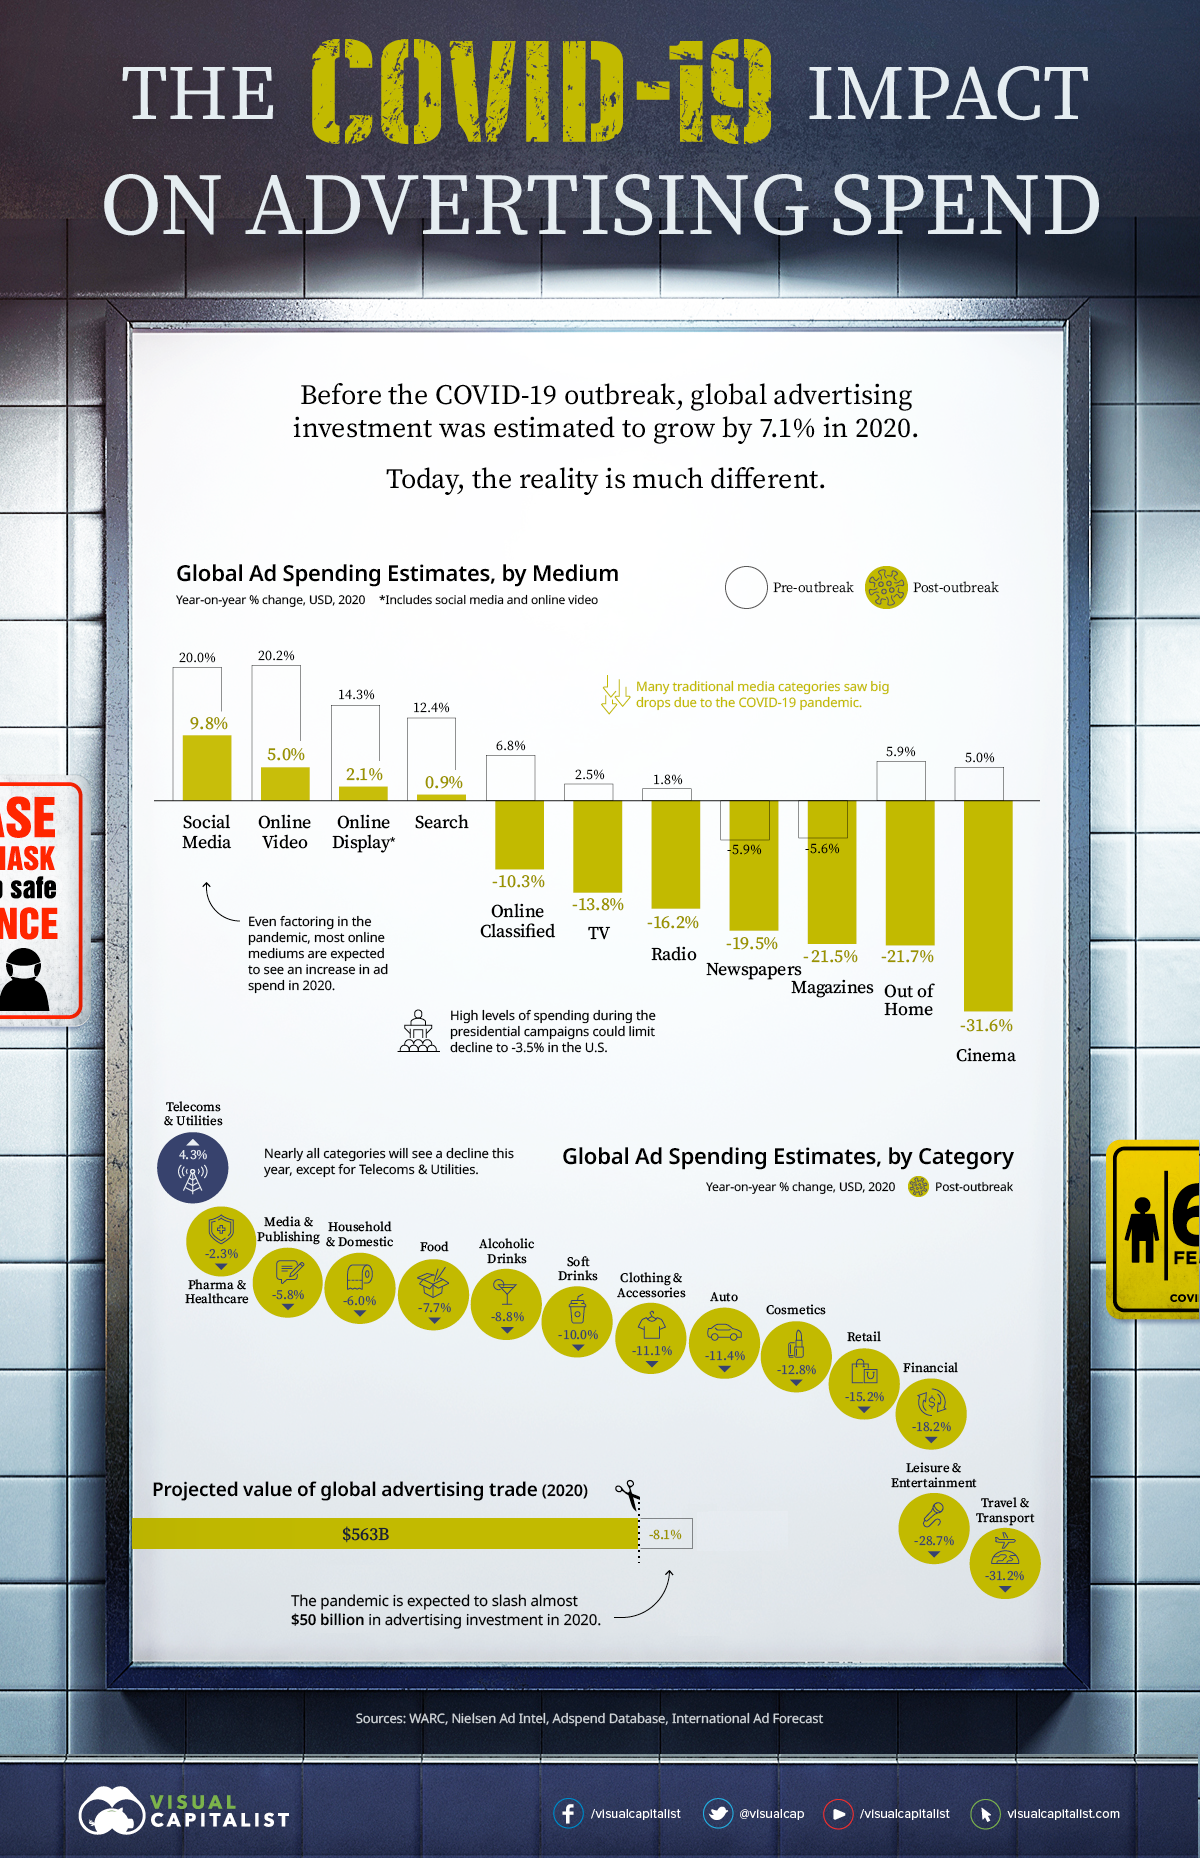
Before the COVID-19 outbreak, global advertising investment was estimated to grow at a 7.1% clip in 2020.
Now, it is estimated to see a brutal contraction of 8.1%—equating to almost $50 billion—as a result of changing consumer behavior. The total loss becomes a bleak $96.4 billion when taking pre-pandemic growth forecasts into account.
Today’s graphic uses data from the World Advertising Research Center (WARC) to visualize the estimated decline in advertising spend by media format and industry.
As advertisers adapt to rising in-home media consumption, the tug-of-war for ad dollars between online and traditional media seems to have a decisive winner.
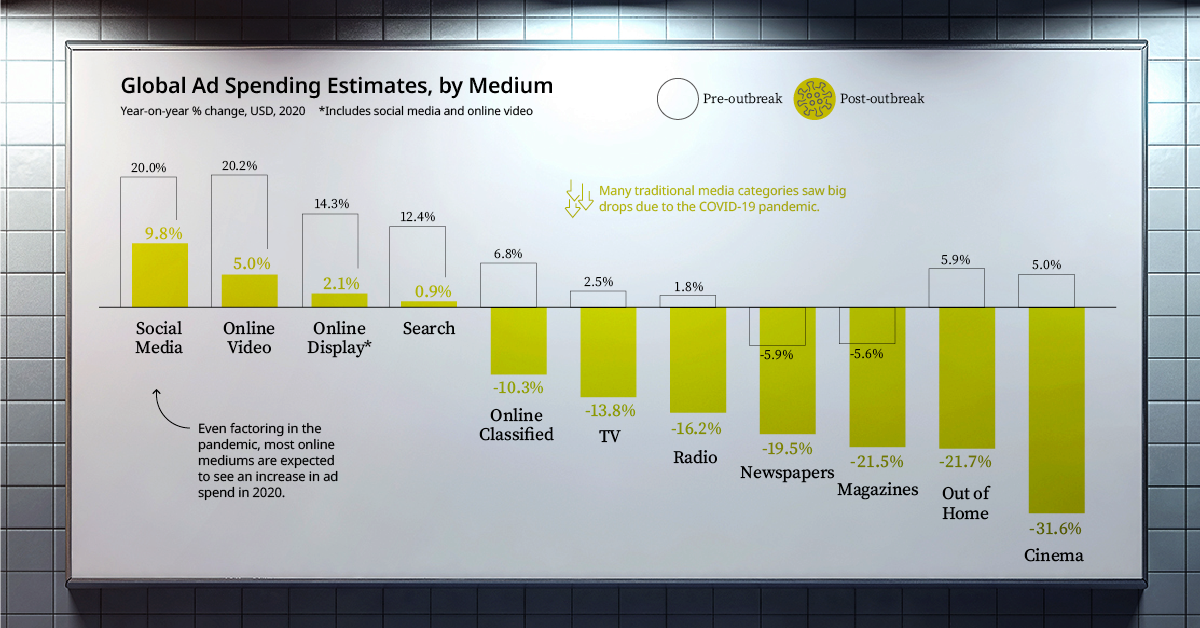
The Death of Traditional Media
After decades of experts predicting the death of traditional media formats, the COVID-19 pandemic could be the last nail in the coffin.
In fact, spend across every type of traditional media format will see a decline in 2020, while most online media formats are expected to see an increase in spending.
Mid-term, this era will be associated with an accelerant of latent and incremental trends towards more digital consumption, commerce, and thus advertising”
—Dr. Daniel Knapp, Interactive Advertising Bureau Europe
With consumers spending significantly more time at home, brands are allocating more dollars to certain media formats to reflect that. However, when it comes to traditional in-home formats such as TV, consumers are opting for streaming services instead. In fact, they are streaming twice as much online video on services such as Netflix compared to last year.
Spending Estimates, by Category
Almost every industry will see reduced spending. The one category that will buck the trend is “Telecoms & Utilities”, which will experience a 4.3% increase in ad spend throughout the year.
Interestingly, stay-at-home restrictions have increased consumers’ reliance on these services for staying connected with loved ones and working from home.
Moreover, the pandemic has proved to be a turning point for the telecommunications industry, as the importance of faster internet speeds are emphasized and the potential of 5G is realized.
The Road to Recovery?
When inflation and exchange rates are taken into account, the decline in advertising spend is expected to be worse than that experienced during the global financial crisis.
Although 2021 shows signs of recovery, WARC suggests this is reflective of how steep the decline in 2020 will be.

Data shows that global advertising spending growth did not fully recover for eight years following the previous recession, so a swift recovery may be highly unlikely, and returning to pre-pandemic growth rates may not be possible for a number of years.
The Changing Advertising Landscape
As advertisers come to terms with their new reality, they are faced with the uncertainty of changing consumer behavior and the potential for a second wave of the pandemic, tightening quarantine restrictions once more.
Could COVID-19 be accelerating the inevitable shift to digital, or is the pain for traditional media only temporary?


Revenue
Charting Revenue: How The New York Times Makes Money
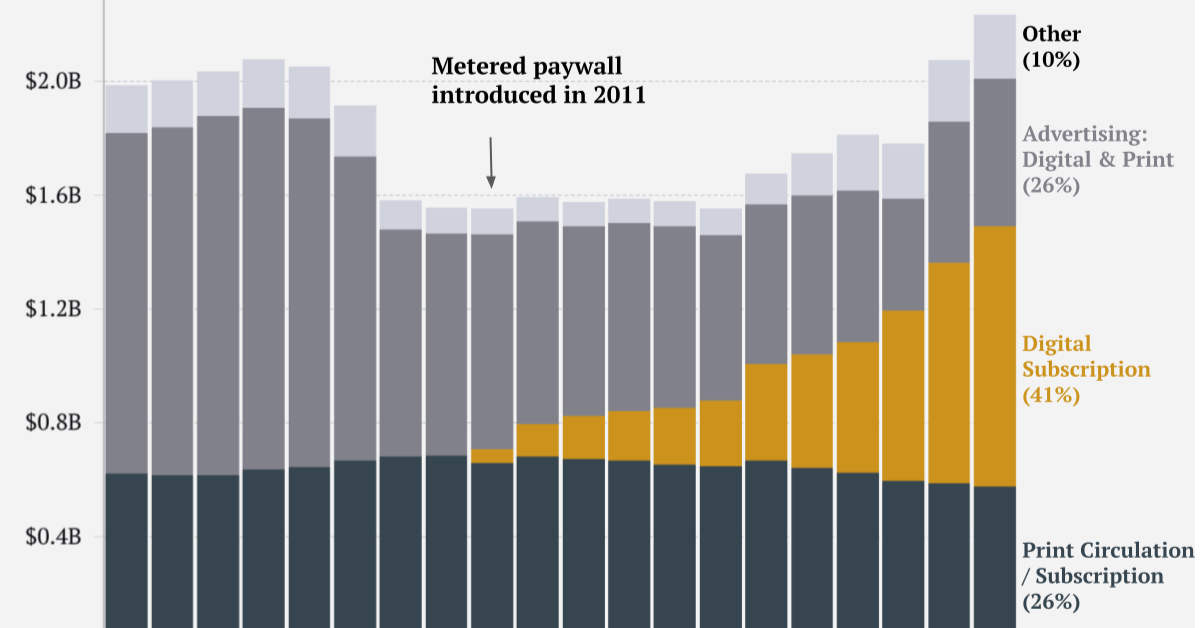
This graphic tracks the New York Times’ revenue streams over the past two decades, identifying its transition from advertising to subscription-reliant.
 Creator Program
When it comes to quality and accessible content, whether it be entertainment or news, consumers are often willing to pay for it.
Similar to the the precedent set by the music industry, many news outlets have also been figuring out how to transition into a paid digital monetization model. Over the past decade or so, The New York Times (NY Times)—one of the world’s most iconic and widely read news organizations—has been transforming its revenue model to fit this trend.
This chart from creator Trendline uses annual reports from the The New York Times Company to visualize how this seemingly simple transition helped the organization adapt to the digital era.
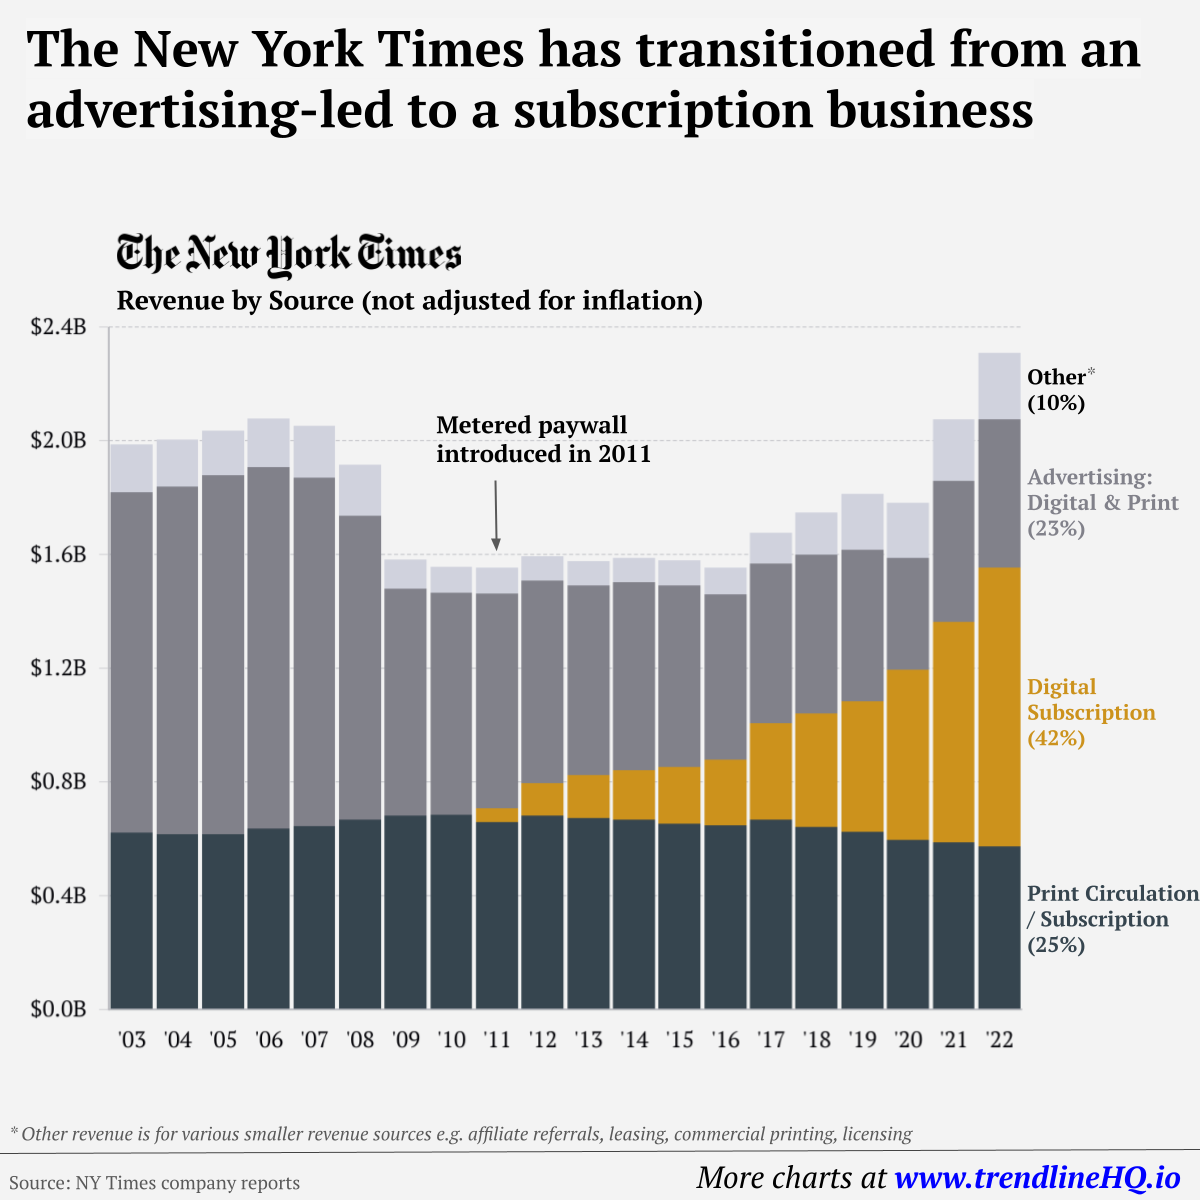
The New York Times’ Revenue Transition
The NY Times has always been one of the world’s most-widely circulated papers. Before the launch of its digital subscription model, it earned half its revenue from print and online advertisements.
The rest of its income came in through circulation and other avenues including licensing, referrals, commercial printing, events, and so on. But after annual revenues dropped by more than $500 million from 2006 to 2010, something had to change.
| NY Revenue By Year | Print Circulation | Digital Subscription | Advertising | Other | Total |
|---|---|---|---|---|---|
| 2003 | $623M | $1,196M | $168M | $1,987M | |
| 2004 | $616M | $1,222M | $165M | $2,003M | |
| 2005 | $616M | $1,262M | $157M | $2,035M | |
| 2006 | $637M | $1,269M | $172M | $2,078M | |
| 2007 | $646M | $1,223M | $183M | $2,052M | |
| 2008 | $668M | $1,068M | $181M | $1,917M | |
| 2009 | $683M | $797M | $101M | $1,581M | |
| 2010 | $684M | $780M | $93M | $1,557M | |
| 2011 | $659M | $47M | $756M | $93M | $1,555M |
| 2012 | $681M | $114M | $712M | $88M | $1,595M |
| 2013 | $673M | $151M | $667M | $86M | $1,577M |
| 2014 | $668M | $172M | $662M | $86M | $1,588M |
| 2015 | $653M | $199M | $639M | $89M | $1,580M |
| 2016 | $647M | $232M | $581M | $94M | $1,554M |
| 2017 | $668M | $340M | $559M | $109M | $1,676M |
| 2018 | $642M | $400M | $558M | $148M | $1,748M |
| 2019 | $624M | $460M | $531M | $198M | $1,813M |
| 2020 | $597M | $598M | $392M | $196M | $1,783M |
| 2021 | $588M | $774M | $498M | $215M | $2,075M |
| 2022 | $574M | $979M | $523M | $233M | $2,308M |
In 2011, the NY Times launched its new digital subscription model and put some of its online articles behind a paywall. It bet that consumers would be willing to pay for quality content.
And while it faced a rocky start, with revenue through print circulation and advertising slowly dwindling and some consumers frustrated that once-available content was now paywalled, its income through digital subscriptions began to climb.
After digital subscription revenues first launched in 2011, they totaled to $47 million of revenue in their first year. By 2022 they had climbed to $979 million and accounted for 42% of total revenue.
Why Are Readers Paying for News?
More than half of U.S. adults subscribe to the news in some format. That (perhaps surprisingly) includes around four out of 10 adults under the age of 35.
One of the main reasons cited for this was the consistency of publications in covering a variety of news topics.
And given the NY Times’ popularity, it’s no surprise that it recently ranked as the most popular news subscription.

-

 Education1 week ago
How Hard Is It to Get Into an Ivy League School?
-

 Technology2 weeks ago
Ranked: Semiconductor Companies by Industry Revenue Share
-

 Markets2 weeks ago
Ranked: The World’s Top Flight Routes, by Revenue
-

 Demographics2 weeks ago
Population Projections: The World’s 6 Largest Countries in 2075
-

 Markets2 weeks ago
The Top 10 States by Real GDP Growth in 2023
-

 Demographics2 weeks ago
The Smallest Gender Wage Gaps in OECD Countries
-

 Economy2 weeks ago
Where U.S. Inflation Hit the Hardest in March 2024
-

 Environment2 weeks ago
Top Countries By Forest Growth Since 2001