Revenue
Charting Revenue: How The New York Times Makes Money
Article/Editing:
When it comes to quality and accessible content, whether it be entertainment or news, consumers are often willing to pay for it.
Similar to the the precedent set by the music industry, many news outlets have also been figuring out how to transition into a paid digital monetization model. Over the past decade or so, The New York Times (NY Times)—one of the world’s most iconic and widely read news organizations—has been transforming its revenue model to fit this trend.
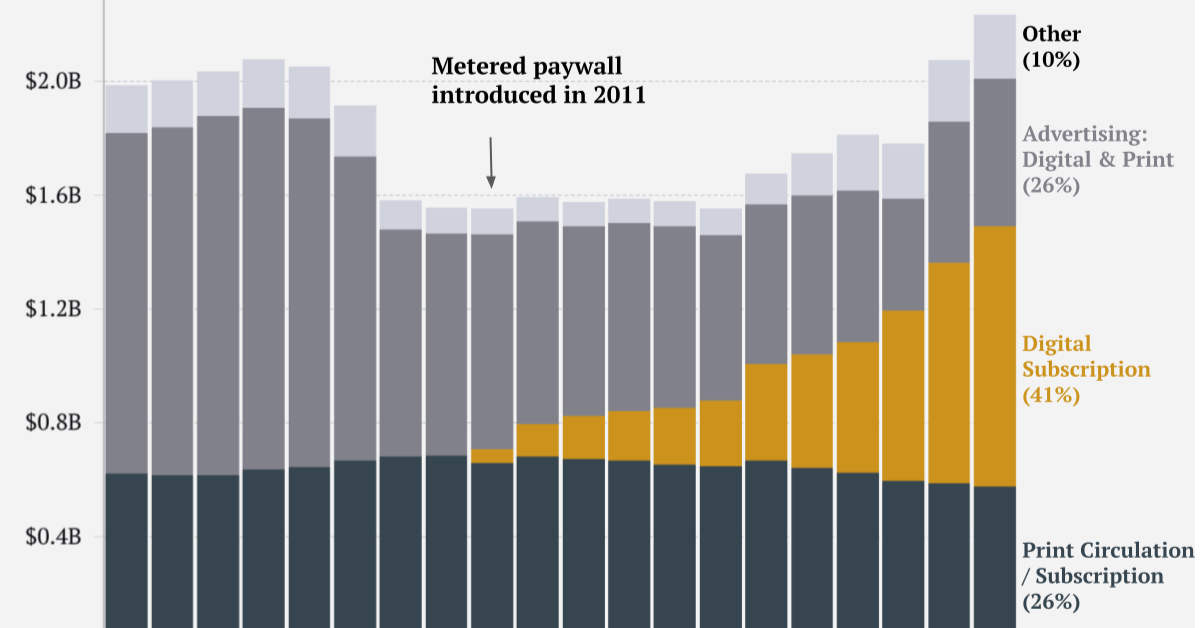
This chart from creator Trendline uses annual reports from the The New York Times Company to visualize how this seemingly simple transition helped the organization adapt to the digital era.
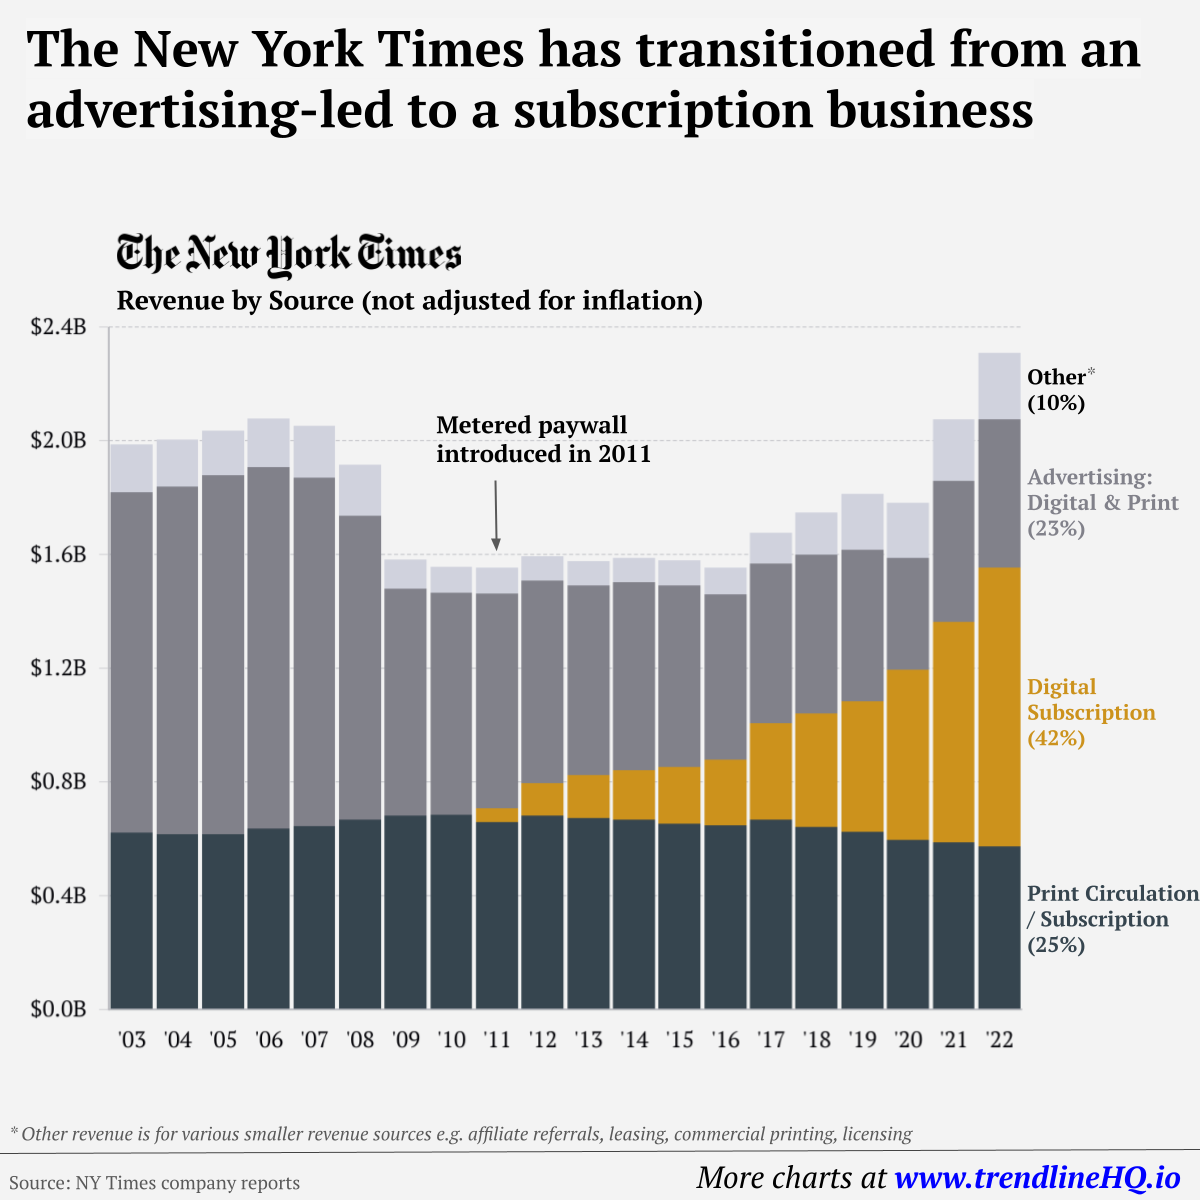
The New York Times’ Revenue Transition
The NY Times has always been one of the world’s most-widely circulated papers. Before the launch of its digital subscription model, it earned half its revenue from print and online advertisements.
The rest of its income came in through circulation and other avenues including licensing, referrals, commercial printing, events, and so on. But after annual revenues dropped by more than $500 million from 2006 to 2010, something had to change.
| NY Revenue By Year | Print Circulation | Digital Subscription | Advertising | Other | Total |
|---|---|---|---|---|---|
| 2003 | $623M | $1,196M | $168M | $1,987M | |
| 2004 | $616M | $1,222M | $165M | $2,003M | |
| 2005 | $616M | $1,262M | $157M | $2,035M | |
| 2006 | $637M | $1,269M | $172M | $2,078M | |
| 2007 | $646M | $1,223M | $183M | $2,052M | |
| 2008 | $668M | $1,068M | $181M | $1,917M | |
| 2009 | $683M | $797M | $101M | $1,581M | |
| 2010 | $684M | $780M | $93M | $1,557M | |
| 2011 | $659M | $47M | $756M | $93M | $1,555M |
| 2012 | $681M | $114M | $712M | $88M | $1,595M |
| 2013 | $673M | $151M | $667M | $86M | $1,577M |
| 2014 | $668M | $172M | $662M | $86M | $1,588M |
| 2015 | $653M | $199M | $639M | $89M | $1,580M |
| 2016 | $647M | $232M | $581M | $94M | $1,554M |
| 2017 | $668M | $340M | $559M | $109M | $1,676M |
| 2018 | $642M | $400M | $558M | $148M | $1,748M |
| 2019 | $624M | $460M | $531M | $198M | $1,813M |
| 2020 | $597M | $598M | $392M | $196M | $1,783M |
| 2021 | $588M | $774M | $498M | $215M | $2,075M |
| 2022 | $574M | $979M | $523M | $233M | $2,308M |
In 2011, the NY Times launched its new digital subscription model and put some of its online articles behind a paywall. It bet that consumers would be willing to pay for quality content.
And while it faced a rocky start, with revenue through print circulation and advertising slowly dwindling and some consumers frustrated that once-available content was now paywalled, its income through digital subscriptions began to climb.
After digital subscription revenues first launched in 2011, they totaled to $47 million of revenue in their first year. By 2022 they had climbed to $979 million and accounted for 42% of total revenue.
Why Are Readers Paying for News?
More than half of U.S. adults subscribe to the news in some format. That (perhaps surprisingly) includes around four out of 10 adults under the age of 35.
One of the main reasons cited for this was the consistency of publications in covering a variety of news topics.
And given the NY Times’ popularity, it’s no surprise that it recently ranked as the most popular news subscription.

This article was published as a part of Visual Capitalist's Creator Program, which features data-driven visuals from some of our favorite Creators around the world.


Revenue
Ranked: The Biggest Retailers in the U.S. by Revenue
From Best Buy to Costco: we list out the biggest retailers in the U.S., and how much they earned from their stores in 2022.
The Biggest Retailers in the U.S. by Revenue
America is the home of retail. The sector is worth more than $7 trillion, nearly one-fourth of the entire global retail industry, and well ahead of its closest rivals, China and India.
But who are its biggest players?
We visualize the biggest American retailers using data from the National Retail Federation (NRF) and Business of Apps.
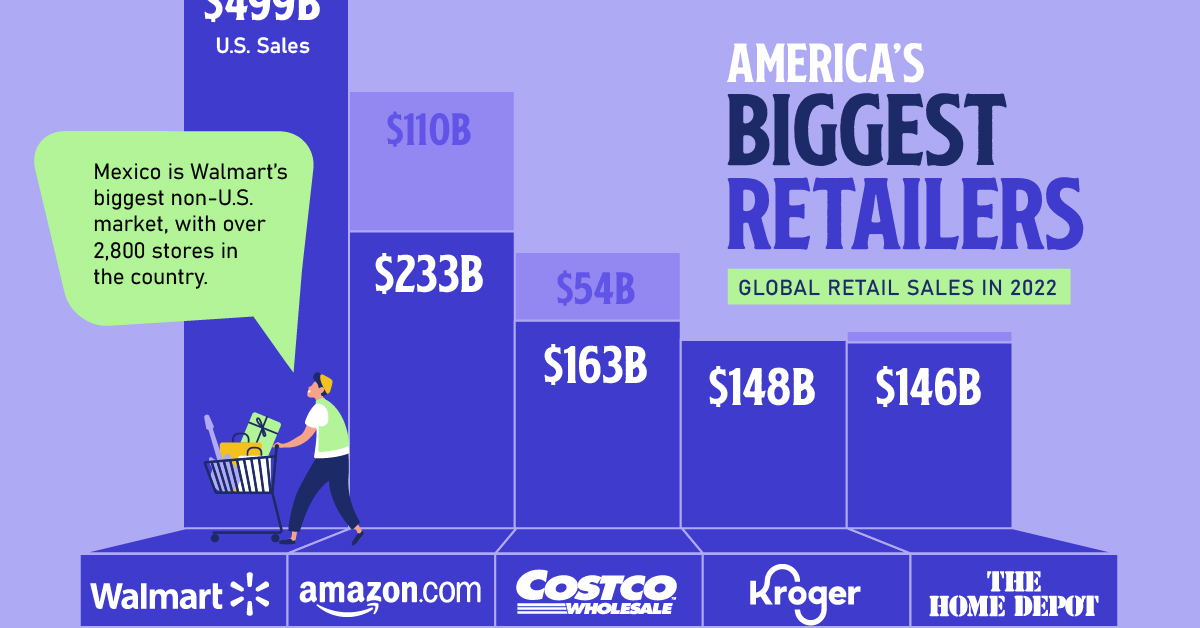
Ranked: America’s Biggest Retailers
Not only is Walmart the biggest retail store in America, with close to $500 billion in sales, it’s also the biggest retailer in the world, with the company’s global sales crossing $600 billion.
Established in 1962 in Rogers, Arkansas, the publicly-traded, family-owned business is also the largest single corporate employer in the world, with more than 2 million employees—beating out several state companies like the Indian Railways and the NHS.
Here’s a list of America’s biggest retailers, ranked by their U.S. sales.
| Rank | Company | U.S. Sales (USD Billions) | RoW Sales (USD Billions) | Total Sales (USD Billions) |
|---|---|---|---|---|
| 1 | Walmart | $499 | $102 | $601 |
| 2 | Amazon.com | $233 | $110 | $343 |
| 3 | Costco Wholesale | $163 | $54 | $218 |
| 4 | Kroger | $148 | $0 | $148 |
| 5 | The Home Depot | $146 | $9 | $155 |
| 6 | Target | $108 | $0 | $108 |
| 7 | CVS Health Corporation | $107 | $0 | $107 |
| 8 | Walgreens Boots Alliance | $103 | $13 | $116 |
| 9 | Lowe's Companies | $89 | $5 | $94 |
| 10 | Albertsons Companies | $76 | $0 | $76 |
| 11 | Apple* | $71 | $10 | $80 |
| 12 | Royal Ahold Delhaize | $57 | $35 | $92 |
| 13 | Publix Super Markets | $55 | $0 | $55 |
| 14 | Best Buy | $43 | $3 | $46 |
| 15 | Aldi | $40 | $84 | $124 |
*Apple Stores/iTunes revenue.
Amazon’s market cap might dwarf other retailers but its domestic retail sales are less than half of Walmart’s at $233 billion, putting the company solidly in second place.
Coming in third, Costco brought in $163 billion in revenue in 2022 from their 591 stores in the country. Their hot dog and soda combo is a famous example of how what started as a loss leader strategy, is now a brand icon.
How Do American Retailers Do Internationally?
Kroger, which also owns various supermarket chains like Fred Meyer, Food 4 Less, and Fry’s, is in fourth place, with $148 billion in sales. It’s the biggest American retailer with no foreign presence whatsoever.
The below table shows the revenue share between domestic and foreign sources for America’s biggest retailers.
| Rank | Company | U.S. Sales (%) | RoW Sales (%) |
|---|---|---|---|
| 1 | Walmart | 83% | 17% |
| 2 | Amazon.com | 68% | 32% |
| 3 | Costco Wholesale | 75% | 25% |
| 4 | Kroger | 100% | 0% |
| 5 | The Home Depot | 94% | 6% |
| 6 | Target | 100% | 0% |
| 7 | CVS Health Corporation | 100% | 0% |
| 8 | Walgreens Boots Alliance | 89% | 11% |
| 9 | Lowe's Companies | 95% | 5% |
| 10 | Albertsons Companies | 100% | 0% |
| 11 | Apple | 88% | 12% |
| 12 | Royal Ahold Delhaize | 62% | 38% |
| 13 | Publix Super Markets | 100% | 0% |
| 14 | Best Buy | 93% | 7% |
| 15 | Aldi | 32% | 68% |
Note: Retailers ranked by their U.S. sales.
Ranked 12th and 15th respectively, Royal Ahold Delhaize (Netherlands) and Aldi (Germany) are the only two companies on the list that are not headquartered in America.
Despite this, Royal Ahold Delhaize earns a greater share of their revenue from their U.S. sales (62%) versus the rest of the world (38%) and operates more than 2,000 stores across 23 states in the country.
Apple: Tech Giant and Retailer
Tech giant Apple stands out amidst the many big-box-stores and supermarkets on this list.
At 11th, Apple Retail made $71 billion in 2022, and nearly one-in-four iPhones in the U.S. that year were sold at an Apple store.
In fact, Apple Retail was started in 2001 after the company’s “store-within-a-store” strategy failed—a strategy that Microsoft and Google still employ.
And every time a new Apple product launches, the lineups outside their 272 stores do quite a bit of marketing for the company.
Where Does This Data Come From?
Source: The National Retail Federation (NRF) and Business of Apps.
Note: Company revenues from non-retailing operating segments are removed unless otherwise noted; system-wide sales are provided when the operation is a franchise. Rankings eliminate fuel sales at locations designated as having a gasoline/fueling station as its primary business. Please see NRF’s methodology for further details.

-

 Brands6 days ago
How Tech Logos Have Evolved Over Time
-

 Demographics2 weeks ago
The Smallest Gender Wage Gaps in OECD Countries
-

 Economy2 weeks ago
Where U.S. Inflation Hit the Hardest in March 2024
-

 Green2 weeks ago
Top Countries By Forest Growth Since 2001
-

 United States2 weeks ago
Ranked: The Largest U.S. Corporations by Number of Employees
-

 Maps2 weeks ago
The Largest Earthquakes in the New York Area (1970-2024)
-

 Green2 weeks ago
Ranked: The Countries With the Most Air Pollution in 2023
-

 Green2 weeks ago
Ranking the Top 15 Countries by Carbon Tax Revenue