
What are Gen Z's favorite brands? Here are the top 5 brands for apparel, footwear, and handbags, according to U.S. teens in September 2023.
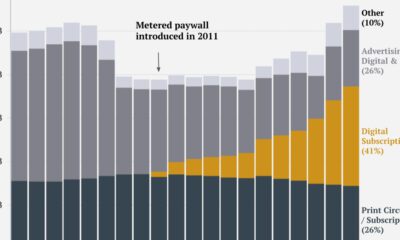

This graphic tracks the New York Times’ revenue streams over the past two decades, identifying its transition from advertising to subscription-reliant.
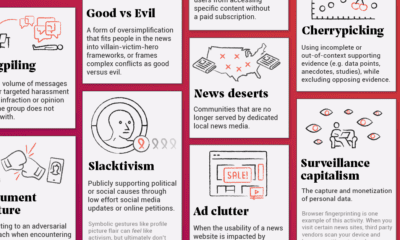

In this infographic, we catalog 33 problems with the social and mass media ecosystem.
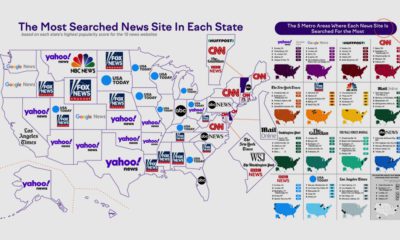

American states have some key differences for their favorite news sites. Here's how they rank by monthly visitors and state popularity.
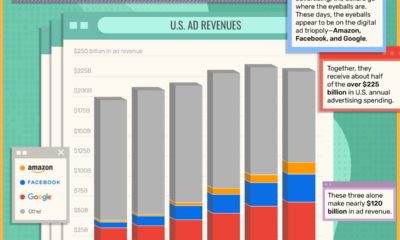

The U.S. ad space is dominated by the ad triopoly of Amazon, Facebook, and Google. Together, they make up over half of the $225 billion in...
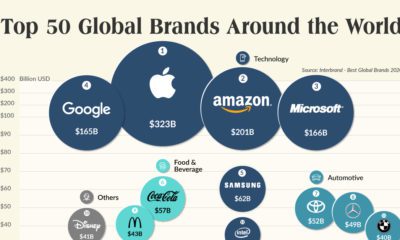

This graphic showcases 2020's top 50 most valuable global brands and explores how COVID-19 has triggered a brand shift with huge implications.


This graphic compares consumers’ most loved brands before the COVID-19 pandemic to their most loved brands during the pandemic.
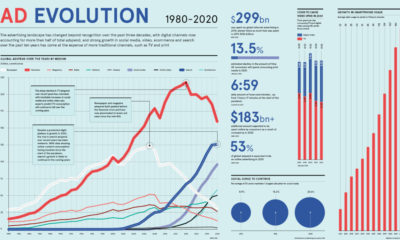

How has global advertising spending shifted over recent decades? We look at the data to see how both the industry and media have evolved.
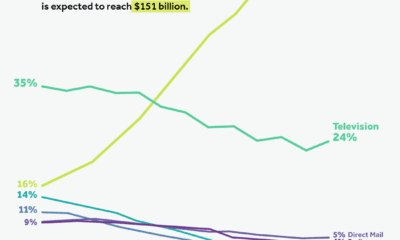

Internet advertising has shown steady growth in the last decade. By 2024, it’s projected to capture 60% of total ad spend in the United States.
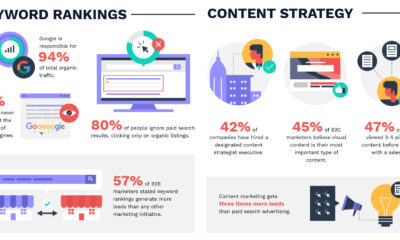

This massive infographic uses 100+ marketing stats to highlight the tactics that are working in modern-day digital universe.