Datastream
The Majority of Advertising Dollars are Now Being Spent Online
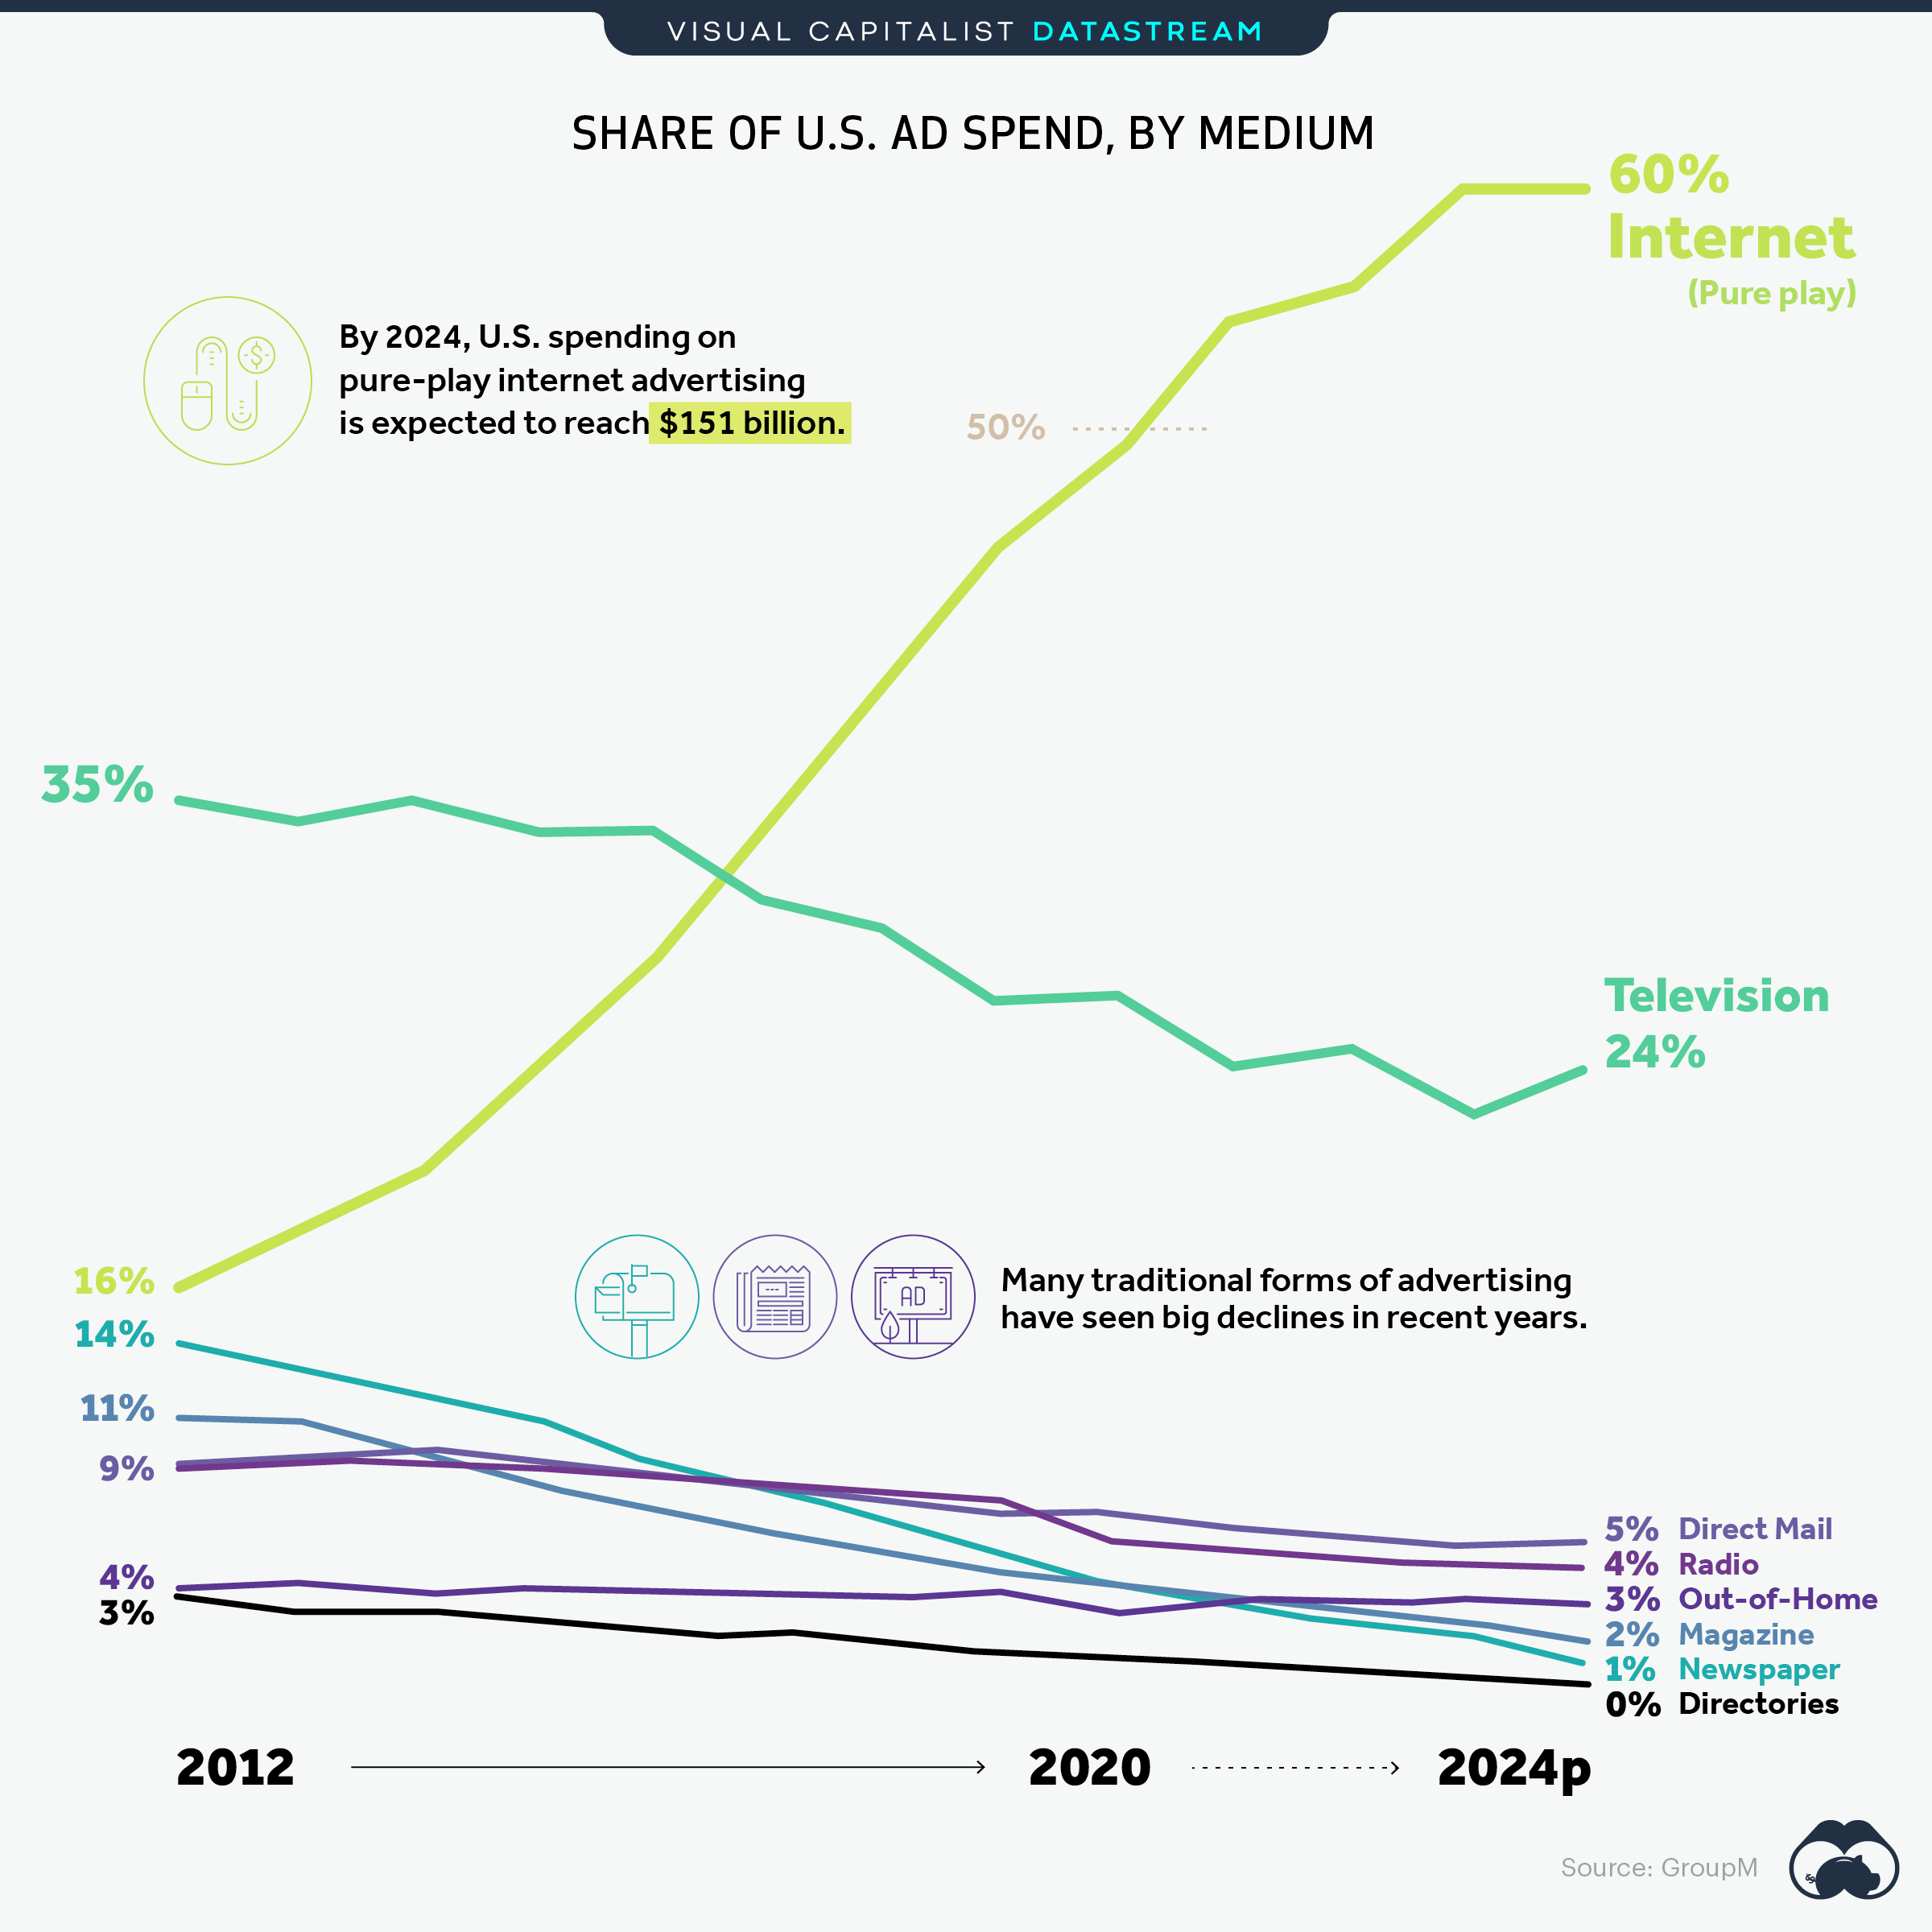
The Briefing
- In the last decade, digital ad spend in the U.S. has surged
- It’s estimated by GroupM that 49% of ad spend will have taken place online this year, but in 2021 that portion will surge to 54%
- U.S. spending on pure-play internet advertising is expected to reach a whopping $151 billion by the year 2024
- In contrast, more traditional forms of advertising have shown significant drops in popularity
The Growth of Internet Ad Spend in America
Ad spend in the U.S. generates billions in revenue—in 2019, the top 10 marketers spent over $41 billion on various forms of advertising.
While the ad industry has taken a significant hit in 2020 because of COVID-19, it’s projected to see overall growth in 2021, and a majority of this growth is expected to come in the form of internet advertising.
Internet ads have surged in popularity over the last decade. Here’s a look at the total spend on pure-play internet ads since 2012:
| Year | Total spend on pure-play internet ads (in billions) | % of total ad spend |
|---|---|---|
| 2012 | $29 B | 16% |
| 2014 | $39 B | 20% |
| 2016 | $59 B | 28% |
| 2018 | $92 B | 40% |
| 2020 | $109 B | 49% |
| 2022 | $133 B | 56% |
| 2024 | $151 B | 60% |
While internet advertising has increased over the years, more traditional forms have nose-dived in percentage terms.
For instance, ad spend on directories reached $6 billion in 2012. By 2024, they’re projected to generate merely $68 million in revenue.
Like directories, newspaper and magazine spend have seen significant drops since 2012, with projected decreases on the horizon.
»To learn more, read our full article: How Total Spend by U.S. Advertisers Has Changed, Over 20 Years.
Where does this data come from?
Source: Group M.
Details: Numbers were sourced from This Year Next Year June 2020 Report
Notes: Figures use media ad revenue that includes political advertising. Numbers were rounded for clarity. Data for traditional media includes digital media extensions.


Datastream
Can You Calculate Your Daily Carbon Footprint?
Discover how the average person’s carbon footprint impacts the environment and learn how carbon credits can offset your carbon footprint.


The Briefing
- A person’s carbon footprint is substantial, with activities such as food consumption creating as much as 4,500 g of CO₂ emissions daily.
- By purchasing carbon credits from Carbon Streaming Corporation, you can offset your own emissions and fund positive climate action.
Your Everyday Carbon Footprint
While many large businesses and countries have committed to net-zero goals, it is essential to acknowledge that your everyday activities also contribute to global emissions.
In this graphic, sponsored by Carbon Streaming Corporation, we will explore how the choices we make and the products we use have a profound impact on our carbon footprint.
Carbon Emissions by Activity
Here are some of the daily activities and products of the average person and their carbon footprint, according to Clever Carbon.
| Household Activities & Products | CO2 Emissions (g) |
|---|---|
| 💡 Standard Light Bulb (100 watts, four hours) | 172 g |
| 📱 Mobile Phone Use (195 minutes per day)* | 189 g |
| 👕 Washing Machine (0.63 kWh) | 275 g |
| 🔥 Electric Oven (1.56 kWh) | 675 g |
| ♨️ Tumble Dryer (2.5 kWh) | 1,000 g |
| 🧻 Toilet Roll (2 ply) | 1,300 g |
| 🚿 Hot Shower (10 mins) | 2,000 g |
| 🚙 Daily Commute (one hour, by car) | 3,360 g |
| 🍽️ Average Daily Food Consumption (three meals of 600 calories) | 4,500 g |
| *Phone use based on yearly use of 69kg per the source, Reboxed | |
Your choice of transportation plays a crucial role in determining your carbon footprint. For instance, a 15 km daily commute to work on public transport generates an average of 1,464 g of CO₂ emissions. Compared to 3,360 g—twice the volume for a journey the same length by car.
By opting for more sustainable modes of transport, such as cycling, walking, or public transportation, you can significantly reduce your carbon footprint.
Addressing Your Carbon Footprint
One way to compensate for your emissions is by purchasing high-quality carbon credits.
Carbon credits are used to help fund projects that avoid, reduce or remove CO₂ emissions. This includes nature-based solutions such as reforestation and improved forest management, or technology-based solutions such as the production of biochar and carbon capture and storage (CCS).
While carbon credits offer a potential solution for individuals to help reduce global emissions, public awareness remains a significant challenge. A BCG-Patch survey revealed that only 34% of U.S. consumers are familiar with carbon credits, and only 3% have purchased them in the past.
About Carbon Streaming
By financing the creation or expansion of carbon projects, Carbon Streaming Corporation secures the rights to future carbon credits generated by these sustainable projects. You can then purchase these carbon credits to help fund climate solutions around the world and compensate for your own emissions.
Ready to get involved?
>> Learn more about purchasing carbon credits at Carbon Streaming

-

 Misc2 weeks ago
Tesla Is Once Again the World’s Best-Selling EV Company
-

 AI1 week ago
The Stock Performance of U.S. Chipmakers So Far in 2024
-

 Misc1 week ago
Almost Every EV Stock is Down After Q1 2024
-

 Money2 weeks ago
Where Does One U.S. Tax Dollar Go?
-

 Green2 weeks ago
Ranked: Top Countries by Total Forest Loss Since 2001
-

 Real Estate2 weeks ago
Visualizing America’s Shortage of Affordable Homes
-

 Maps2 weeks ago
Mapped: Average Wages Across Europe
-

 Mining2 weeks ago
Charted: The Value Gap Between the Gold Price and Gold Miners