Technology
Ranked: The Most Popular Paid Subscription News Websites
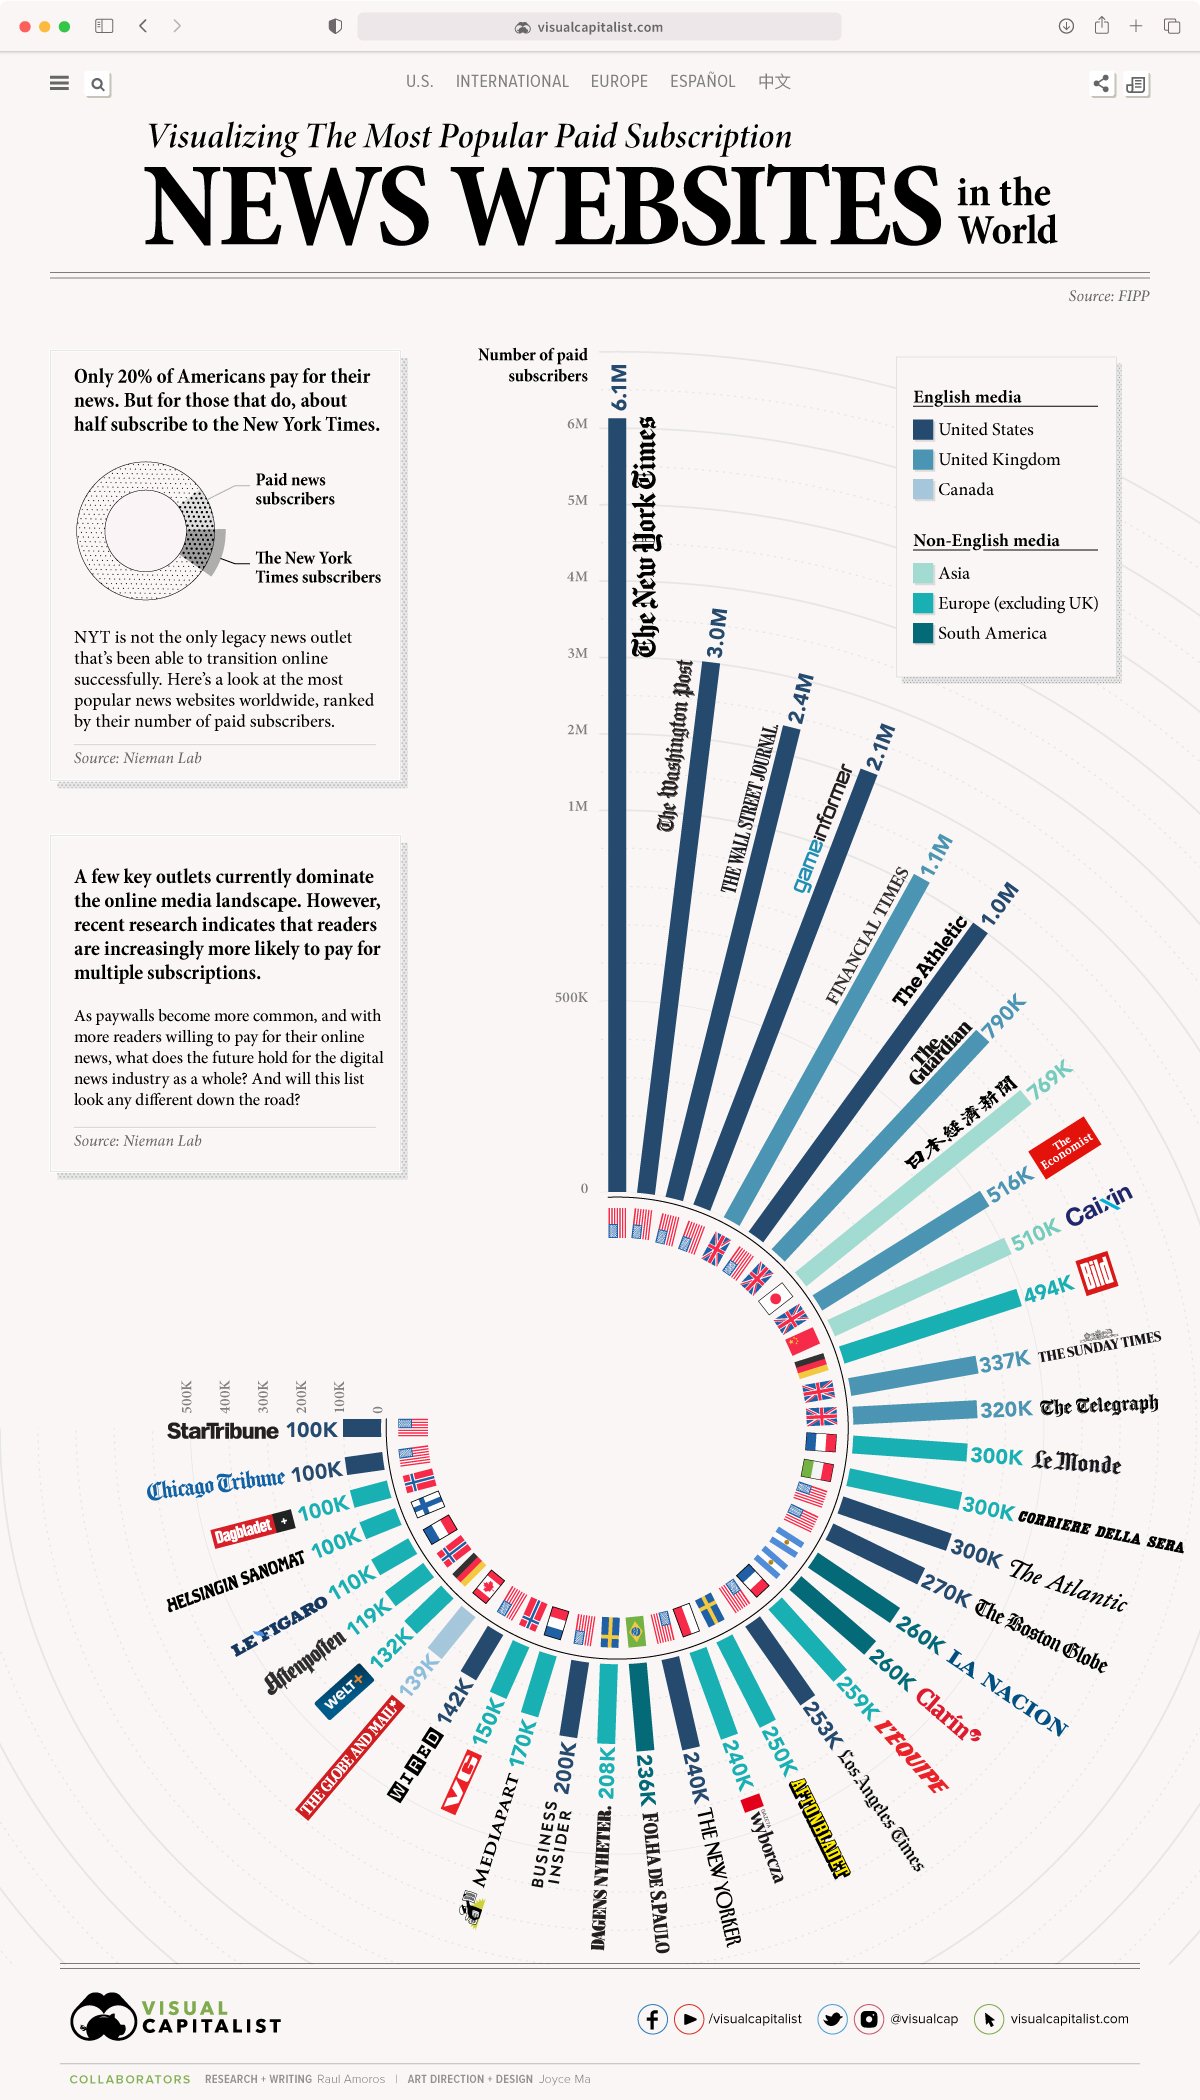


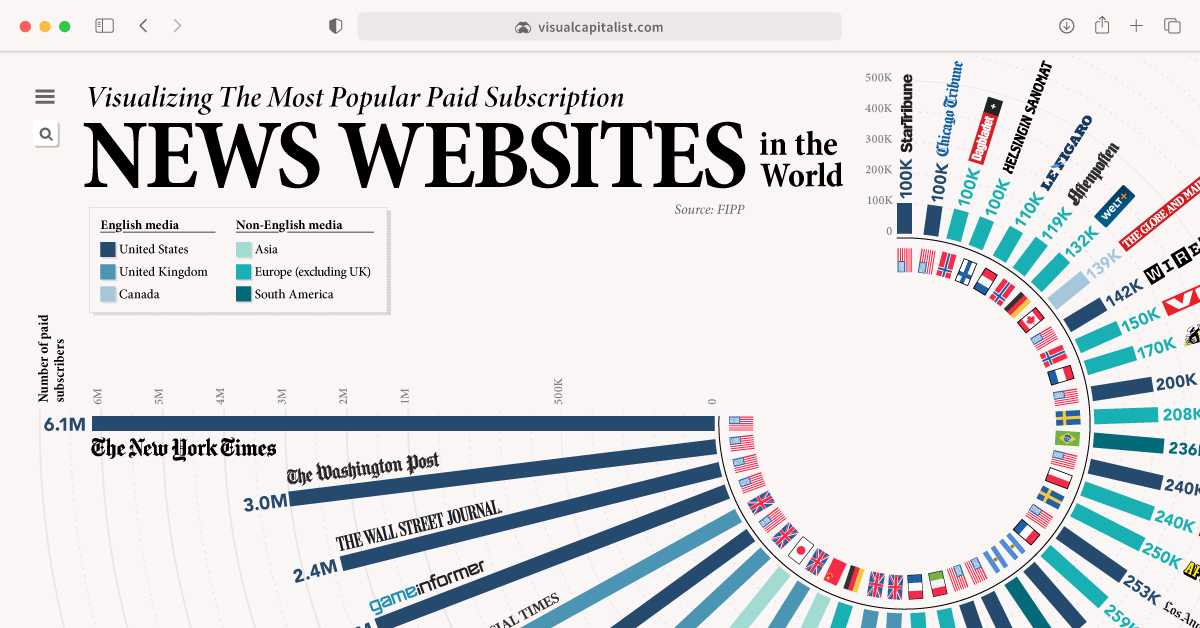
Ranked: The Most Popular Subscription News Websites
While paywalls are becoming increasingly more popular among news websites, most consumers still aren’t willing to pay for their online news.
In fact, a recent survey by the Reuters Institute for the Study of Journalism reveals that only 20% of Americans pay for digital news, and of those that do, the majority subscribe to only one brand.
This begs the question—which news outlets are audiences willing to pay for?
Using data from FIPP and CeleraOne, this graphic looks at the most popular news websites across the globe, based on their total number of paid subscriptions.
*Note: This report relies on publicly available data, and should not be considered an exhaustive list.
The Full Breakdown
With 7.5 million subscriptions, The New York Times (NYT) takes the top spot on the list. 2020 was an exceptionally strong year for the outlet—by Q3 2020, the NYT had generated the same amount of revenue from digital subscriptions as it had for the entire year of 2019.
| Rank | Publication | Paid Subscriptions |
|---|---|---|
| 1 | 🇺🇸 The New York Times | 6,100,000 |
| 2 | 🇺🇸 The Washington Post | 3,000,000 |
| 3 | 🇺🇸 The Wall Street Journal | 2,400,000 |
| 4 | 🇺🇸 Game Informer | 2,100,000 |
| 5 | 🇬🇧 Financial Times | 1,100,000 |
| 6 | 🇺🇸 The Athletic | 1,000,000 |
| 7 | 🇬🇧 The Guardian | 790,000 |
| 8 | 🇯🇵 Nikkei | 769,000 |
| 9 | 🇬🇧 The Economist | 516,000 |
| 10 | 🇨🇳 Caixin | 510,000 |
| 11 | 🇩🇪 Bild | 494,000 |
| 12 | 🇬🇧 The Sunday Times | 337,000 |
| 13 | 🇬🇧 The Telegraph | 320,000 |
| 14 | 🇺🇸 The Atlantic | 300,000 |
| 15 | 🇮🇹 Corriere Della Sera | 300,000 |
| 16 | 🇫🇷 Le Monde | 300,000 |
| 17 | 🇺🇸 The Boston Globe | 270,000 |
| 18 | 🇦🇷 La Nacion | 260,000 |
| 19 | 🇦🇷 Clarin | 260,000 |
| 20 | 🇫🇷 L'equipe | 259,000 |
| 21 | 🇺🇸 Los Angeles Times | 253,000 |
| 22 | 🇸🇪 Aftonbladet | 250,000 |
| 23 | 🇺🇸 The New Yorker | 240,000 |
| 24 | 🇵🇱 Wyborcza | 240,000 |
| 25 | 🇧🇷 Folha de S.Paulo | 236,000 |
| 26 | 🇸🇪 Dagens Nyheter | 208,000 |
| 27 | 🇺🇸 Business Insider | 200,000 |
| 28 | 🇫🇷 Mediapart | 170,000 |
| 29 | 🇳🇴 VG | 150,000 |
| 30 | 🇺🇸 Wired | 142,000 |
| 31 | 🇨🇦 The Globe and Mail | 139,000 |
| 32 | 🇩🇪 Welt | 132,000 |
| 33 | 🇳🇴 Aftenposten | 119,000 |
| 34 | 🇫🇷 Le Figaro | 110,000 |
| 35 | 🇺🇸 Chicago Tribune | 100,000 |
| 36 | 🇺🇸 Star Tribune | 100,000 |
| 37 | 🇳🇴 Dagbladet | 100,000 |
| 38 | 🇫🇮 Helsingin Sanomat | 100,000 |
The Times is the most popular by a landslide—it has over double the number of subscriptions than the second outlet on the list, The Washington Post. Yet, while WaPo is no match for NYT, it still boasts a strong following, with approximately 3 million paid subscriptions as of Q4 2020.
Japanese outlet Nikkei ranks number one among the non-English news websites. It’s the largest business newspaper in Japan, mainly focusing on markets and finance, but also covering politics, sports, and health.
Legacy Papers: Which Websites Come From Traditional Media?
Most of the websites on this list stem from traditional media. Because of this, they’ve had years to establish themselves as trusted sources, and win over loyal readers.
Interestingly, more than half of the outlets included in this ranking are at least 100 years old.
| Publication | Year Launched | Age (Years) |
|---|---|---|
| 🇬🇧 The Guardian | 1821 | 200 |
| 🇬🇧 The Sunday Times | 1821 | 200 |
| 🇫🇷 Le Figaro | 1826 | 195 |
| 🇸🇪 Aftonbladet | 1830 | 190 |
| 🇬🇧 The Economist | 1843 | 178 |
| 🇺🇸 Chicago Tribune | 1847 | 173 |
| 🇺🇸 NYT | 1852 | 169 |
| 🇬🇧 The Telegraph | 1855 | 166 |
| 🇺🇸 The Atlantic | 1857 | 164 |
| 🇳🇴 Aftenposten | 1860 | 160 |
| 🇸🇪 Dagens Nyheter | 1864 | 157 |
| 🇺🇸 Star Tribune | 1867 | 154 |
| 🇳🇴 Dagbladet | 1869 | 152 |
| 🇦🇷 La Nacion | 1870 | 151 |
| 🇺🇸 The Boston Globe | 1872 | 149 |
| 🇮🇹 Corriere Della Sera | 1876 | 145 |
| 🇺🇸 Washington Post | 1877 | 144 |
| 🇯🇵 Nikkei.com | 1876 | 144 |
| 🇺🇸 LA Times | 1881 | 140 |
| 🇬🇧 Financial Times | 1888 | 133 |
| 🇺🇸 Wall Street Journal | 1889 | 132 |
| 🇫🇮 Helsingin Sanomat | 1889 | 132 |
| 🇧🇷 Folha de S.Paulo | 1921 | 100 |
| 🇺🇸 The New Yorker | 1925 | 96 |
| 🇨🇦 The Globe and Mail | 1936 | 85 |
| 🇫🇷 Le Monde | 1944 | 77 |
| 🇦🇷 Clarin | 1945 | 76 |
| 🇳🇴 VG | 1945 | 76 |
| 🇫🇷 L'equipe | 1946 | 75 |
| 🇩🇪 Welt | 1946 | 75 |
| 🇩🇪 Bild | 1952 | 69 |
| 🇵🇱 Wyborcza | 1989 | 32 |
| 🇺🇸 Game Informer | 1991 | 30 |
| 🇺🇸 Wired | 1993 | 28 |
| 🇺🇸 Business Insider | 2007 | 14 |
| 🇫🇷 Mediapart | 2008 | 13 |
| 🇨🇳 Caixin | 2009 | 12 |
| 🇺🇸 The Athletic | 2016 | 5 |
Yet, undeterred by these well-established outlets, a few scrappy websites made the cut despite a shorter history. Four out of the 38 websites are less than 20 years old.
The Athletic is the newest outlet to make the ranking. Established in 2016, the outlet’s target demographic is die-hard sports fans who miss the days of in-depth, quality sports writing.
The Need For Trusted Sources
Amidst the global pandemic, issues involving misinformation and fake news have helped reaffirm the important role that trusted news sources play in the dissemination of public information.
With this in mind, it’ll be interesting to see what the future holds for digital media consumption. With paywalls becoming increasingly more common, will consumers jump on board and eventually be more willing to pay for their news?


Technology
All of the Grants Given by the U.S. CHIPS Act
Intel, TSMC, and more have received billions in subsidies from the U.S. CHIPS Act in 2024.


All of the Grants Given by the U.S. CHIPS Act
This was originally posted on our Voronoi app. Download the app for free on iOS or Android and discover incredible data-driven charts from a variety of trusted sources.
This visualization shows which companies are receiving grants from the U.S. CHIPS Act, as of April 25, 2024. The CHIPS Act is a federal statute signed into law by President Joe Biden that authorizes $280 billion in new funding to boost domestic research and manufacturing of semiconductors.
The grant amounts visualized in this graphic are intended to accelerate the production of semiconductor fabrication plants (fabs) across the United States.
Data and Company Highlights
The figures we used to create this graphic were collected from a variety of public news sources. The Semiconductor Industry Association (SIA) also maintains a tracker for CHIPS Act recipients, though at the time of writing it does not have the latest details for Micron.
| Company | Federal Grant Amount | Anticipated Investment From Company |
|---|---|---|
| 🇺🇸 Intel | $8,500,000,000 | $100,000,000,000 |
| 🇹🇼 TSMC | $6,600,000,000 | $65,000,000,000 |
| 🇰🇷 Samsung | $6,400,000,000 | $45,000,000,000 |
| 🇺🇸 Micron | $6,100,000,000 | $50,000,000,000 |
| 🇺🇸 GlobalFoundries | $1,500,000,000 | $12,000,000,000 |
| 🇺🇸 Microchip | $162,000,000 | N/A |
| 🇬🇧 BAE Systems | $35,000,000 | N/A |
BAE Systems was not included in the graphic due to size limitations
Intel’s Massive Plans
Intel is receiving the largest share of the pie, with $8.5 billion in grants (plus an additional $11 billion in government loans). This grant accounts for 22% of the CHIPS Act’s total subsidies for chip production.
From Intel’s side, the company is expected to invest $100 billion to construct new fabs in Arizona and Ohio, while modernizing and/or expanding existing fabs in Oregon and New Mexico. Intel could also claim another $25 billion in credits through the U.S. Treasury Department’s Investment Tax Credit.
TSMC Expands its U.S. Presence
TSMC, the world’s largest semiconductor foundry company, is receiving a hefty $6.6 billion to construct a new chip plant with three fabs in Arizona. The Taiwanese chipmaker is expected to invest $65 billion into the project.
The plant’s first fab will be up and running in the first half of 2025, leveraging 4 nm (nanometer) technology. According to TrendForce, the other fabs will produce chips on more advanced 3 nm and 2 nm processes.
The Latest Grant Goes to Micron
Micron, the only U.S.-based manufacturer of memory chips, is set to receive $6.1 billion in grants to support its plans of investing $50 billion through 2030. This investment will be used to construct new fabs in Idaho and New York.

-

 Debt1 week ago
How Debt-to-GDP Ratios Have Changed Since 2000
-

 Countries2 weeks ago
Population Projections: The World’s 6 Largest Countries in 2075
-

 Markets2 weeks ago
The Top 10 States by Real GDP Growth in 2023
-

 Demographics2 weeks ago
The Smallest Gender Wage Gaps in OECD Countries
-

 United States2 weeks ago
Where U.S. Inflation Hit the Hardest in March 2024
-

 Green2 weeks ago
Top Countries By Forest Growth Since 2001
-

 United States2 weeks ago
Ranked: The Largest U.S. Corporations by Number of Employees
-

 Maps2 weeks ago
The Largest Earthquakes in the New York Area (1970-2024)