United States
How Much Do Americans Trust the Media?
How Much Do Americans Trust the Media?
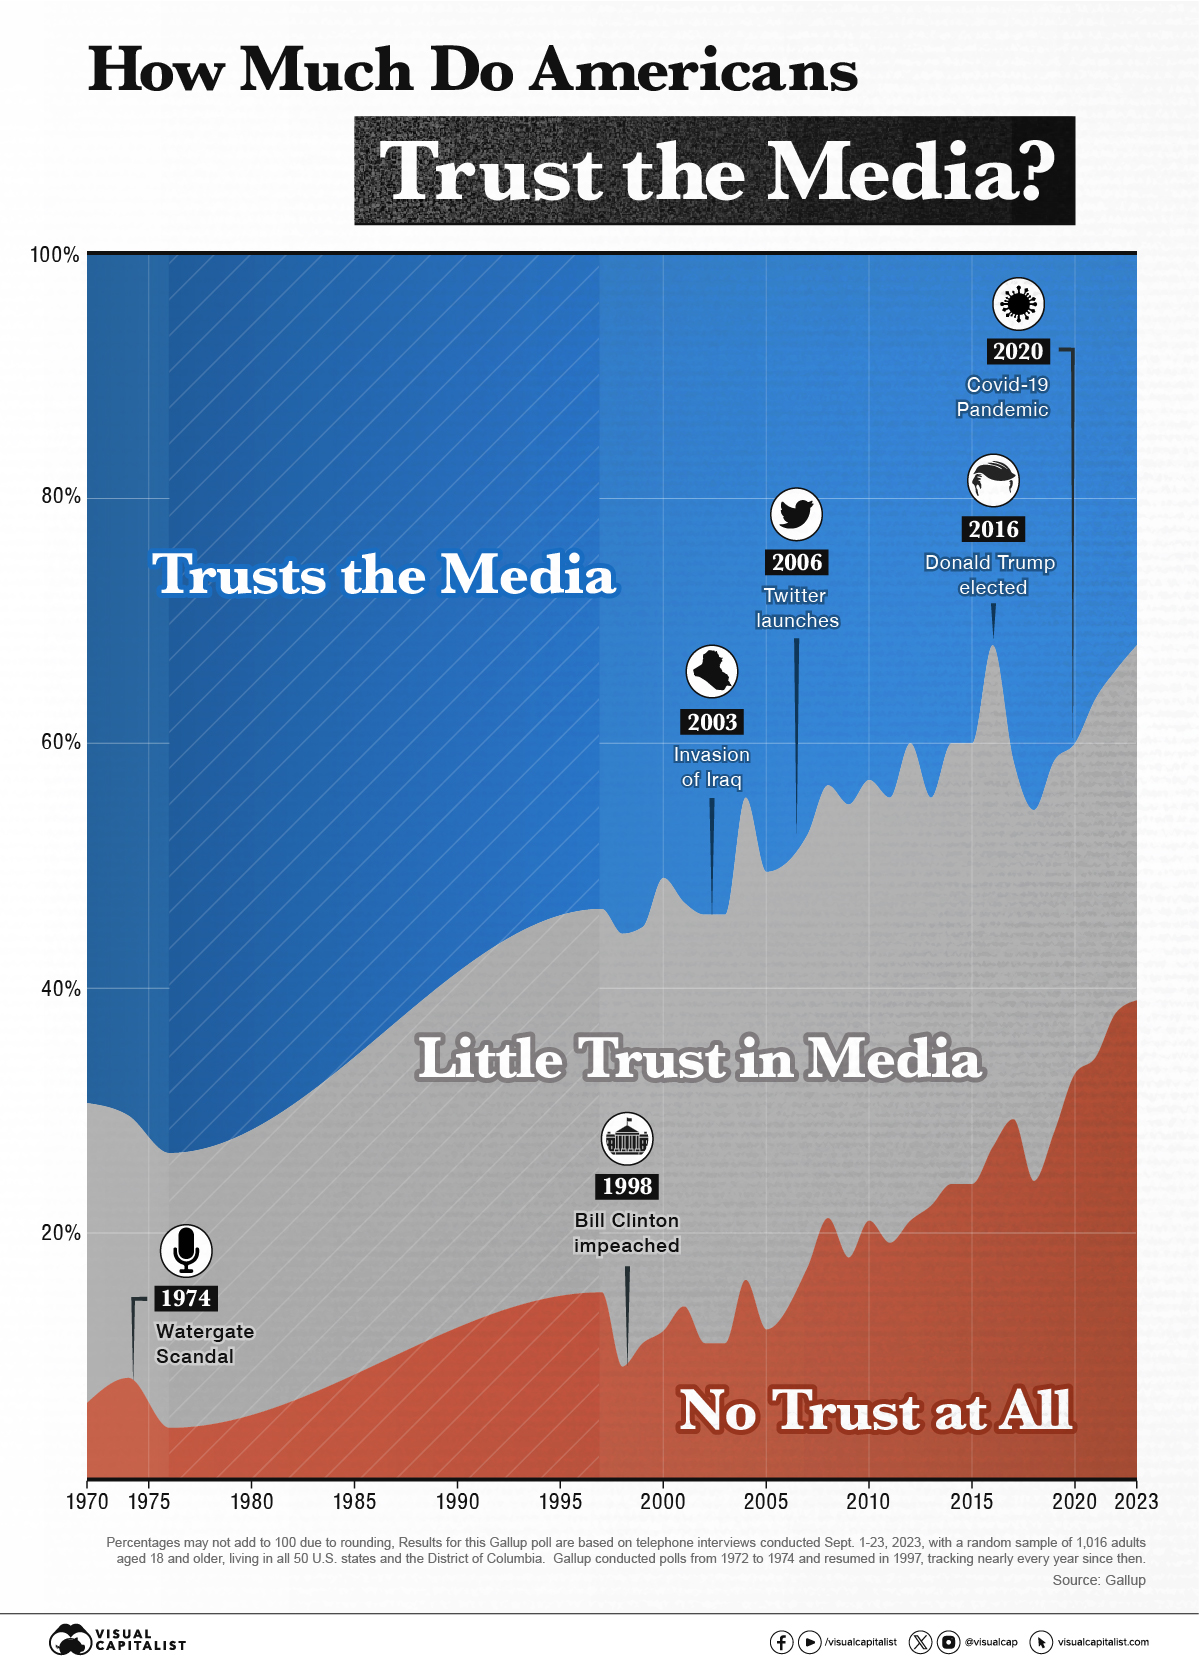
Media trust among Americans has reached its lowest point in six years.
Gallup began its survey on media trust in 1972, repeating it in 1974 and 1976. After a long period, the public opinion firm restarted the polls in 1997 and has asked Americans about their confidence level in the mass media—newspapers, TV, and radio—almost every year since then.
The above graphic illustrates Gallup’s latest poll results, conducted in September 2023.
Americans’ Trust in Mass Media, 1972-2023
Americans’ confidence in the mass media has sharply declined over the last few decades.
| Trust in the mass media | % Great deal/Fair amount | % Not very much | % None at all |
|---|---|---|---|
| 1972 | 68 | 24 | 6 |
| 1974 | 69 | 21 | 8 |
| 1976 | 72 | 22 | 4 |
| 1997 | 53 | 31 | 15 |
| 1998 | 55 | 35 | 9 |
| 1999 | 55 | 34 | 11 |
| 2000 | 51 | 37 | 12 |
| 2001 | 53 | 33 | 14 |
| 2002 | 54 | 35 | 11 |
| 2003 | 54 | 35 | 11 |
| 2004 | 44 | 39 | 16 |
| 2005 | 50 | 37 | 12 |
| 2007 | 47 | 35 | 17 |
| 2008 | 43 | 35 | 21 |
| 2009 | 45 | 37 | 18 |
| 2010 | 43 | 36 | 21 |
| 2011 | 44 | 36 | 19 |
| 2012 | 40 | 39 | 21 |
| 2013 | 44 | 33 | 22 |
| 2014 | 40 | 36 | 24 |
| 2015 | 40 | 36 | 24 |
| 2016 | 32 | 41 | 27 |
| 2017 | 41 | 29 | 29 |
| 2018 | 45 | 30 | 24 |
| 2019 | 41 | 30 | 28 |
| 2020 | 40 | 27 | 33 |
| 2021 | 36 | 29 | 34 |
| 2022 | 34 | 28 | 38 |
| 2023 | 32 | 29 | 39 |
In 2016, the number of respondents trusting media outlets fell below the tally of those who didn’t trust the media at all. This is the first time that has happened in the poll’s history.
That year was marked by sharp criticism of the media from then-presidential candidate Donald Trump.
In 2017, the use of the term ‘fake news’ rose by 365% on social media, and the term was named the word of the year by dictionary publisher Collins.
The Lack of Faith in Institutions and Social Media
Although there’s no single reason to explain the decline of trust in the traditional media, some studies point to potential drivers.
According to Michael Schudson, a sociologist and historian of the news media and a professor at the Columbia Journalism School, in the 1970s, faith in institutions like the White House or Congress began to decline, consequently impacting confidence in the media.
“That may have been a necessary corrective to a sense of complacency that had been creeping in—among the public and the news media—that allowed perhaps too much trust: we accepted President Eisenhower’s lies about the U-2 spy plane, President Kennedy’s lies about the ‘missile gap,’ President Johnson’s lies about the war in Vietnam, President Nixon’s lies about Watergate,”
Michael Schudson – Columbia Journalism School
More recently, the internet and social media have significantly changed how people consume media. The rise of platforms such as X/Twitter and Facebook have also disrupted the traditional media status quo.
Partisans’ Trust in Mass Media
Historically, Democrats have expressed more confidence in the media than Republicans.
Democrats’ trust, however, has fallen 12 points over the past year to 58%, compared with 11% among Republicans and 29% among independents.
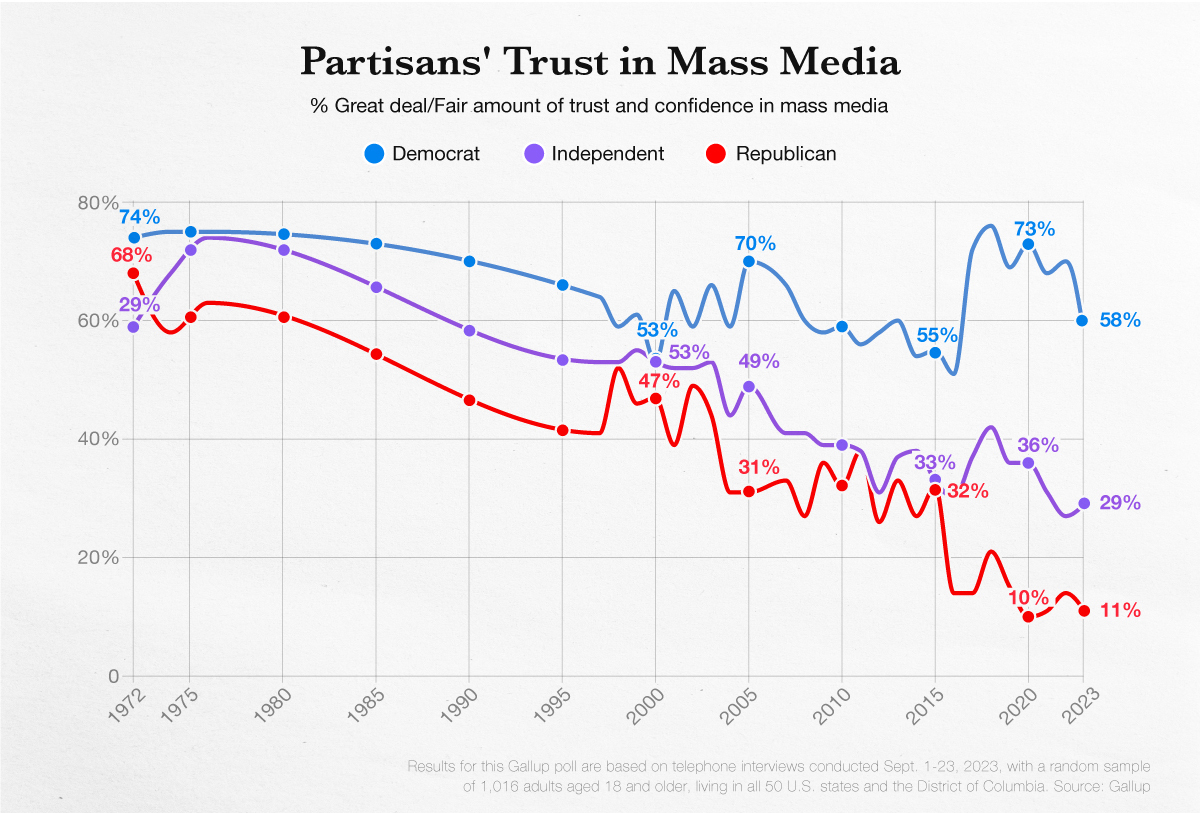
According to Gallup, Republicans’ low confidence in the media has little room to worsen, but Democrat confidence could still deteriorate and bring the overall national reading down further.
The poll also shows that young Democrats have less confidence in the media than older Democrats, while Republicans are less varied in their views by age group.


Misc
Visualizing the Most Common Pets in the U.S.
Lions, tigers, and bears, oh my!—these animals do not feature on this list of popular American household pets.


Visualizing The Most Common Pets in the U.S.
This was originally posted on our Voronoi app. Download the app for free on iOS or Android and discover incredible data-driven charts from a variety of trusted sources.
In this graphic, we visualized the most common American household pets, based on 2023-2024 data from the American Pet Products Association (accessed via Forbes Advisor).
Figures represent the number of households that own each pet type, rather than the actual number of each animal. The “small animal” category includes hamsters, gerbils, rabbits, guinea pigs, chinchillas, mice, rats, and ferrets.
What is the Most Popular American Household Pet?
Based on this data, dogs—one of the first domesticated animals—are the most common pets in the United States. In fact, around 65 million households own a dog, and spend an average of $900 a year on their care.
| Rank | Species | Households |
|---|---|---|
| 1 | 🐶 Dog | 65M |
| 2 | 🐱 Cat | 47M |
| 3 | 🐟 Freshwater Fish | 11M |
| 4 | 🐰 Small Animals | 7M |
| 5 | 🐦 Bird | 6M |
| 6 | 🦎 Reptile | 6M |
| 7 | 🐴 Horse | 2M |
| 8 | 🐠 Saltwater Fish | 2M |
Note: Households can own multiple pets, and are counted for all relevant categories.
Cats rank second, at 47 million households, and these smaller felines are a little less expensive to own at $700/year according to Forbes estimates.
But aside from these two juggernauts, there are plenty of other common pet types found in households across the country.
Freshwater fish can be found in 11 million households, along with small animals—rabbits, hamsters, guinea pigs—in 7 million. Meanwhile, nearly 6 million homes have birds or reptiles.
Pet Ownership is on the Rise in America
Forbes found that 66% of all American households (numbering 87 million) own at least one pet, up from 56% in 1988. One third of these (29 million) own multiple pets.
A combination of factors is driving this increase: rising incomes, delayed childbirth, and of course the impact of the pandemic which nearly cleared out animal shelters across the globe.
America’s loneliness epidemic may also be a factor. Fledgling research has shown that single-individual households with pets recorded lower rates of loneliness during the pandemic than those without a pet.

-

 Science7 days ago
Visualizing the Average Lifespans of Mammals
-

 Markets2 weeks ago
The Top 10 States by Real GDP Growth in 2023
-

 Demographics2 weeks ago
The Smallest Gender Wage Gaps in OECD Countries
-

 United States2 weeks ago
Where U.S. Inflation Hit the Hardest in March 2024
-

 Green2 weeks ago
Top Countries By Forest Growth Since 2001
-

 United States2 weeks ago
Ranked: The Largest U.S. Corporations by Number of Employees
-

 Maps2 weeks ago
The Largest Earthquakes in the New York Area (1970-2024)
-

 Green2 weeks ago
Ranked: The Countries With the Most Air Pollution in 2023