Technology
The Rise and Fall of Social Media Platforms
The Rise and Fall of Social Media Platforms
Since its inception, the internet has played a pivotal role in connecting people across the globe, including in remote locations.
While the foundational need for human connection hasn’t changed, platforms and technology continue to evolve, even today. Faster internet connections and mobile devices have made social networks a ubiquitous part of our lives, with the time spent on social media each day creeping ever upward.
The Scoreboard Today
Over the last 15 years, billions of people around the world have jumped onto the social media bandwagon – and platforms have battled for our attention spans by inventing (and sometimes flat-out stealing) features to keep people engaged.
Here’s a snapshot of where things stand today:
| Global Rank | Social Platform | Parent Company | Monthly Active Users |
|---|---|---|---|
| 1 | 2.2 billion | ||
| 2 | 1.1 billion | ||
| 3 | Qzone | 🇨🇳 Tencent | 528 million |
| 4 | 🇨🇳 Sina Corp | 528 million | |
| 5 | TikTok | 🇨🇳 ByteDance | 524 million |
| 6 | 340 million | ||
| 7 | 329 million | ||
| 8 | Snapchat | 🇺🇸 Snap Inc | 302 million |
| 9 | 🇺🇸 Microsoft | 260 million |
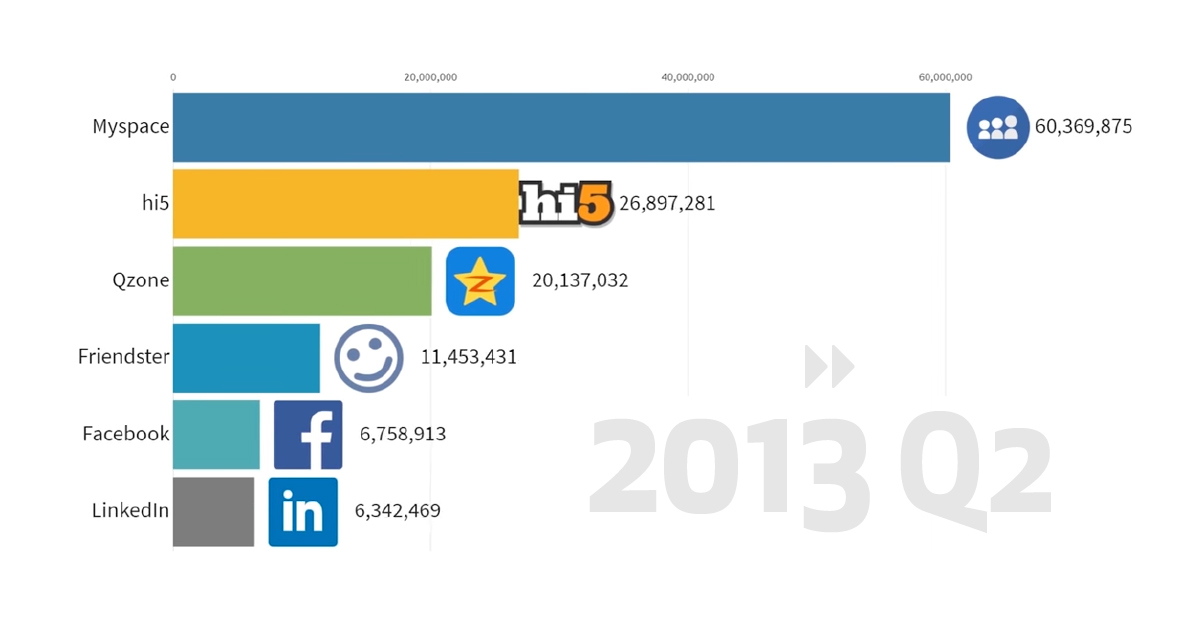
Today’s entertaining video, from the Data is Beautiful YouTube channel, is a look back at the rise and fall of social media platforms – and possibly a glimpse at the future of social media as well.
Below we respond to some key questions and observations raised by this video overview.
Points of Interest
1. What is QZone?
Qzone is China’s largest social network. The platform originally evolved as a sort of blogging service that sprang from QQ, China’s seminal instant messaging service. While Qzone is still one of the world’s largest social media sites – it still attracts around half a billion users per month – WeChat is now the service of choice for almost everyone in China with a smartphone.
2. LinkedIn has been around for a long time.
It’s true. LinkedIn, which hasn’t left the top 10 list since 2003, is a textbook example of a slow and steady growth strategy paying off.
While some networks experience swings in their user base or show a boom and bust growth pattern, LinkedIn has grown every single year since it was launched. Surprisingly, that growth is still clocking in at impressive rates. In 2019, for example, LinkedIn reported a 24% increase in sessions on their platform.
3. Will Facebook ever lose its top spot?
Never say never, but not anytime soon. Since 2008, Facebook has been far and away the most popular social network on the planet. If you include Facebook’s bundled services, over 2 billion people use their network each day. The company has used acquisitions and aggressive feature implementation to keep the company at the forefront of the battle for attention. Facebook itself is under a lot of scrutiny due to growing privacy concerns, but Instagram and WhatsApp are more popular than ever.
4. What Happened to Snapchat?
In 2016, Snapchat had thoroughly conquered the Gen Z demographic and was on a trajectory to becoming one of the top social networks. Facebook, sensing their position being challenged by this upstart company, took the bold step of cloning Snapchat’s features and integrating them into Instagram (even lifting the name “stories” in the process). The move paid off for Facebook and the video above shows Instagram’s user base taking off in 2016, fueled by these new features.
Even though Facebook took some of the wind out of Snapchat’s sails, the company never stopped growing. Earlier this year, Snapchat announced modest growth as its base of daily active users rose to 190 million. For advertisers looking to reach the 18-35 age demographic, Snapchat could still be a compelling option.
5. Why is TikTok so popular now?
The simple answer is that short-form video is extremely popular right now, and TikTok has features that make sharing fun. The average user of TikTok (and its Chinese counterpart, DouYin) spends a staggering 52 minutes per day on the app.
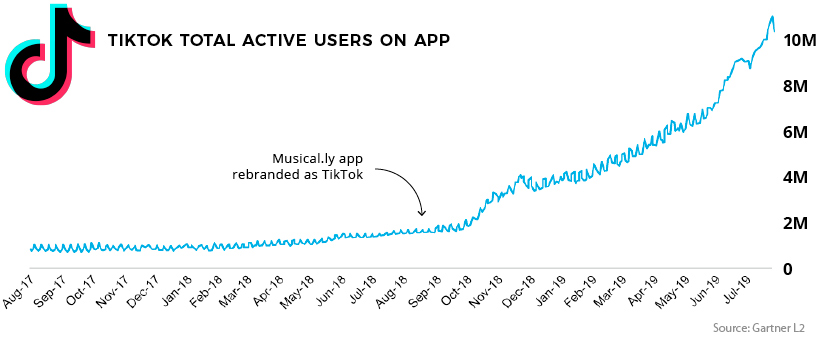
Also propelling its growth is the company’s massive marketing budget. TikTok spent $1 billon last year on advertising in the U.S., and is currently burning through around $3 million per day to get people onto their platform. One looming question for the China-based company is not whether Facebook will co-opt their features, but when.
Technology
All of the Grants Given by the U.S. CHIPS Act
Intel, TSMC, and more have received billions in subsidies from the U.S. CHIPS Act in 2024.

All of the Grants Given by the U.S. CHIPS Act
This was originally posted on our Voronoi app. Download the app for free on iOS or Android and discover incredible data-driven charts from a variety of trusted sources.
This visualization shows which companies are receiving grants from the U.S. CHIPS Act, as of April 25, 2024. The CHIPS Act is a federal statute signed into law by President Joe Biden that authorizes $280 billion in new funding to boost domestic research and manufacturing of semiconductors.
The grant amounts visualized in this graphic are intended to accelerate the production of semiconductor fabrication plants (fabs) across the United States.
Data and Company Highlights
The figures we used to create this graphic were collected from a variety of public news sources. The Semiconductor Industry Association (SIA) also maintains a tracker for CHIPS Act recipients, though at the time of writing it does not have the latest details for Micron.
| Company | Federal Grant Amount | Anticipated Investment From Company |
|---|---|---|
| 🇺🇸 Intel | $8,500,000,000 | $100,000,000,000 |
| 🇹🇼 TSMC | $6,600,000,000 | $65,000,000,000 |
| 🇰🇷 Samsung | $6,400,000,000 | $45,000,000,000 |
| 🇺🇸 Micron | $6,100,000,000 | $50,000,000,000 |
| 🇺🇸 GlobalFoundries | $1,500,000,000 | $12,000,000,000 |
| 🇺🇸 Microchip | $162,000,000 | N/A |
| 🇬🇧 BAE Systems | $35,000,000 | N/A |
BAE Systems was not included in the graphic due to size limitations
Intel’s Massive Plans
Intel is receiving the largest share of the pie, with $8.5 billion in grants (plus an additional $11 billion in government loans). This grant accounts for 22% of the CHIPS Act’s total subsidies for chip production.
From Intel’s side, the company is expected to invest $100 billion to construct new fabs in Arizona and Ohio, while modernizing and/or expanding existing fabs in Oregon and New Mexico. Intel could also claim another $25 billion in credits through the U.S. Treasury Department’s Investment Tax Credit.
TSMC Expands its U.S. Presence
TSMC, the world’s largest semiconductor foundry company, is receiving a hefty $6.6 billion to construct a new chip plant with three fabs in Arizona. The Taiwanese chipmaker is expected to invest $65 billion into the project.
The plant’s first fab will be up and running in the first half of 2025, leveraging 4 nm (nanometer) technology. According to TrendForce, the other fabs will produce chips on more advanced 3 nm and 2 nm processes.
The Latest Grant Goes to Micron
Micron, the only U.S.-based manufacturer of memory chips, is set to receive $6.1 billion in grants to support its plans of investing $50 billion through 2030. This investment will be used to construct new fabs in Idaho and New York.
-

 Education1 week ago
How Hard Is It to Get Into an Ivy League School?
-

 Technology2 weeks ago
Ranked: Semiconductor Companies by Industry Revenue Share
-

 Markets2 weeks ago
Ranked: The World’s Top Flight Routes, by Revenue
-

 Demographics2 weeks ago
Population Projections: The World’s 6 Largest Countries in 2075
-

 Markets2 weeks ago
The Top 10 States by Real GDP Growth in 2023
-

 Demographics2 weeks ago
The Smallest Gender Wage Gaps in OECD Countries
-

 Economy2 weeks ago
Where U.S. Inflation Hit the Hardest in March 2024
-

 Green2 weeks ago
Top Countries By Forest Growth Since 2001

