Business
Visualized: The Top 25 U.S. Newspapers by Daily Circulation
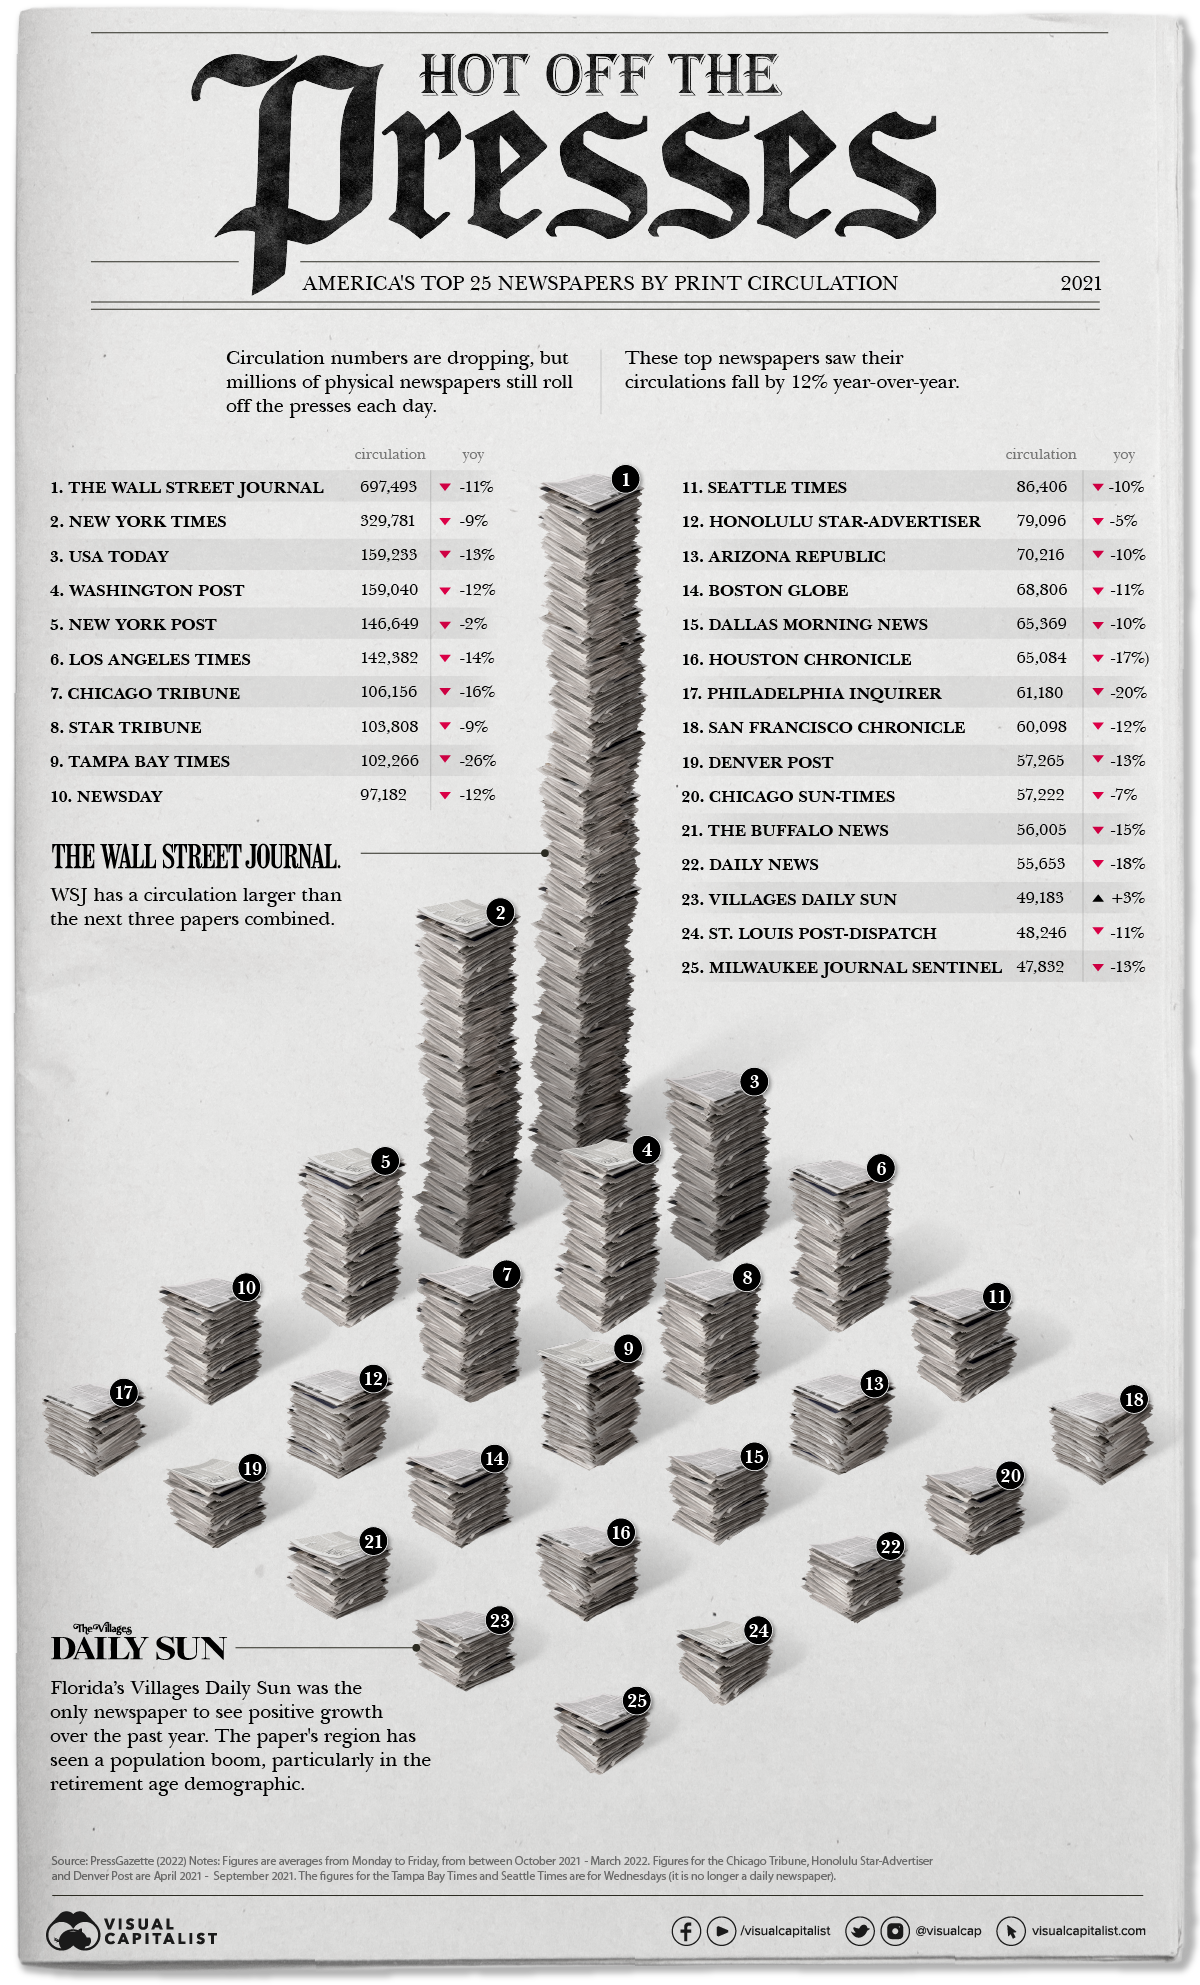


Visualized: The Top 25 U.S. Newspapers by Daily Circulation
Most people today—more than 8 in 10 Americans—get their news via digital devices, doing their reading on apps, listening to podcasts, or scrolling through social media feeds.
It’s no surprise then that over the last year, only one U.S. newspaper of the top 25 most popular in the country saw positive growth in their daily print circulations.
Based on data from Press Gazette, this visual stacks up the amount of daily newspapers different U.S. publications dole out and how that’s changed year-over-year.
Extra, Extra – Read All About It
The most widely circulated physical newspaper is the Wall Street Journal (WSJ) by a long shot—sending out almost 700,000 copies a day. But it is important to note that this number is an 11% decrease since 2021.
Here’s a closer look at the data.
| Rank | Newspaper | Average Daily Print Circulation | Year-Over-Year Change |
|---|---|---|---|
| #1 | Wall Street Journal | 697,493 | −11% |
| #2 | New York Times | 329,781 | −9% |
| #3 | USA Today | 159,233 | −13% |
| #4 | Washington Post | 159,040 | −12% |
| #5 | New York Post | 146,649 | −2% |
| #6 | Los Angeles Times | 142,382 | −14% |
| #7 | Chicago Tribune | 106,156 | −16% |
| #8 | Star Tribune | 103,808 | −9% |
| #9 | Tampa Bay Times | 102,266 | −26% |
| #10 | Newsday | 97,182 | −12% |
| #11 | Seattle Times | 86,406 | −10% |
| #12 | Honolulu Star-Advertiser | 79,096 | −5% |
| #13 | Arizona Republic | 70,216 | −10% |
| #14 | Boston Globe | 68,806 | −11% |
| #15 | Dallas Morning News | 65,369 | −10% |
| #16 | Houston Chronicle | 65,084 | −17% |
| #17 | Philadelphia Inquirer | 61,180 | −20% |
| #18 | San Francisco Chronicle | 60,098 | −12% |
| #19 | Denver Post | 57,265 | −13% |
| #20 | Chicago Sun-Times | 57,222 | −7% |
| #21 | The Buffalo News | 56,005 | −15% |
| #22 | Daily News | 55,653 | −18% |
| #23 | Villages Daily Sun | 49,183 | 3% |
| #24 | St. Louis Post-Dispatch | 48,246 | −11% |
| #25 | Milwaukee Journal Sentinel | 47,832 | −13% |
These papers, although experiencing negative growth when it comes to print, are still extremely popular and widely-read publications digitally—not only in the U.S., but worldwide. For example, the New York Times reported having reached 9 million subscribers globally earlier this year.
The one paper with increased print circulation was The Villages Daily Sun, which operates out of a retirement community in Florida. Elderly people tend to be the most avid readers of print papers. Another Florida newspaper, the Tampa Bay Times, was the worst performer at -26%.
In total, 2,500 U.S. newspapers have shut down since 2005. One-third of American newspapers are expected to be shuttered by 2025. This particularly impacts small communities and leaves many across America in ‘news deserts.’
Print vs. Digital Newspapers
Regardless of print’s downturn, digital subscriptions remain much higher for most of these papers. As one example, The Washington Post has over 3 million online subscribers, compared to their 159,000 print readers.
To put things in perspective, around 24 million print papers now circulate throughout the U.S. on any given day. But looking back at the industry’s peak in the 1980s, almost 64 million were distributed on any given weekday.
And digital is not done growing. Newsroom hires have been ramping up for “digital-native” news sites—publications that started online and never had a print version. On the flipside, employment at traditional papers has more than halved since 2008.
Problems with Media
American news media can be extremely divisive. Many newsrooms across the country play into fear, sensationalism, and partisan politics.
Digital news only makes this worse, utilizing algorithms designed to keep a person’s eyes on the page longer, pushing stories with narratives a person shows interest in, and often taking them down a rabbit hole of fringe information—sometimes towards the extremes.
Additionally, the business of journalism is an increasingly less lucrative industry. Most revenue comes from digital ads running on news sites—so rather than selling the news to consumers, it’s the time and attention of consumers that is being sold to advertisers. Furthermore, some of the best quality content is locked up behind subscription-based paywalls.
Print may actually be one way to avoid some of the more obvious issues, particularly because there’s no way to track the data on which stories you read. But all publications still have inherent bias, of course, and it’s clear that print papers are not bouncing back any time soon.


Markets
Ranked: The Largest U.S. Corporations by Number of Employees
We visualized the top U.S. companies by employees, revealing the massive scale of retailers like Walmart, Target, and Home Depot.


The Largest U.S. Corporations by Number of Employees
This was originally posted on our Voronoi app. Download the app for free on Apple or Android and discover incredible data-driven charts from a variety of trusted sources.
Revenue and profit are common measures for measuring the size of a business, but what about employee headcount?
To see how big companies have become from a human perspective, we’ve visualized the top U.S. companies by employees. These figures come from companiesmarketcap.com, and were accessed in March 2024. Note that this ranking includes publicly-traded companies only.
Data and Highlights
The data we used to create this list of largest U.S. corporations by number of employees can be found in the table below.
| Company | Sector | Number of Employees |
|---|---|---|
| Walmart | Consumer Staples | 2,100,000 |
| Amazon | Consumer Discretionary | 1,500,000 |
| UPS | Industrials | 500,000 |
| Home Depot | Consumer Discretionary | 470,000 |
| Concentrix | Information Technology | 440,000 |
| Target | Consumer Staples | 440,000 |
| Kroger | Consumer Staples | 430,000 |
| UnitedHealth | Health Care | 400,000 |
| Berkshire Hathaway | Financials | 383,000 |
| Starbucks | Consumer Discretionary | 381,000 |
| Marriott International | Consumer Discretionary | 377,000 |
| Cognizant | Information Technology | 346,600 |
Retail and Logistics Top the List
Companies like Walmart, Target, and Kroger have a massive headcount due to having many locations spread across the country, which require everything from cashiers to IT professionals.
Moving goods around the world is also highly labor intensive, explaining why UPS has half a million employees globally.
Below the Radar?
Two companies that rank among the largest U.S. corporations by employees which may be less familiar to the public include Concentrix and Cognizant. Both of these companies are B2B brands, meaning they primarily work with other companies rather than consumers. This contrasts with brands like Amazon or Home Depot, which are much more visible among average consumers.
A Note on Berkshire Hathaway
Warren Buffett’s company doesn’t directly employ 383,000 people. This headcount actually includes the employees of the firm’s many subsidiaries, such as GEICO (insurance), Dairy Queen (retail), and Duracell (batteries).
If you’re curious to see how Buffett’s empire has grown over the years, check out this animated graphic that visualizes the growth of Berkshire Hathaway’s portfolio from 1994 to 2022.

-

 Maps2 weeks ago
Mapped: Average Wages Across Europe
-

 Money1 week ago
Which States Have the Highest Minimum Wage in America?
-

 Real Estate1 week ago
Ranked: The Most Valuable Housing Markets in America
-

 Markets1 week ago
Charted: Big Four Market Share by S&P 500 Audits
-

 AI1 week ago
The Stock Performance of U.S. Chipmakers So Far in 2024
-

 Automotive2 weeks ago
Almost Every EV Stock is Down After Q1 2024
-

 Money2 weeks ago
Where Does One U.S. Tax Dollar Go?
-

 Green2 weeks ago
Ranked: Top Countries by Total Forest Loss Since 2001