Technology
Charted: Apple’s Product Revenue (2007-2023)
![]() See this visualization first on the Voronoi app.
See this visualization first on the Voronoi app.
Charted: Apple’s Product Revenue (2007-2023)
This was originally posted on our Voronoi app. Download the app for free on iOS or Android and discover incredible data-driven charts from a variety of trusted sources.
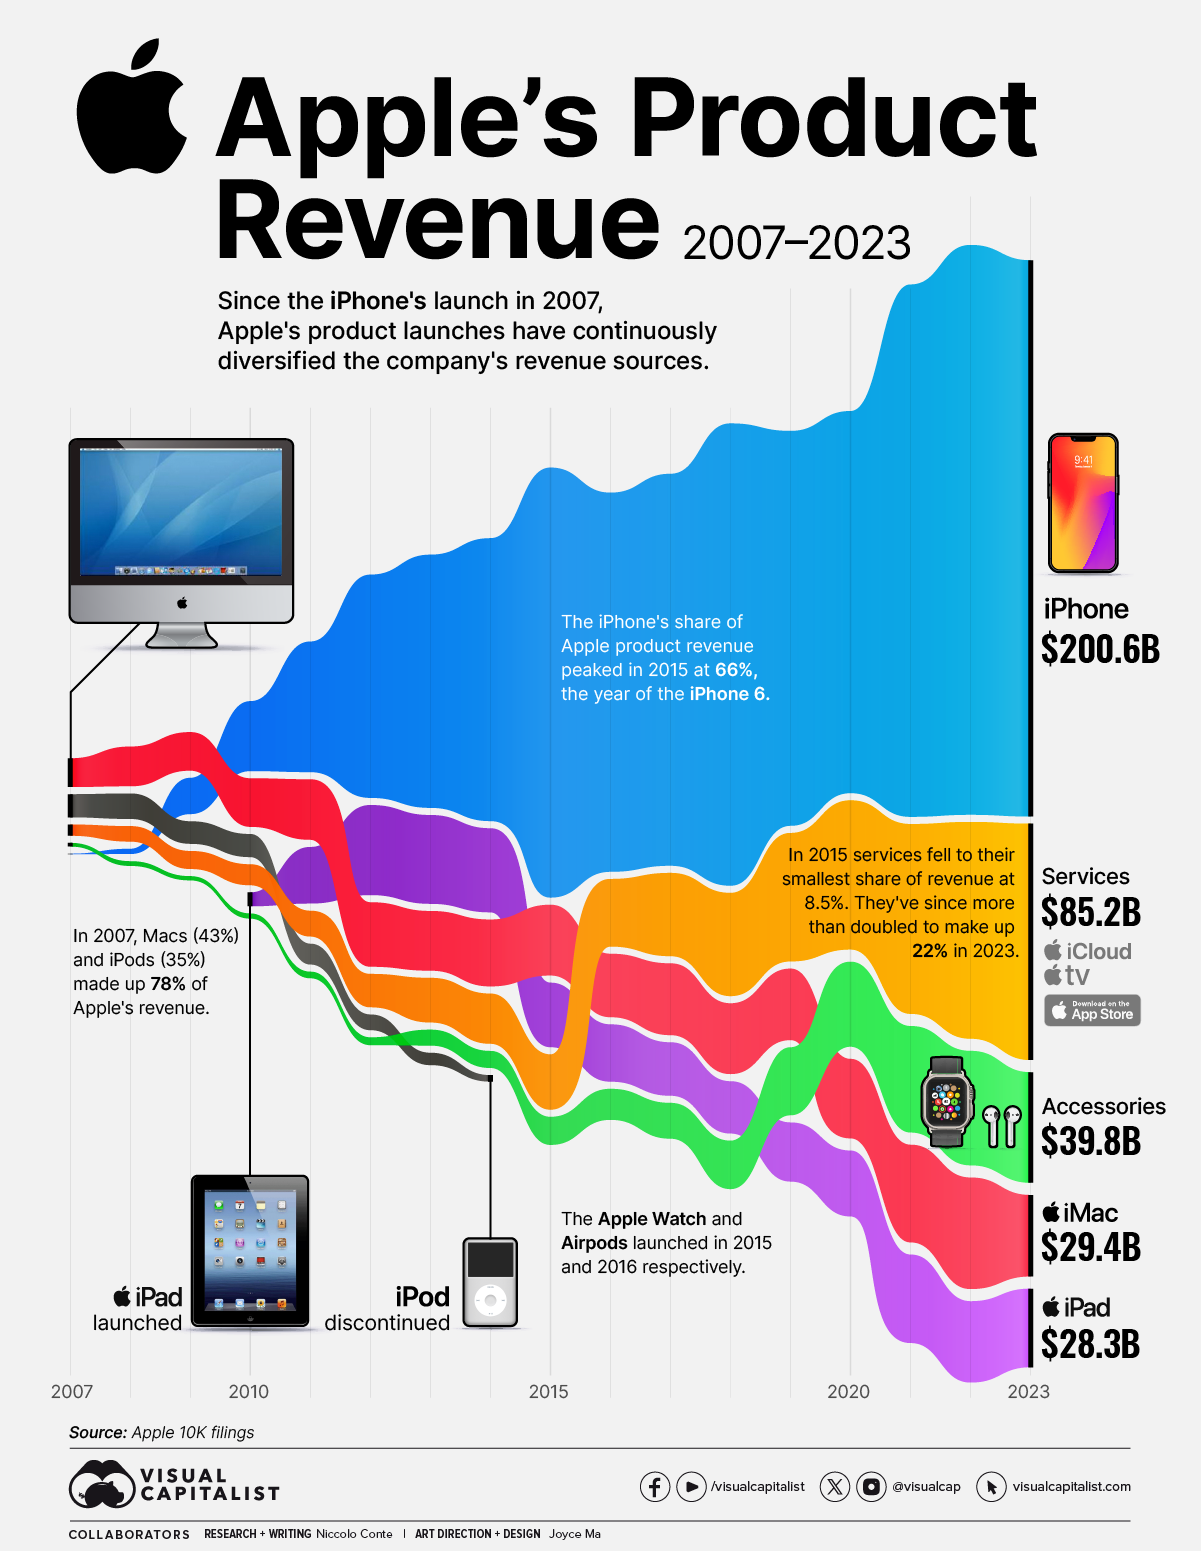
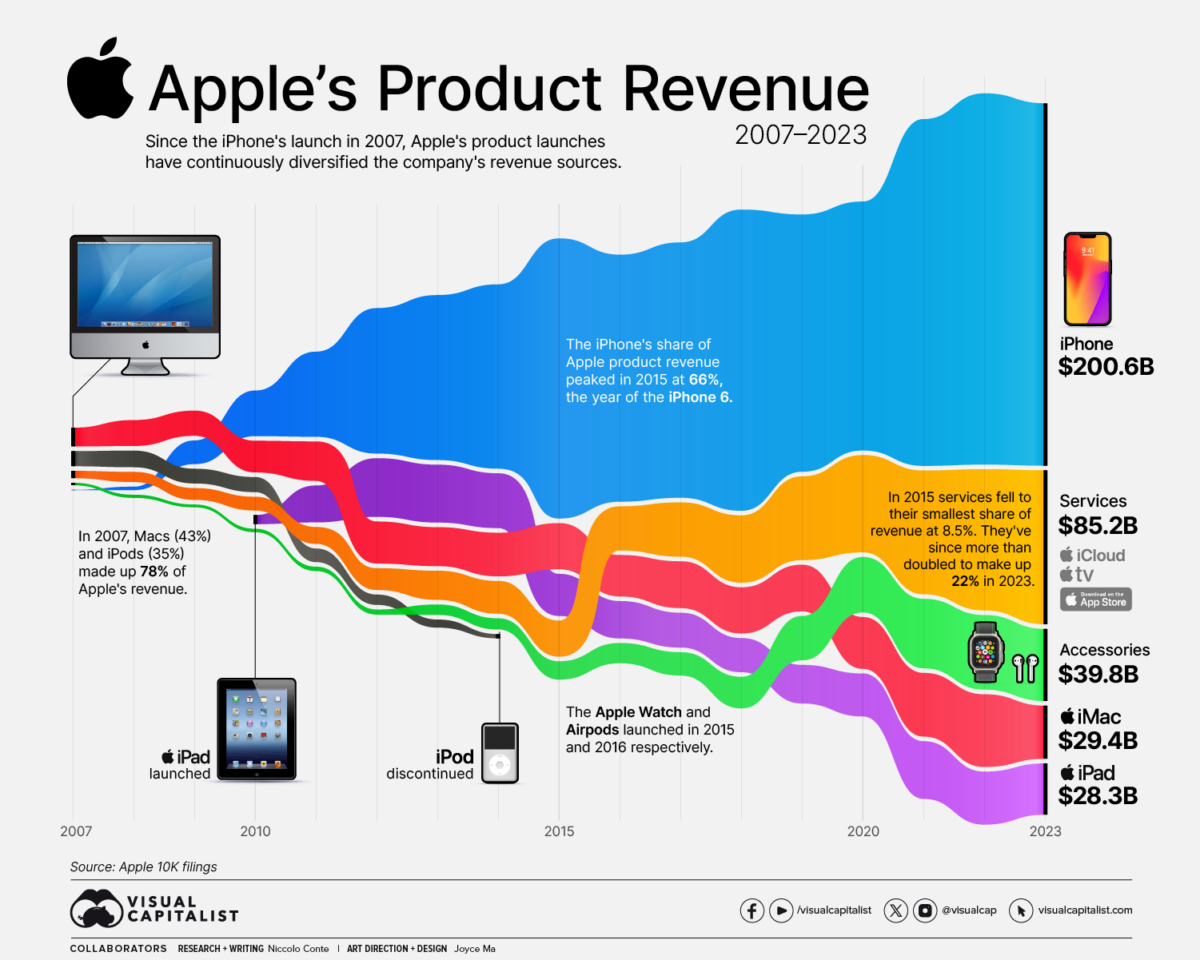
Since the iPhone’s launch in 2007, Apple’s product launches have continuously diversified the company’s revenue sources.
This infographic illustrates Apple’s revenue by product between 2007 and 2023, based on the company’s 10-K filings for the period.
iPhone: A Top-Selling Icon of All Time
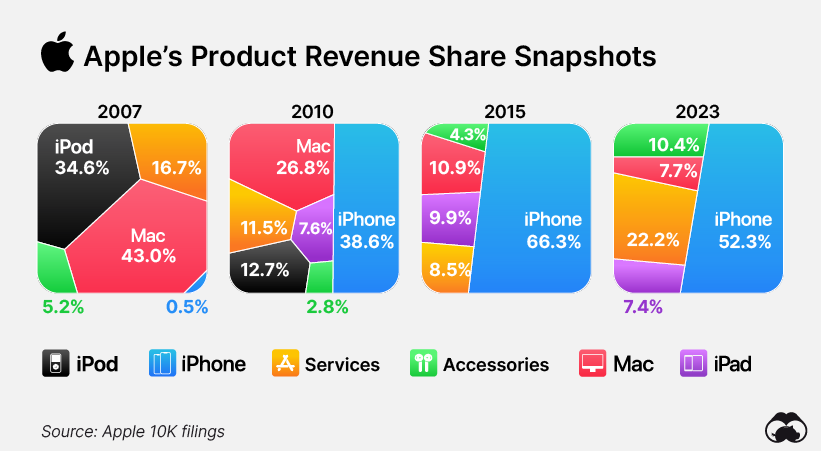
When Apple introduced the iPhone in 2007, Steve Jobs labeled it a “revolutionary product”. That same year, the phone represented just 0.5% of the company’s total revenue. Today, it corresponds to over half of it.
Initially sold exclusively through AT&T for $499, it has since become the company’s most profitable product and one of the world’s most popular phones, with over 2.3 billion units sold and a user base of over 1.5 billion active users.
In 2015, the iPhone’s share of Apple product revenue peaked at 66%, coinciding with the release of the iPhone 6.
| Apple Revenue | iPhone | Accessories | Mac | iPad | iPod | Services |
|---|---|---|---|---|---|---|
| 2007 | $0.1B | $1.2B | $10.3B | - | $8.3B | $4.0B |
| 2008 | $1.8B | $1.6B | $14.2B | - | $9.1B | $5.5B |
| 2009 | $13.0B | $1.4B | $13.8B | - | $8.0B | $6.4B |
| 2010 | $25.2B | $1.8B | $17.5B | $4.9B | $8.3B | $7.5B |
| 2011 | $47.0B | $2.3B | $21.8B | $20.4B | $7.4B | $9.7B |
| 2012 | $80.5B | $2.8B | $23.2B | $32.4B | $5.6B | $11.9B |
| 2013 | $91.8B | $5.7B | $21.5B | $31.9B | $4.4B | $16.0B |
| 2014 | $101.9B | $6.1B | $24.1B | $30.3B | $2.3B | $18.1B |
| 2015 | $155.0B | $10.1B | $25.5B | $23.2B | - | $19.9B |
| 2016 | $136.7B | $11.1B | $22.8B | $20.7B | - | $24.5B |
| 2017 | $141.3B | $12.9B | $25.8B | $19.2B | - | $29.9B |
| 2018 | $166.7B | $17.4B | $25.5B | $18.8B | - | $37.1B |
| 2019 | $142.3B | $24.5B | $25.7B | $21.2B | - | $46.3B |
| 2020 | $137.8B | $30.6B | $28.6B | $23.7B | - | $53.7B |
| 2021 | $191.9B | $38.4B | $35.1B | $31.9B | - | $68.4B |
| 2022 | $205.5B | $41.2B | $40.2B | $29.3B | - | $78.1B |
| 2023 | $200.6B | $39.8B | $29.3B | $28.3B | - | $85.2B |
Apple has also experienced a shift in the share of revenue originating from its Mac division. In 2007, Macs represented 43% of the company’s revenue, while iPods accounted for 35%.
Since 2015, however, services and accessories/wearables (such as the Apple Watch and AirPods) have contributed increasingly to the company’s revenue shares. Mac revenue declined by 27% year over year in 2023, making up only 8% of Apple’s total revenue.
More recently, the growth of services and accessories/wearables has started to slow down, mirroring trends seen in other product lines.
Perhaps the next question for the company is whether the Apple Vision Pro, a wearable computer that projects output directly into the eyes and is primarily controlled through eye tracking and gestures, will become a consistent source of revenue and product line.


Technology
All of the Grants Given by the U.S. CHIPS Act
Intel, TSMC, and more have received billions in subsidies from the U.S. CHIPS Act in 2024.


All of the Grants Given by the U.S. CHIPS Act
This was originally posted on our Voronoi app. Download the app for free on iOS or Android and discover incredible data-driven charts from a variety of trusted sources.
This visualization shows which companies are receiving grants from the U.S. CHIPS Act, as of April 25, 2024. The CHIPS Act is a federal statute signed into law by President Joe Biden that authorizes $280 billion in new funding to boost domestic research and manufacturing of semiconductors.
The grant amounts visualized in this graphic are intended to accelerate the production of semiconductor fabrication plants (fabs) across the United States.
Data and Company Highlights
The figures we used to create this graphic were collected from a variety of public news sources. The Semiconductor Industry Association (SIA) also maintains a tracker for CHIPS Act recipients, though at the time of writing it does not have the latest details for Micron.
| Company | Federal Grant Amount | Anticipated Investment From Company |
|---|---|---|
| 🇺🇸 Intel | $8,500,000,000 | $100,000,000,000 |
| 🇹🇼 TSMC | $6,600,000,000 | $65,000,000,000 |
| 🇰🇷 Samsung | $6,400,000,000 | $45,000,000,000 |
| 🇺🇸 Micron | $6,100,000,000 | $50,000,000,000 |
| 🇺🇸 GlobalFoundries | $1,500,000,000 | $12,000,000,000 |
| 🇺🇸 Microchip | $162,000,000 | N/A |
| 🇬🇧 BAE Systems | $35,000,000 | N/A |
BAE Systems was not included in the graphic due to size limitations
Intel’s Massive Plans
Intel is receiving the largest share of the pie, with $8.5 billion in grants (plus an additional $11 billion in government loans). This grant accounts for 22% of the CHIPS Act’s total subsidies for chip production.
From Intel’s side, the company is expected to invest $100 billion to construct new fabs in Arizona and Ohio, while modernizing and/or expanding existing fabs in Oregon and New Mexico. Intel could also claim another $25 billion in credits through the U.S. Treasury Department’s Investment Tax Credit.
TSMC Expands its U.S. Presence
TSMC, the world’s largest semiconductor foundry company, is receiving a hefty $6.6 billion to construct a new chip plant with three fabs in Arizona. The Taiwanese chipmaker is expected to invest $65 billion into the project.
The plant’s first fab will be up and running in the first half of 2025, leveraging 4 nm (nanometer) technology. According to TrendForce, the other fabs will produce chips on more advanced 3 nm and 2 nm processes.
The Latest Grant Goes to Micron
Micron, the only U.S.-based manufacturer of memory chips, is set to receive $6.1 billion in grants to support its plans of investing $50 billion through 2030. This investment will be used to construct new fabs in Idaho and New York.

-

 Education1 week ago
How Hard Is It to Get Into an Ivy League School?
-

 Technology2 weeks ago
Ranked: Semiconductor Companies by Industry Revenue Share
-

 Markets2 weeks ago
Ranked: The World’s Top Flight Routes, by Revenue
-

 Demographics2 weeks ago
Population Projections: The World’s 6 Largest Countries in 2075
-

 Markets2 weeks ago
The Top 10 States by Real GDP Growth in 2023
-

 Demographics2 weeks ago
The Smallest Gender Wage Gaps in OECD Countries
-

 Economy2 weeks ago
Where U.S. Inflation Hit the Hardest in March 2024
-

 Green2 weeks ago
Top Countries By Forest Growth Since 2001