Technology
The Business of Airbnb, by the Numbers
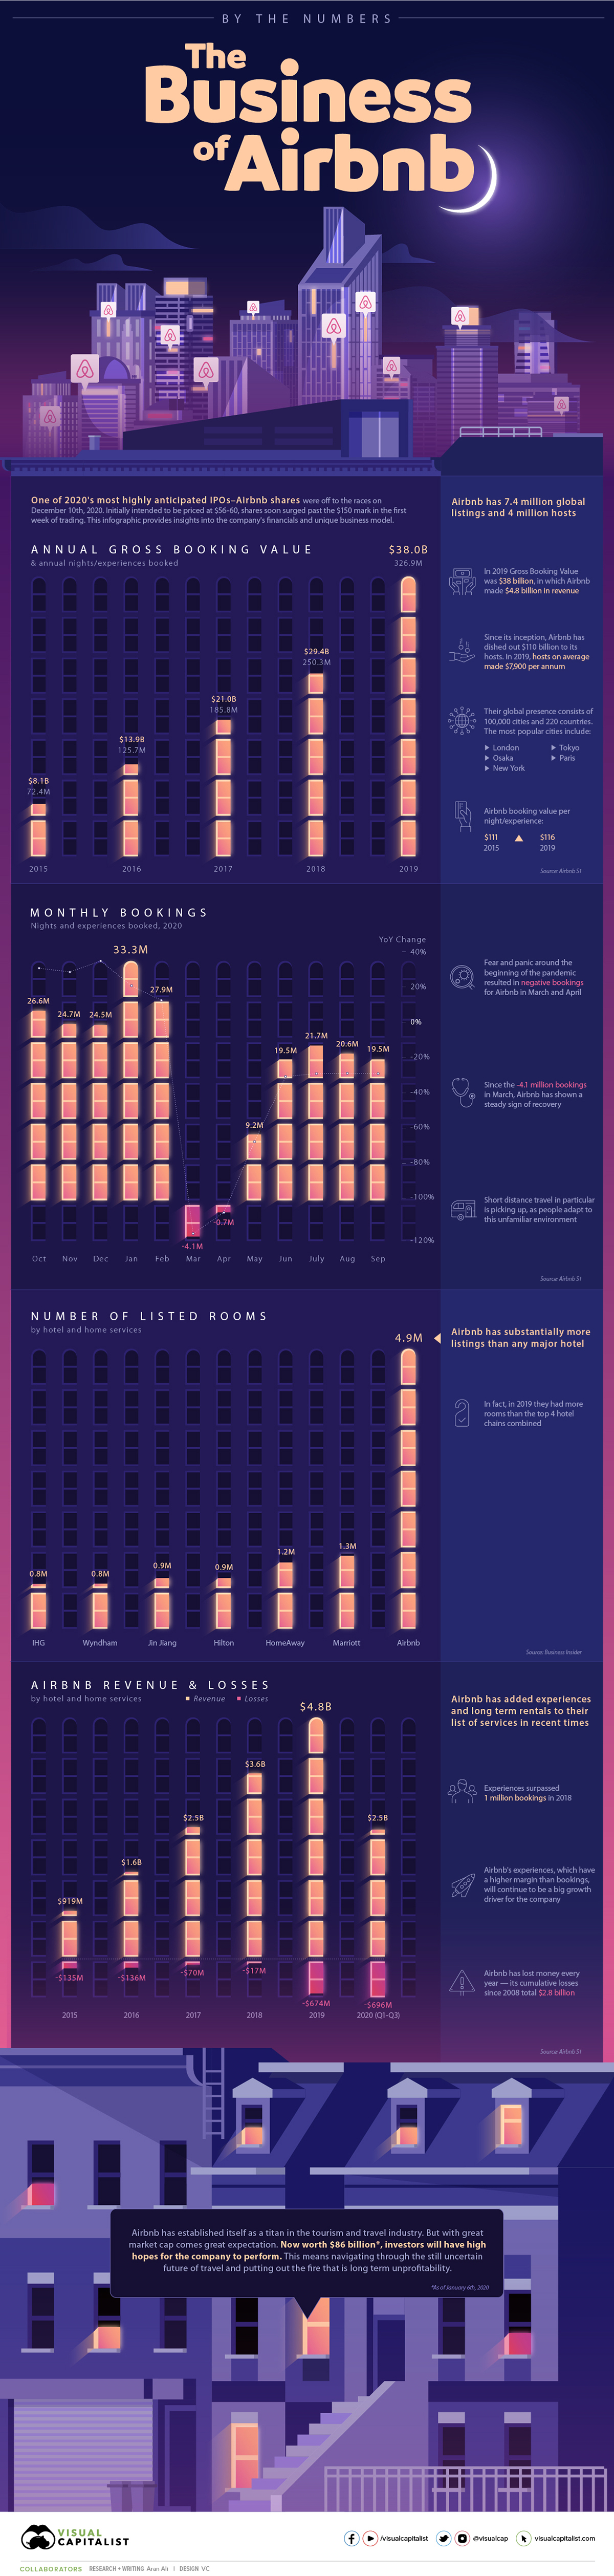
Airbnb was one of the most highly anticipated IPOs of 2020.
After a trading surge, the company’s market cap topped the $100 billion mark. Now that the dust has settled, here are some key numbers behind the company’s unique business model.
The Last 5 Years
Since 2015, Airbnb has had an epic run.
With a market cap of close to $90 billion, they are one of the largest businesses in the travel and tourism space. However, there is still plenty of room to grow: Airbnb identifies their total addressable market (TAM) to be worth $3.4 trillion.
Metric | 2015 | 2016 | 2017 | 2018 | 2019 |
---|---|---|---|---|---|
Gross Booking Value ($ Billions) | $8.1B | $13.9B | $21.0B | $29.4B | $38.0B |
Annual Nights & Experiences Booked (In Millions) | 72.4M | 125.7M | 185.8M | 250.3M | 326.9M |
Revenues ($ Billions) | $919M | $1.6B | $2.5B | $3.6B | $4.8B |
Nights and experiences booked by customers have shot up 4.5x, from 72 million in 2015 to 326 million in 2019. At the same time, the gross dollar value of these bookings has surged from $8.1 billion to $38 billion.
No Shortage Of Space
Airbnb’s ability to scale its services is reflected by its room count, which is unmatched when compared to the hotel industry.
In 2019, Airbnb had nearly 5 million rooms available, a mammoth of a figure considering the next largest was Marriott at 1.3 million. The company is a giant thorn in the hotel industry’s side, and their room count is approximately the size of the five largest hotel chains combined.
A Shortage Of Profits
Despite a global presence and attractive numbers, the business of Airbnb is yet to be profitable.
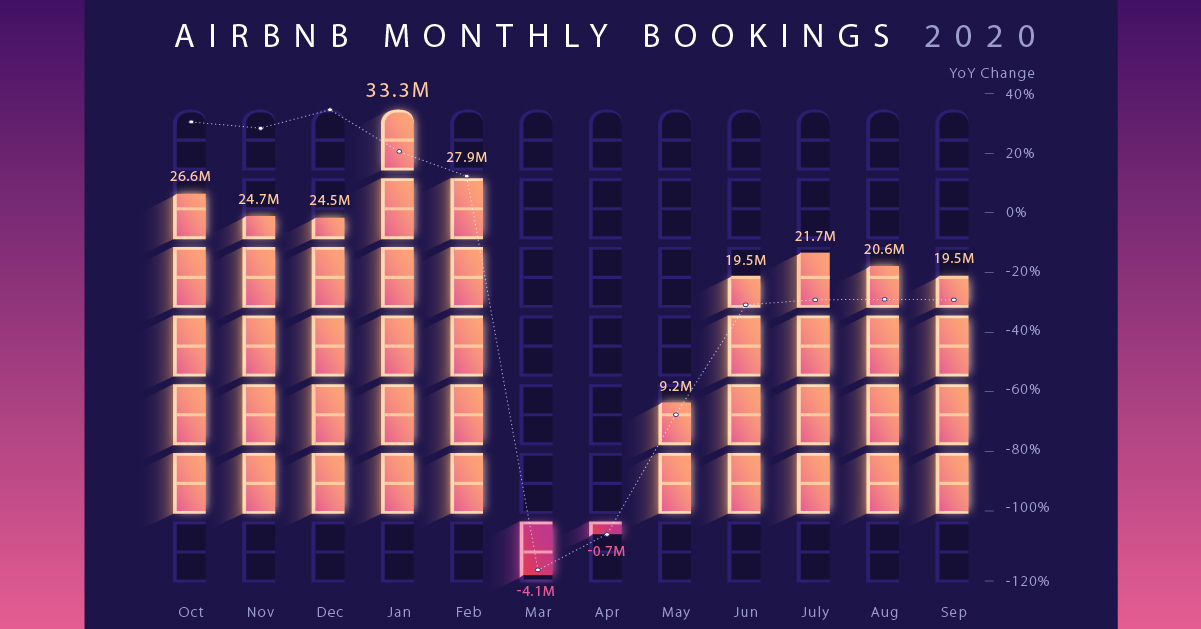
Airbnb has lost money every year—and the company’s cumulative losses total $2.8 billion since 2008. Not surprisingly, those losses have been exacerbated during the pandemic, a common theme for all travel and tourism stocks. Airbnb had -4 million bookings in March, and these negative bookings helped lead to a -32% decline on their top line compared to 2019.
Metric | 2015 | 2016 | 2017 | 2018 | 2019 | 2020 (Q1'-Q3') |
---|---|---|---|---|---|---|
Revenue | $919M | $1.6B | $2.5B | $3.6B | $4.8B | $2.5B |
Net Income | -$135M | -$136M | -$70M | $-17M | -$674M | -$696M |
Airbnb’s net income losses so far in fiscal 2020 (Q1-Q3) are -$696 million, the largest of any year.
Silver Linings
Airbnb has demonstrated an ability to adapt during this time of uncertainty through the introduction of digital experiences. They also made the tough decision to cut 25% of their staff this year.
Monthly bookings and experiences have shown signs of recovery. Since the negative bookings earlier in March, figures have crept back up to the 20 million range, near pre-pandemic levels.
A resilient segment for the business of Airbnb is short-distance travel within 50 miles of guest origin. As the pandemic expanded, people are taking vacations from their abodes by visiting less densely populated neighboring communities.
Another Hot IPO
The Airbnb IPO was one of many headline makers of 2020. When it comes to initial public offerings, markets as of late have shown no shortage of exuberance. Company shares have had the tendency to surge once hitting the secondary market, reflecting investor appetite. The Airbnb IPO experienced just this: initially intending to be priced at $56-$60 a share, in just a few weeks they traded as high as $160 per share.
The Renaissance IPO Index, a returns tracker for U.S. public offerings, reports that IPOs are up roughly 108% in the last calendar year, experiencing one of the best years on record.
But the aftermath of an IPO can just as likely go sour. Public companies are subject to more strenuous regulation relative to the private markets. And with a near $90 billion valuation, future expectations are high for Airbnb. The company will have to woo shareholders in the coming quarters to keep momentum, which likely means showing strides in an uncertain travel and tourism landscape.
Support the Future of Data Storytelling
Sorry to interrupt your reading, but we have a favor to ask. At Visual Capitalist we believe in a world where data can be understood by everyone. That’s why we want to build the VC App - the first app of its kind combining verifiable and transparent data with beautiful, memorable visuals. All available for free.
As a small, independent media company we don’t have the expertise in-house or the funds to build an app like this. So we’re asking our community to help us raise funds on Kickstarter.
If you believe in data-driven storytelling, join the movement and back us on Kickstarter!
Thank you.

Technology
Ranked: The Best-Selling Video Game Consoles of All Time
Video game consoles have changed drastically over the last 50 years. Here are some of the best-selling ones across the globe.

Ranked: The Best-Selling Video Game Consoles of All Time
In 1972, the first-ever commercially available home video game console hit the market—the Magnavox Odyssey. Players of the Odyssey had a choice between two built-in games that were stored directly in the device, and would use a joystick and dials as a controller.
Video game consoles have come a long way since then, and the console market has grown into a multi-billion dollar industry that’s expected to reach $72.67 billion in value by the end of 2022.
This graphic by Enrique Mendoza uses data from VGChartz to show the market leaders in the industry, by highlighting the top-selling video consoles of all time, as of May 8, 2022.
Nine Generations of Video Game Consoles
Before diving into the top-selling consoles, it’s worth taking a step back to touch on the evolution of home consoles to show how they’ve changed over the years.
We dug into the literature on the history of video game consoles, and found that most articles and blog posts on the topic cite nine different generations of devices.
Here’s a breakdown of each generation, and some of their most noteworthy systems:
1972: Gen One, Where it Began
Consoles in the first generation had pre-built games that were stored directly on the device. They include the Magnavox Odyssey and Atari’s Pong.
1976: Gen Two Emerges
In this generation, games were sold separately, rather than programmed into the device. Consoles of this gen include the Fairchild Channel F and the Atari 2600.
1983: Gen Three, the “8-bit Generation”
This era’s consoles typically had 8-bit processes which allowed for more advanced graphics for the time. A few notable consoles during this gen were the Sega SG-1000 and the Nintendo Famicom, released outside Japan as the Nintendo Entertainment System (NES).
1987: Gen Four Elevates Handheld Gaming
Home consoles were released with 16-bit systems, meaning that audio and graphics improved even more in this era. But an arguably bigger moment for this gen was the emergence of the Nintendo Game Boy.
1993: The 3D Start of Gen Five
This generation saw the move away from pixels and towards 3D polygons. Some consoles like the Sony PlayStation started using CD-ROMs instead of cartridges, which stored more data at a cheaper cost and changed the industry.
1998: Gen Six and the Internet
At the start of this generation, the three major players in the console space were Sony, Sega, and Nintendo. By the end, Sega would be replaced with Microsoft as it launched the Xbox and helped popularize online console gaming.
2005: HD Graphics and Motion Controls of Gen Seven
On one side of the market, Microsoft and Sony were competing with high-definition graphics, faster processers, and different forms (Blu-rays or DVDs). But Nintendo’s motion-sensing Nintendo Wii arguably defined this generation, and the handheld Nintendo DS swept the market as well.
2012: Gen Eight’s Modern Consoles
Consoles of this era started having increased connectivity and processing power, with full HD an expectation. It was also an extremely long generation, starting with Nintendo’s unsuccessful Wii U and ending with the ultra-successful Nintendo Switch, widely considered the first hybrid console with three different ways to play: TV mode, handheld mode, or tabletop mode.
2020: Gen Nine and Beyond
So far, this generation has brought upgraded graphics (up to 8K resolution), larger games, and game-streaming capabilities. Devices in this gen include the Xbox Series X/S and PlayStation 5, which both use solid state drives to increase speed and performance, while Nintendo has yet to introduce a 9th generation device.
The Best-Selling Game Consoles
The best-selling video game console of all time is Sony’s PlayStation 2 (PS2). More than 157 million systems have been sold around the world since its launch in March 2000.
Rank | Console | Manufacturer | Global lifetime sales (millions) |
---|---|---|---|
1 | PlayStation 2 (PS2) | Sony | 157.68 |
2 | Nintendo DS (DS) | Nintendo | 154.90 |
3 | Game Boy (GB) | Nintendo | 118.69 |
4 | PlayStation 4 (PS4) | Sony | 116.97 |
5 | Nintendo Switch (NS) | Nintendo | 107.21 |
6 | PlayStation (PS) | Sony | 102.50 |
7 | Nintendo Wii (Wii) | Nintendo | 101.64 |
8 | PlayStation 3 (PS3) | Sony | 87.41 |
9 | Xbox 360 (X360) | Microsoft | 85.8 |
10 | Game Boy Advance (GBA) | Nintendo | 81.51 |
11 | PlayStation Portable (PSP) | Sony | 81.09 |
12 | Nintendo 3DS (3DS) | Nintendo | 75.95 |
13 | Nintendo Entertainment System (NES) | Nintendo | 61.91 |
14 | Xbox One (XOne) | Microsoft | 50.57 |
15 | Super Nintendo Entertainment System (SNES) | Nintendo | 49.10 |
16 | Nintendo 64 (N64) | Nintendo | 32.93 |
17 | Sega Genesis (GEN) | Sega | 29.54 |
18 | Atari 2600 (2600) | Atari | 27.64 |
19 | Xbox (XB) | Microsoft | 24.65 |
20 | GameCube (GC) | Nintendo | 21.74 |
21 | PlayStation 5 (PS5) | Sony | 19.32 |
22 | PlayStation Vita (PSV) | Sony | 16.21 |
23 | Xbox Series X/S (XS) | Microsoft | 14.32 |
24 | Nintendo Wii U (WiiU) | Nintendo | 13.97 |
25 | GameGear (GG) | Sega | 10.62 |
26 | Sega Saturn (SAT) | Sega | 8.82 |
27 | Dreamcast (DC) | Sega | 8.20 |
28 | Atari 7800 (7800) | Atari | 4.30 |
Despite the fact the PS2’s been discontinued since 2013, no other gaming console has managed to top it—in fact, the next closest actively-sold consoles, the PS4 and Nintendo Switch, are each more than 40 million units behind.
One major factor for the PS2’s success was its built-in DVD player. At the time, DVD players were very expensive, and in many places a PS2 was a cheaper and effective alternative. It was also one of the first devices to be “backward compatible,” meaning users could play most of their PS1 games on the PS2. This meant players didn’t have to buy a whole new library of games when they made the switch to a PS2, and Sony could tap into its existing customer base.
But while Sony’s PS2 is the top-selling console on the list, Nintendo has more top-selling consoles on the list—almost half of the consoles on the list are manufactured by Nintendo (11), while only seven are made by Sony.
What Will it Take to Out-Sell the PS2?
As the PS4 has started taking a backseat to the PS5 in sales and promotion, the current most-likely contender for the best-selling console crown is the Nintendo Switch. Early in 2022, it was the fastest console to sell 100 million units.
With lots of hype around the possibilities of AR and VR, it’ll be interesting to see what new features come with the next generation of gaming consoles.
Will future devices ever beat the PS2’s record-breaking sales? Time will tell. But for now, the 22-year-old console continues to hold its well-earned spot at the top.
Technology
Visualizing The 50 Biggest Data Breaches From 2004–2021
In 2021, more than 5.9 billion user records were stolen. This graphic visualizes the 50 largest data breaches, by entity and sector, since 2004.

Visualizing The 50 Biggest Data Breaches From 2004–2021
As our world has become increasingly reliant on technology and data stored online, data breaches have become an omnipresent threat to users, businesses, and government agencies. In 2021, a new record was set with more than 5.9 billion user records stolen.
This graphic by Chimdi Nwosu visualizes the 50 largest data breaches since 2004, along with the sectors most impacted. Data was aggregated from company statements and news reports.
Understanding the Basics of Data Breaches
A data breach is an incident in which sensitive or confidential information is copied, transmitted or stolen by an unauthorized entity. This can occur as a result of malware attacks, payment card fraud, insider leaks, or unintended disclosure.
The targeted data is often customer PII (personally identifiable information), employee PII, intellectual property, corporate data or government agency data.
Date breaches can be perpetrated by lone hackers, organized cybercrime groups, or even national governments. Stolen information can then be used in other criminal enterprises such as identity theft, credit card fraud, or held for ransom payment.
Notable Data Breaches Since 2004
The largest data breach recorded occurred in 2013 when all three billion Yahoo accounts had their information compromised. In that cyberattack, the hackers were able to gather the personal information and passwords of users. While the full extent of the Yahoo data breach is still not fully realized, subsequent cybercrimes across the globe have been linked to the stolen information.
Here are the 50 largest data breaches by amount of user records stolen from 2004–2021.
Rank | Entity | Sector | Records Compromised | Year |
---|---|---|---|---|
1 | Yahoo | Web | 3.0B | 2013 |
2 | River City Media | Web | 1.4B | 2017 |
3 | Aadhaar | Government | 1.1B | 2018 |
4 | First American Corporation | Finance | 885M | 2019 |
5 | Spambot | Web | 711M | 2017 |
6 | Web | 700M | 2021 | |
7 | Tech | 533M | 2021 | |
8 | Yahoo | Web | 500M | 2014 |
9 | Marriott International | Retail | 500M | 2018 |
10 | Syniverse | Telecoms | 500M | 2021 |
11 | Web | 419M | 2019 | |
12 | Friend Finder Network | Web | 412M | 2016 |
13 | OxyData | Tech | 380M | 2019 |
14 | MySpace | Web | 360M | 2016 |
15 | Exactis | Data | 340M | 2018 |
16 | Tech | 330M | 2018 | |
17 | Airtel | Telecoms | 320M | 2019 |
18 | Indian citizens | Web | 275M | 2019 |
19 | Wattpad | Web | 270M | 2020 |
20 | Microsoft | Web | 250M | 2019 |
21 | Experian Brazil | Finance | 220M | 2021 |
22 | Chinese resume leak | Web | 202M | 2019 |
23 | Court Ventures | Finance | 200M | 2013 |
24 | Apollo | Tech | 200M | 2018 |
25 | Deep Root Analytics | Web | 198M | 2015 |
26 | Zynga | Gaming | 173M | 2019 |
27 | VK | Web | 171M | 2016 |
28 | Equifax | Finance | 163M | 2017 |
29 | Dubsmash | Web | 162M | 2019 |
30 | Massive American business hack | Finance | 160M | 2013 |
31 | MyFitnessPal | App | 150M | 2018 |
32 | Ebay | Web | 145M | 2014 |
33 | Canva | Web | 139M | 2019 |
34 | Heartland | Finance | 130M | 2009 |
35 | Nametests | App | 120M | 2018 |
36 | Tetrad | Finance | 120M | 2020 |
37 | Web | 117M | 2016 | |
38 | Pakistani mobile operators | Telecoms | 115M | 2020 |
39 | ElasticSearch | Tech | 108M | 2019 |
40 | Capital One | Finance | 106M | 2019 |
41 | Thailand visitors | Government | 106M | 2021 |
42 | Firebase | App | 100M | 2018 |
43 | Quora | Web | 100M | 2018 |
44 | Rambler.ru | Web | 98M | 2012 |
45 | TK / TJ Maxx | Retail | 94M | 2007 |
46 | MyHeritage | Web | 92M | 2018 |
47 | AOL | Web | 92M | 2004 |
48 | Dailymotion | Web | 85M | 2016 |
49 | Anthem | Health | 80M | 2015 |
50 | Sony Playstation Network | Gaming | 77M | 2011 |
The massive Yahoo hack accounted for roughly 30% of the 9.9 billion user records stolen from the Web sector—by far the most impacted sector. The next most-impacted sectors were Tech and Finance, with 2 billion and 1.6 billion records stolen, respectively.
Although these three sectors had the highest totals of user data lost, that doesn’t necessarily imply they have weaker security measures. Instead, it can probably be attributed to the sheer number of user records they compile.
Not all infamous data breaches are of a large scale. A smaller data breach in 2014 made headlines when Apple’s iCloud was hacked and the personal pictures of roughly 200 celebrities were disseminated across the internet. Although this highly targeted hack only affected a few hundred people, it highlighted how invasive and damaging data breaches can be to users.
The Cost of Data Breaches to Businesses
Every year data breaches cost businesses billions of dollars to prevent and contain, while also eroding consumer trust and potentially having an adverse effect on customer retention.
A 2021 IBM security report estimated that the average cost per data breach for companies in 2020 was $4.2 million, which represents a 10% increase from 2019. That increase is mainly attributed to the added security risk associated with having more people working remotely due to the COVID-19 pandemic.
Measures to Improve Data Security
Completely preventing data breaches is essentially impossible, as cybercrime enterprises are often persistent, dynamic, and sophisticated. Nevertheless, businesses can seek out innovative methods to prevent exposure of data and mitigate potential damages.
For example, after the iCloud attack in 2014, Apple began avidly encouraging users to adopt two-factor authentication in an effort to strengthen data security.
Regardless of the measures businesses take, the unfortunate reality is that data breaches are a cost of doing business in the modern world and will continue to be a concern to both companies and users.
-
Money2 weeks ago
Mapping the Migration of the World’s Millionaires
-
Markets2 weeks ago
Visualizing the Coming Shift in Global Economic Power (2006-2036p)
-
Datastream3 weeks ago
Ranked: These Are 10 of the World’s Least Affordable Housing Markets
-
Demographics1 week ago
Mapped: A Decade of Population Growth and Decline in U.S. Counties
-
Misc3 weeks ago
Visualizing Well-Known Airlines by Fleet Composition
-
Politics4 weeks ago
Which Countries Trust Their Government, and Which Ones Don’t?
-
Markets4 weeks ago
Ranked: Visualizing the Largest Trading Partners of the U.S.
-
Misc1 week ago
Iconic Infographic Map Compares the World’s Mountains and Rivers