Technology
By the Numbers: Are Tech IPOs Worth the Hype?
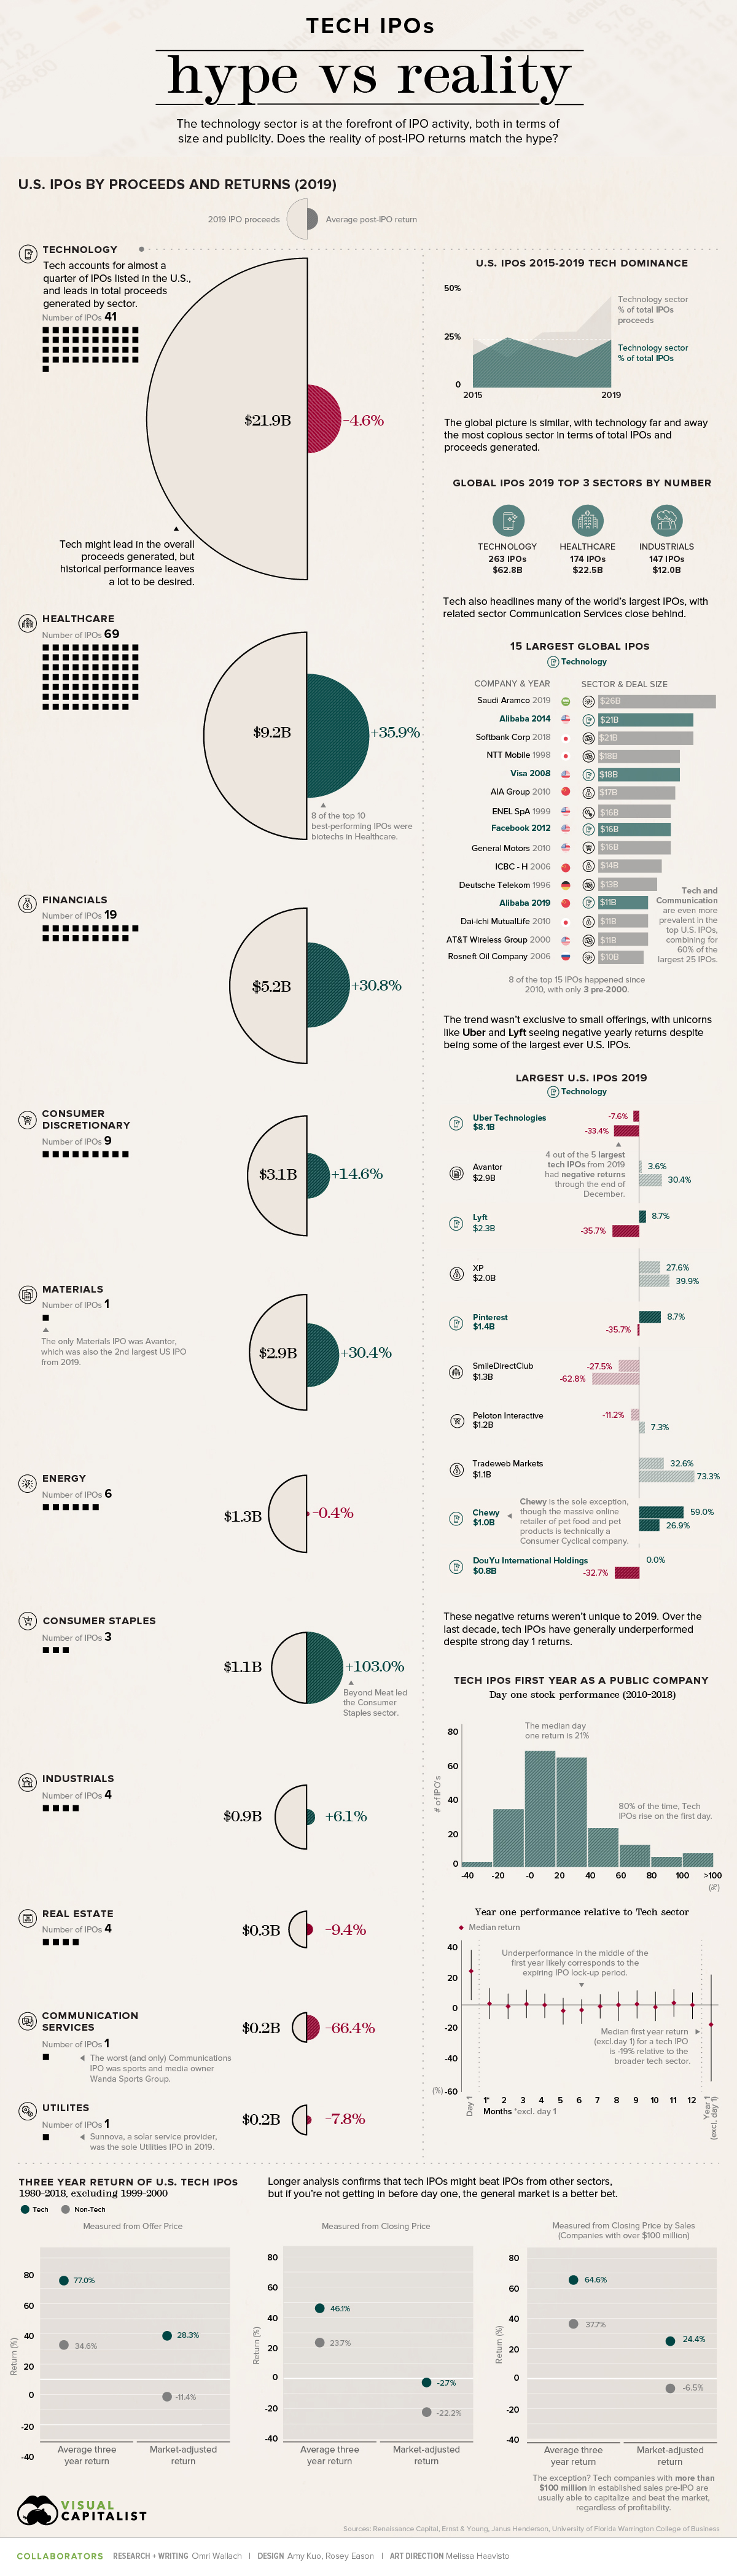


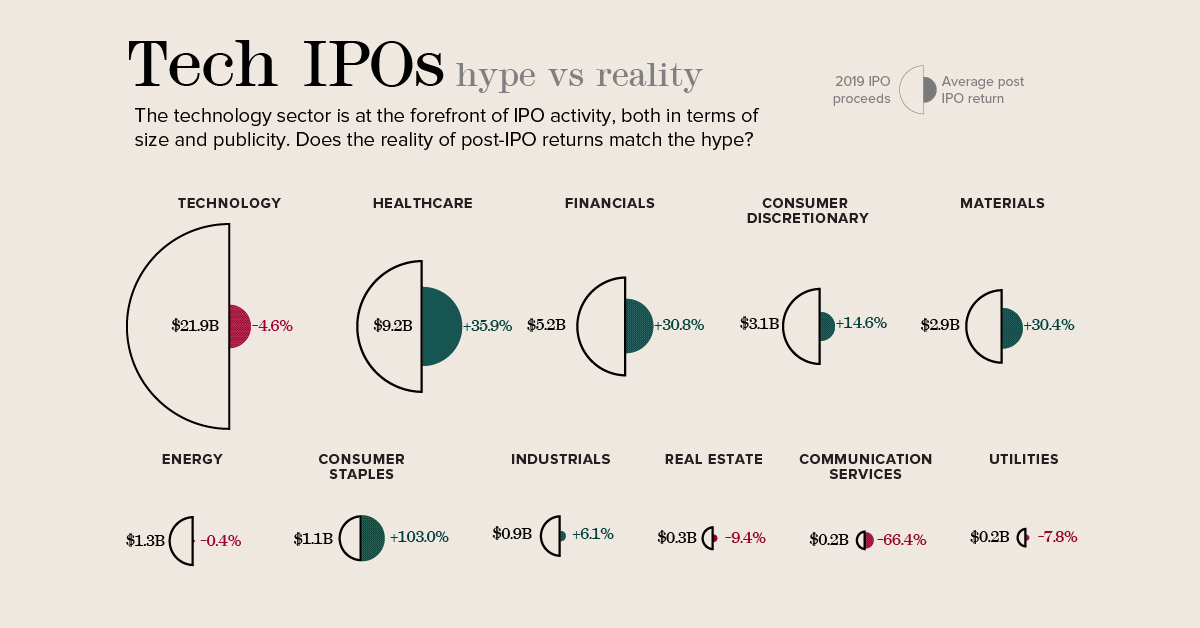
Tech IPOs — Hype vs. Reality
Initial Public Offerings (IPOs) generate massive amounts of attention from investors and media alike, especially for new and fast-rising companies in the technology sector.
On the surface, the attention is warranted. Some of the most well-known tech companies have built their profile by going public, including Facebook by raising $16 billion in 2012.
But when you peel away the hype and examine investor returns from tech IPOs more closely, the reality can leave a lot to be desired.
The Hype in Numbers
When it comes to the IPOs of companies beginning to sell shares on public stock exchanges, tech offerings have become synonymous with billion-dollar launches.
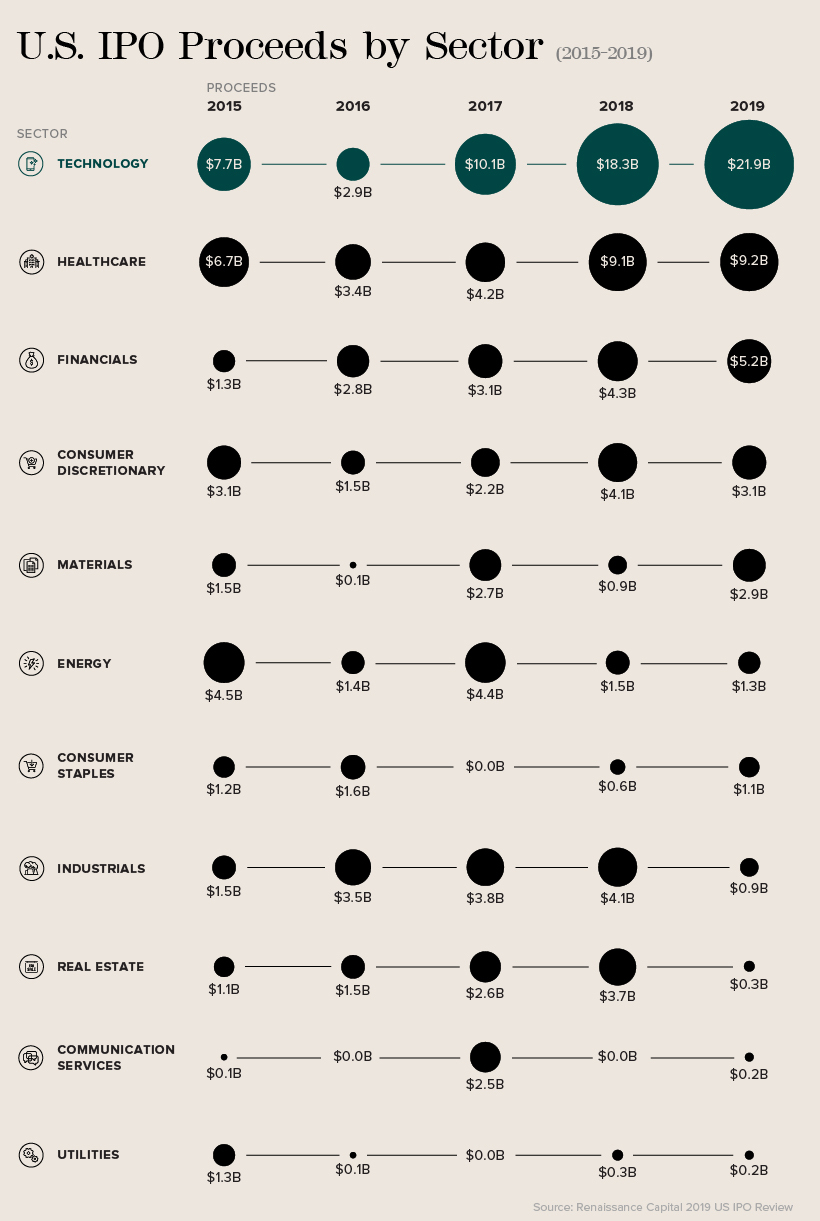
Given the sheer magnitude of IPOs based in the technology sector, it’s easy to understand why. Globally, the technology sector has regularly generated the most IPOs and highest proceeds, as shown in a recent report by Ernst & Young.
In 2019 alone, the world’s public markets saw 263 IPOs in the tech sector with total proceeds of $62.8 billion. That’s far ahead of the second-place healthcare sector, which saw 174 IPOs generate proceeds of $22.5 billion.
The discrepancy is more apparent in the U.S., according to data from Renaissance Capital. In fact, over the last five years, the tech sector has accounted for 23% of total U.S. IPOs and 34% of proceeds generated by U.S. IPOs.
The prevalence of tech is even more apparent when examining history’s largest IPOs. Of the 25 largest IPOs in U.S. history, 60% come from the technology and communication services sectors.
That list includes last year’s well-publicized IPOs for Uber ($8.1 billion) and Lyft ($2.3 billion), as well as a direct public offering from Slack ($7.4 billion). Soon the list might include Airbnb, which plans to list within the communication services sector instead of tech.
The Reality in Returns
But the proof, as they say, is in the pudding.
Uber and Lyft were two of 2019’s largest U.S. IPOs, but they also saw some of the poorest returns. Uber fell 33.4% from its IPO price at year end, while Lyft was down 35.7%.
And they were far from isolated incidents. Tech IPOs averaged a return of -4.6% last year, far behind the top sectors of consumer staples (led by Beyond Meat) and healthcare.
| Sector | Avg. IPO Return (2019) |
|---|---|
| Consumer Staples | 103.0% |
| Healthcare | 35.9% |
| Financials | 30.8% |
| Materials | 30.4% |
| Consumer Discretionary | 14.6% |
| Industrials | 6.1% |
| Energy | -0.4% |
| Technology | -4.6% |
| Utilities | -7.8% |
| Real Estate | -9.4% |
| Communication Services | -66.4% |
While last year was the first time tech IPOs have averaged a negative return in four years, analysis of the last 10 years confirms that tech IPOs have underperformed over the last decade.
A decade-long analysis from investment firm Janus Henderson demonstrated that U.S. tech IPOs start underperforming compared to the broad tech sector about 5-6 months after launching.
This dip likely corresponds to the expiry of an IPO’s lock-up period—the time that a company’s pre-IPO investors are able to sell their stock. By cashing in on strong early performance, investors flood the market and bring share prices down.
Interestingly, most gains for these IPOs tend to happen within the first day of trading. The median first-day performance for tech IPOs was a 21% increase over the offer price. That’s why the median first-year return for a tech IPO, excluding the first day of trading, is -19% when compared with the broader tech sector.
How to Make Money from Tech IPOs
So does that mean that investors should avoid tech IPOs? Not necessarily.
Longer-term analysis from the University of Florida’s Warrington College of Business shows that U.S. tech IPOs offer better returns than other sectors as long as investors get in at the offer price.
U.S. Tech IPO Returns from Offer Price
| Sector | Avg. Three-Year Return | Market-adjusted Return |
|---|---|---|
| Tech | 77.0% | 28.3% |
| Non-Tech | 34.6% | -11.4% |
Even when adjusting for the broader market performance, tech IPOs have been solid in comparison to the offer price.
The challenge is that if investors are buying stock after that first day market bump, they may have already missed out on meaningful gains:
U.S. Tech IPO Returns from First Closing Price
| Sector | Avg. Three-Year Return | Market-adjusted Return |
|---|---|---|
| Tech | 46.1% | -2.7% |
| Non-Tech | 23.7% | -22.2% |
So should investors shy away from tech IPOs unless they’re able to get in early?
Generally speaking, the analysis holds that new tech companies perform relatively well, but not better than the broader market once they’ve started trading.
However, in a world of billion-dollar unicorns, there are always exceptions to the rule. The University of Florida study found that tech companies with a base of over $100 million in sales before going public saw a market-adjusted three-year return of 24.4% from the first closing price.
If you can sift through the hype and properly analyze the right tech IPO to support, the reality can be rewarding.


Technology
All of the Grants Given by the U.S. CHIPS Act
Intel, TSMC, and more have received billions in subsidies from the U.S. CHIPS Act in 2024.


All of the Grants Given by the U.S. CHIPS Act
This was originally posted on our Voronoi app. Download the app for free on iOS or Android and discover incredible data-driven charts from a variety of trusted sources.
This visualization shows which companies are receiving grants from the U.S. CHIPS Act, as of April 25, 2024. The CHIPS Act is a federal statute signed into law by President Joe Biden that authorizes $280 billion in new funding to boost domestic research and manufacturing of semiconductors.
The grant amounts visualized in this graphic are intended to accelerate the production of semiconductor fabrication plants (fabs) across the United States.
Data and Company Highlights
The figures we used to create this graphic were collected from a variety of public news sources. The Semiconductor Industry Association (SIA) also maintains a tracker for CHIPS Act recipients, though at the time of writing it does not have the latest details for Micron.
| Company | Federal Grant Amount | Anticipated Investment From Company |
|---|---|---|
| 🇺🇸 Intel | $8,500,000,000 | $100,000,000,000 |
| 🇹🇼 TSMC | $6,600,000,000 | $65,000,000,000 |
| 🇰🇷 Samsung | $6,400,000,000 | $45,000,000,000 |
| 🇺🇸 Micron | $6,100,000,000 | $50,000,000,000 |
| 🇺🇸 GlobalFoundries | $1,500,000,000 | $12,000,000,000 |
| 🇺🇸 Microchip | $162,000,000 | N/A |
| 🇬🇧 BAE Systems | $35,000,000 | N/A |
BAE Systems was not included in the graphic due to size limitations
Intel’s Massive Plans
Intel is receiving the largest share of the pie, with $8.5 billion in grants (plus an additional $11 billion in government loans). This grant accounts for 22% of the CHIPS Act’s total subsidies for chip production.
From Intel’s side, the company is expected to invest $100 billion to construct new fabs in Arizona and Ohio, while modernizing and/or expanding existing fabs in Oregon and New Mexico. Intel could also claim another $25 billion in credits through the U.S. Treasury Department’s Investment Tax Credit.
TSMC Expands its U.S. Presence
TSMC, the world’s largest semiconductor foundry company, is receiving a hefty $6.6 billion to construct a new chip plant with three fabs in Arizona. The Taiwanese chipmaker is expected to invest $65 billion into the project.
The plant’s first fab will be up and running in the first half of 2025, leveraging 4 nm (nanometer) technology. According to TrendForce, the other fabs will produce chips on more advanced 3 nm and 2 nm processes.
The Latest Grant Goes to Micron
Micron, the only U.S.-based manufacturer of memory chips, is set to receive $6.1 billion in grants to support its plans of investing $50 billion through 2030. This investment will be used to construct new fabs in Idaho and New York.

-

 Brands6 days ago
How Tech Logos Have Evolved Over Time
-

 Demographics2 weeks ago
The Smallest Gender Wage Gaps in OECD Countries
-

 Economy2 weeks ago
Where U.S. Inflation Hit the Hardest in March 2024
-

 Green2 weeks ago
Top Countries By Forest Growth Since 2001
-

 United States2 weeks ago
Ranked: The Largest U.S. Corporations by Number of Employees
-

 Maps2 weeks ago
The Largest Earthquakes in the New York Area (1970-2024)
-

 Green2 weeks ago
Ranked: The Countries With the Most Air Pollution in 2023
-

 Green2 weeks ago
Ranking the Top 15 Countries by Carbon Tax Revenue