

Companies benefitting from the AI train and strong retail demand helped their individual S&P 500 sector performance in 2023.
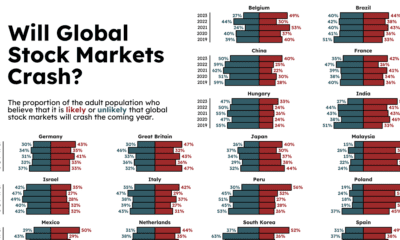

How likely are the stock markets to crash in 2023, according to different countries? And how have those predictions changed over time?


This infographic analyzes over 30 years of stock market performance to identify the best and worst months for gains.
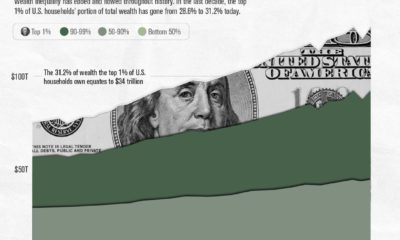

Over the past decade, the top 1% of U.S. households' portion of wealth has gone from 28.6% to 31.2%.
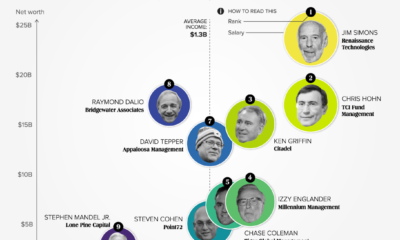

Hedge fund managers are often seen as the titans of Wall Street. Who are the top 10 hedge fund managers by earnings?
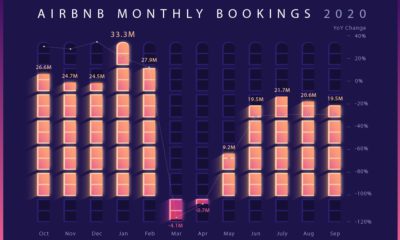

From rooms to revenue, this infographic breaks down the numbers behind the business of Airbnb—one of the most successful IPOs of 2020.
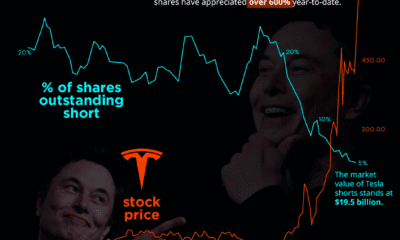

Tesla has gained infamy for the sheer depth of short seller activity on its stock. After years of 20% of shares short, the 2020 rally has...
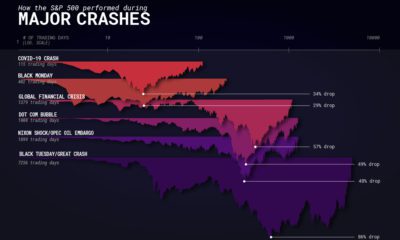

How does the COVID-19 market crash compare to previous financial crises? We navigate different contextual factors impacting crashes.
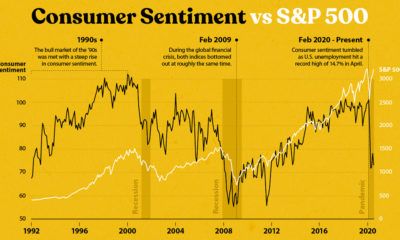

Consumer sentiment has dropped significantly since the emergence of COVID-19, but why haven't stock markets seemed to notice?
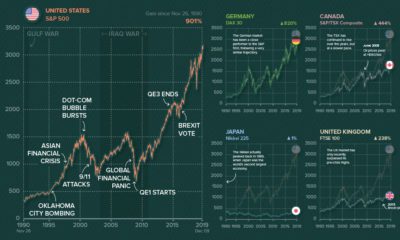

Ever wonder what other major stock markets would look like, if they were on the same scale of the S&P 500? We chart them all over...


 Creator Program