Environment
A Global Breakdown of Greenhouse Gas Emissions by Sector
A Global Breakdown of Greenhouse Gas Emissions by Sector
In a few decades, greenhouse gases (GHGs)—chiefly in the form of CO₂ emissions—have risen at unprecedented rates as a result of global growth and resource consumption.
To uncover the major sectors where these emissions originate, this graphic from Our World in Data pulls the latest data from 2016 courtesy of Climate Watch and the World Resources Institute, when total emissions reached 49.4 billion tonnes of CO₂ equivalents (CO₂e).
Sources of GHG Emissions
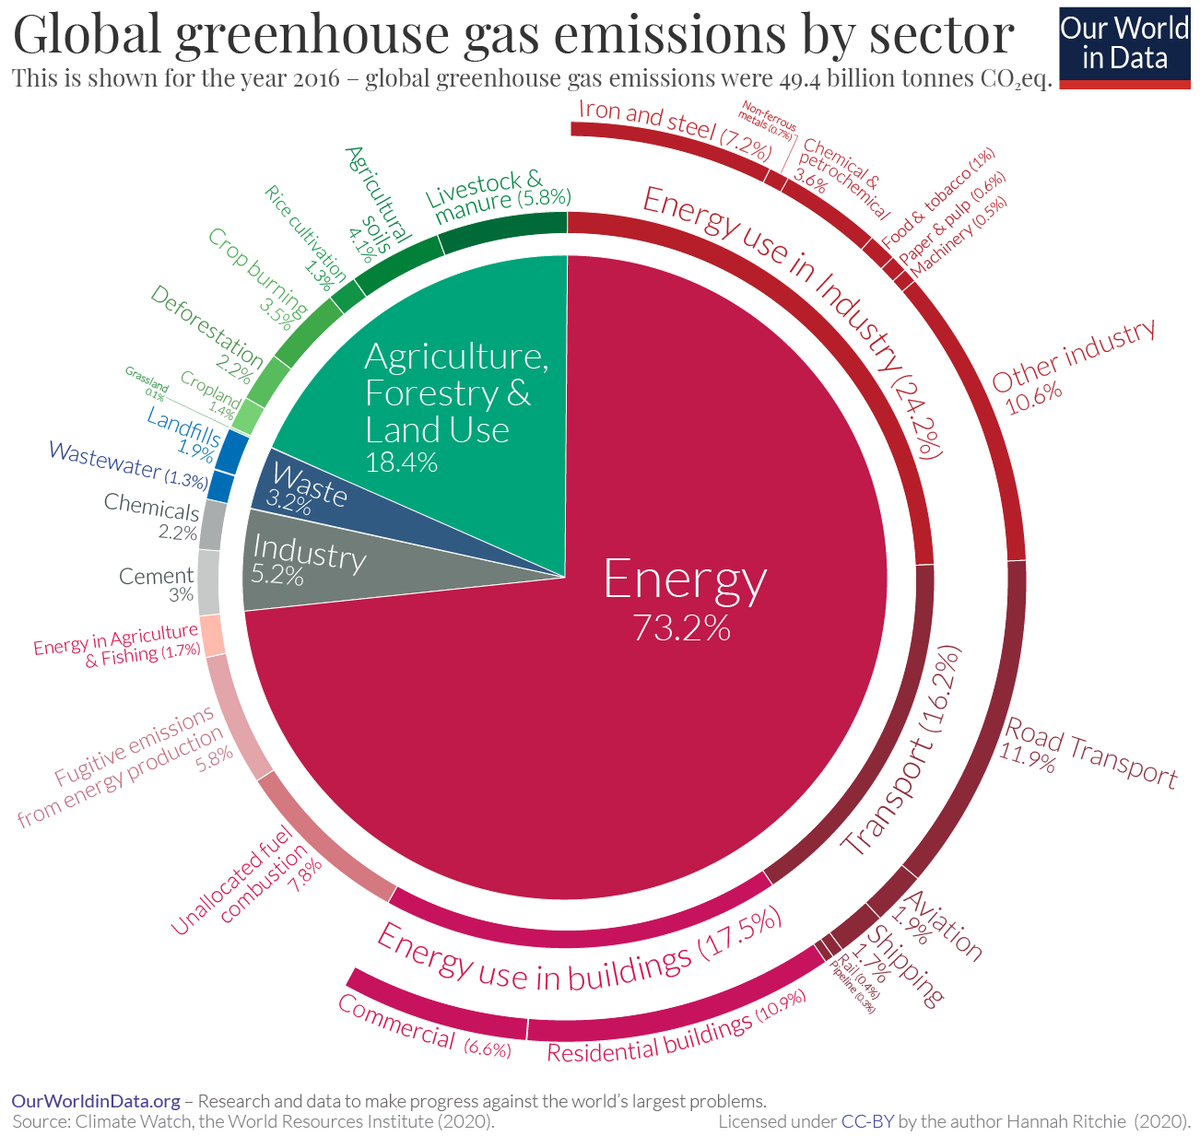
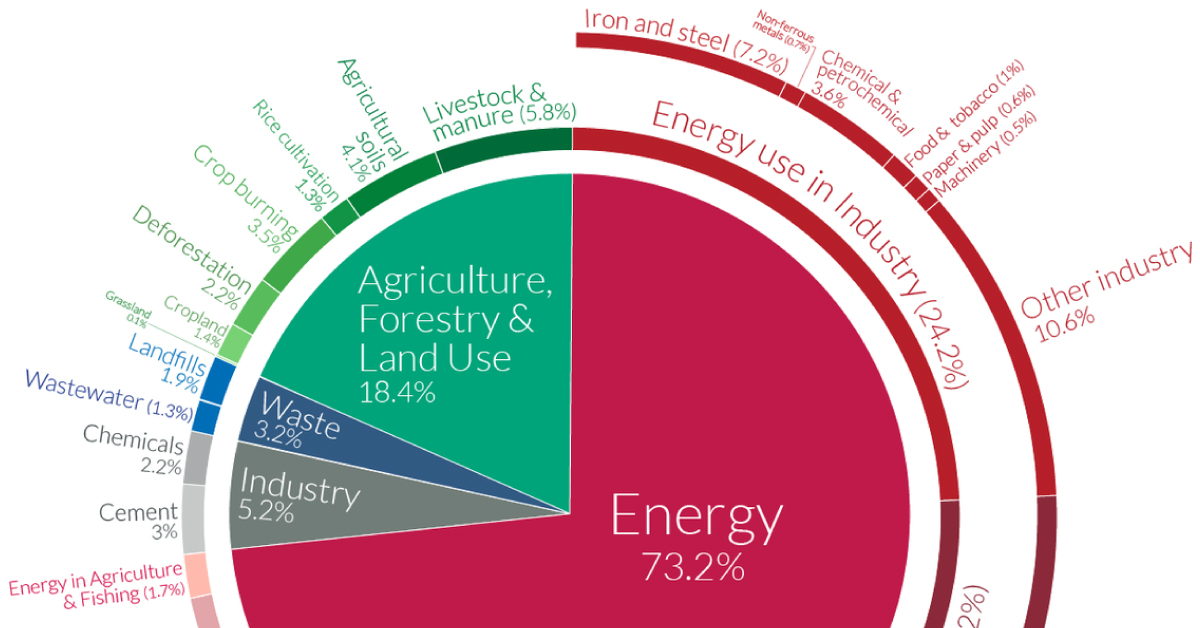
Global GHG emissions can be roughly traced back to four broad categories: energy, agriculture, industry, and waste. Overwhelmingly, almost three-quarters of GHG emissions come from our energy consumption.
| Sector | Global GHG Emissions Share |
|---|---|
| Energy Use | 73.2% |
| Agriculture, Forestry & Land Use | 18.4% |
| Industrial processes | 5.2% |
| Waste | 3.2% |
Within each category, there are even more granular breakdowns to consider. We’ll take a closer look at the top two, which collectively account for over 91% of global GHG emissions.
Energy Use
Within this broad category, we can further break things down into sub-categories like transport, buildings, and industry-related energy consumption, to name a few.
| Sub-sector | GHG Emissions Share | Further breakdown |
|---|---|---|
| Transport | 16.2% | • Road 11.9% • Aviation 1.9% • Rail 0.4% • Pipeline 0.3% • Ship 1.7% |
| Buildings | 17.5% | • Residential 10.9% • Commercial 6.6% |
| Industry energy | 24.2% | • Iron & Steel 7.2% • Non-ferrous metals 0.7% • Machinery 0.5% • Food and tobacco 1.0% • Paper, pulp & printing 0.6% • Chemical & petrochemical (energy) 3.6% • Other industry 10.6% |
| Agriculture & Fishing energy | 1.7% | - |
| Unallocated fuel combustion | 7.8% | - |
| Fugitive emissions from energy production | 5.8% | • Coal 1.9% • Oil & Natural Gas 3.9% |
| Total | 73.2% |
Billions of people rely on petrol and diesel-powered vehicles to get around. As a result, they contribute to almost 12% of global emissions.
But this challenge is also an opportunity: the consumer adoption of electric vehicles (EVs) could significantly help shift the world away from fossil fuel use, both for passenger travel and for freight—although there are still speedbumps to overcome.
Meanwhile, buildings contribute 17.5% of energy-related emissions overall—which makes sense when you realize the stunning fact that cities use 60-80% of the world’s annual energy needs. With megacities (home to 10+ million people) ballooning every day to house the growing urban population, these shares may rise even further.
Agriculture, Forestry & Land Use
The second biggest category of emissions is the sector that we rely on daily for the food we eat.
Perhaps unsurprisingly, methane from cows and other livestock contribute the most to emissions, at 5.8% total. These foods also have some of the highest carbon footprints, from farm to table.
| Sub-sector | GHG Emissions Share |
|---|---|
| Livestock & Manure | 5.8% |
| Agricultural Soils | 4.1% |
| Crop Burning | 3.5% |
| Forest Land | 2.2% |
| Cropland | 1.4% |
| Rice Cultivation | 1.3% |
| Grassland | 0.1% |
| Total | 18.4% |
Another important consideration is just how much land our overall farming requirements take up. When significant areas of forest are cleared for grazing and cropland, there’s a clear link between our land use and rising global emissions.
Although many of these energy systems are still status quo, the global energy mix is ripe for change. As the data shows, the potential points of disruption have become increasingly clear as the world moves towards a green energy revolution.
For a different view on global emissions data, see which countries generate the most CO₂ emissions per capita.


Green
Ranked: Top Countries by Total Forest Loss Since 2001
The country with the most forest loss since 2001 lost as much forest cover as the next four countries combined.
Ranked: Top Countries By Total Forest Loss Since 2001
This was originally posted on our Voronoi app. Download the app for free on iOS or Android and discover incredible data-driven charts from a variety of trusted sources.
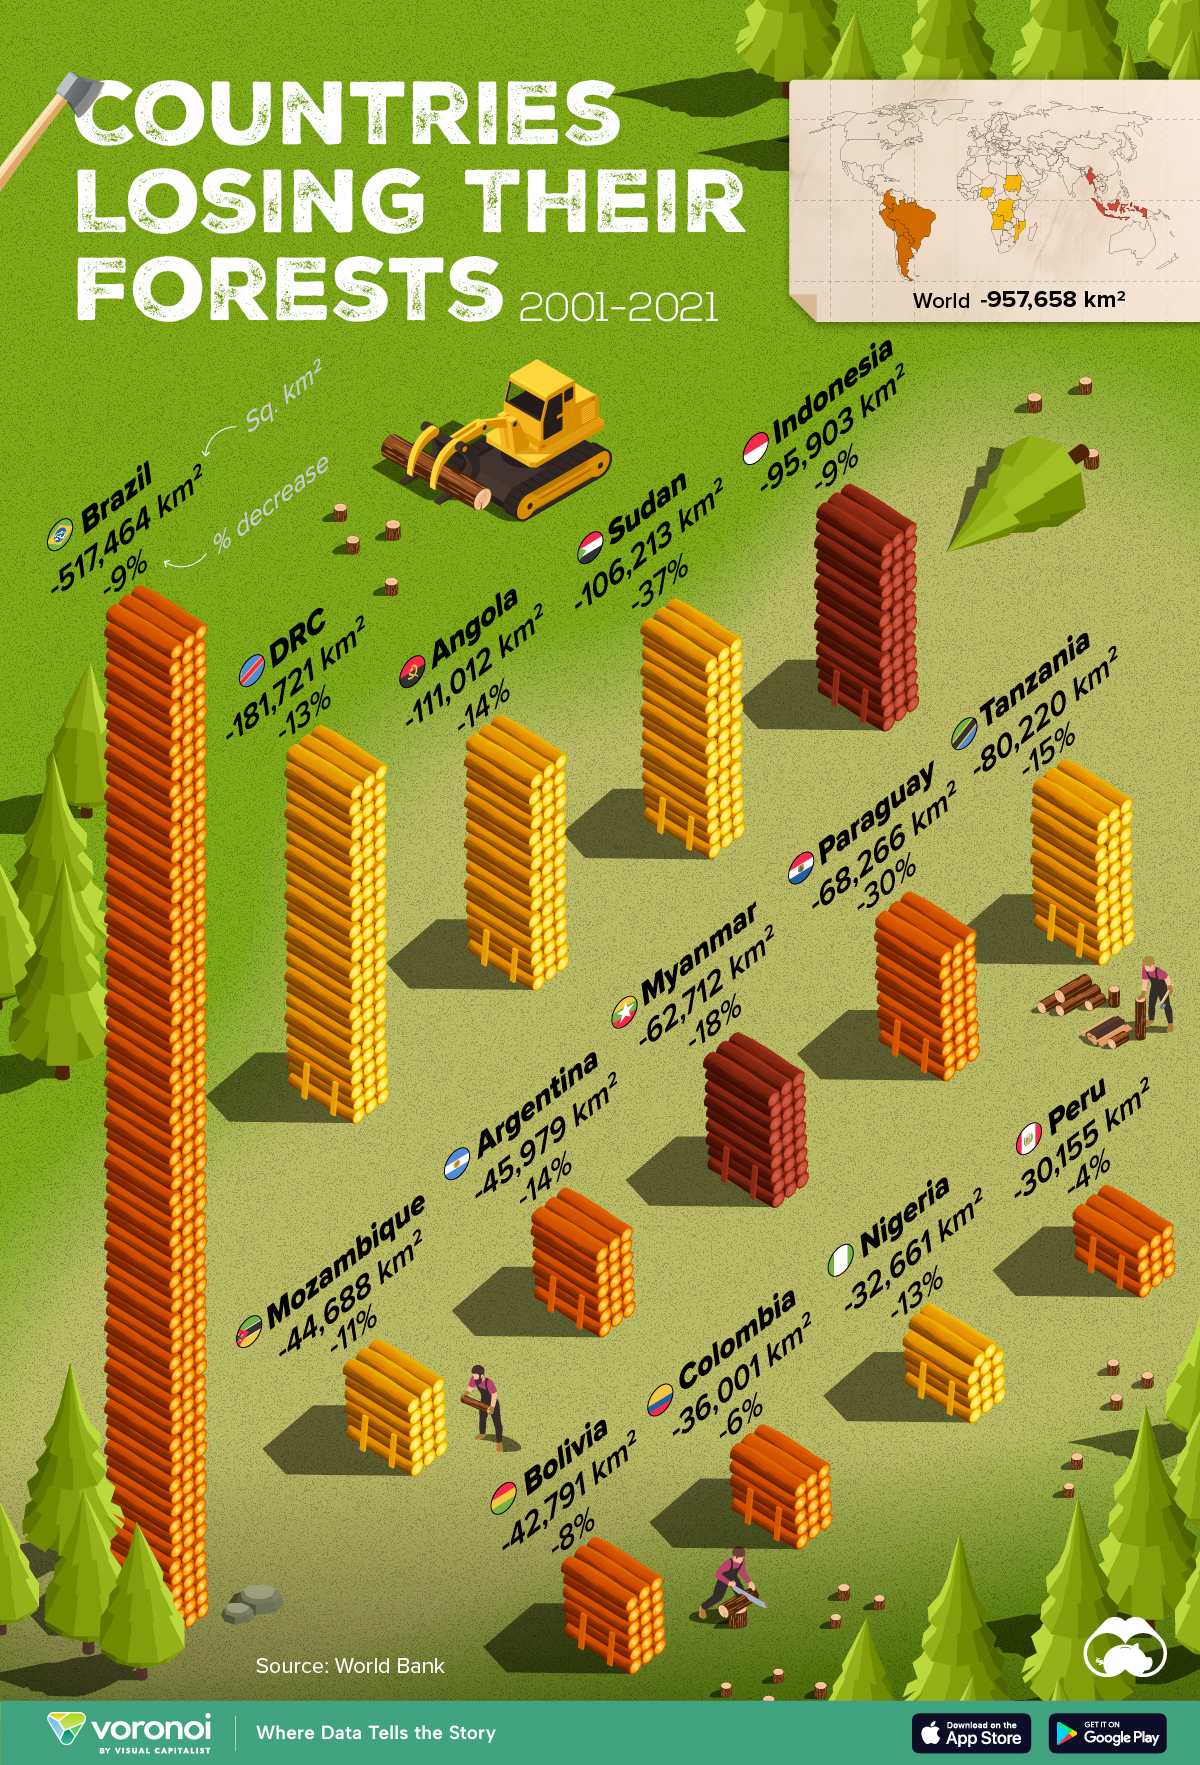
Forests are critical natural resources, often caught in the crosshairs of economic development. Thanks to expanding human settlement, agriculture, and industry, the world lost nearly 1 million square kilometers (km²) of forest cover since 2001.
But where has most of this deforestation occurred?
We rank the countries by the total decrease in their forest area between 2001 and 2021, measured in square kilometers along with their percentage decrease for context. All of this data was sourced from the World Bank.
A caveat to this data: countries are ranked by total forest loss, so countries with the largest forests feature predominantly on this list.
Which Country Has Lost the Most Forests (2001-2021)?
Brazil has lost more than half a million square kilometers of forest in the last two decades. Agricultural expansion for beef and soy production alongside mining and infrastructure growth are the primary drivers behind this large scale deforestation.
This has also caused periodic fires in the Amazon rainforest, drawing repeated alarm from around the world. In fact, Brazil has lost as much forest cover as the next four countries combined.
The table below lists the countries included in this graphic, as well as several others further down the ranking.
| Rank | Country | Region | 2001–21 Change (in km2) | % of Forest Loss |
|---|---|---|---|---|
| 1 | 🇧🇷 Brazil | South America | -517,464 | -9% |
| 2 | 🇨🇩 DRC | Africa | -181,721 | -13% |
| 3 | 🇦🇴 Angola | Africa | -111,012 | -14% |
| 4 | 🇸🇩 Sudan | Africa | -106,213 | -37% |
| 5 | 🇮🇩 Indonesia | Asia | -95,903 | -9% |
| 6 | 🇹🇿 Tanzania | Africa | -80,220 | -15% |
| 7 | 🇵🇾 Paraguay | South America | -68,266 | -30% |
| 8 | 🇲🇲 Myanmar | Asia | -62,712 | -18% |
| 9 | 🇦🇷 Argentina | South America | -45,979 | -14% |
| 10 | 🇲🇿 Mozambique | Africa | -44,688 | -11% |
| 11 | 🇧🇴 Bolivia | South America | -42,791 | -8% |
| 12 | 🇨🇴 Colombia | South America | -36,001 | -6% |
| 13 | 🇳🇬 Nigeria | Africa | -32,661 | -13% |
| 14 | 🇵🇪 Peru | South America | -30,155 | -4% |
| 15 | 🇰🇭 Cambodia | Asia | -28,491 | -26% |
| 16 | 🇻🇪 Venezuela | South America | -28,130 | -6% |
| 17 | 🇲🇽 Mexico | North America | -26,732 | -4% |
| 18 | 🇿🇲 Zambia | Africa | -23,924 | -5% |
| 19 | 🇧🇼 Botswana | Africa | -23,660 | -14% |
| 20 | 🇨🇮 Cote d'Ivoire | Africa | -22,577 | -45% |
What is quickly apparent is how most of the countries on this list are from Africa and South America. A study found a correlation where developing economies tend to have higher deforestation rates than advanced economies. Former colonies have also experienced more forest loss than those that were not colonized.
In Asia, Indonesia’s burgeoning palm oil industry is a key driver to deforestation, though efforts are now being made to reverse its impact. Meanwhile, Cambodia experienced rapid clear-cutting for its growing rubber plantations and timber industry.
Finally, Myanmar has long contended with illegal logging, but the country’s ongoing civil war is styming conversation efforts.

-

 Education1 week ago
How Hard Is It to Get Into an Ivy League School?
-

 Technology2 weeks ago
Ranked: Semiconductor Companies by Industry Revenue Share
-

 Markets2 weeks ago
Ranked: The World’s Top Flight Routes, by Revenue
-

 Demographics2 weeks ago
Population Projections: The World’s 6 Largest Countries in 2075
-

 Markets2 weeks ago
The Top 10 States by Real GDP Growth in 2023
-

 Demographics2 weeks ago
The Smallest Gender Wage Gaps in OECD Countries
-

 Economy2 weeks ago
Where U.S. Inflation Hit the Hardest in March 2024
-

 Green2 weeks ago
Top Countries By Forest Growth Since 2001