

A Global Breakdown of Greenhouse Gas Emissions by Sector In a few decades, greenhouse gases (GHGs)—chiefly in the form of CO₂ emissions—have risen at unprecedented rates...
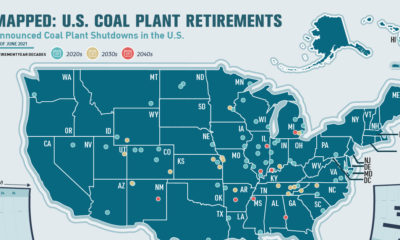

This infographic highlights announced coal plant closures in the U.S. and how much power will be affected.
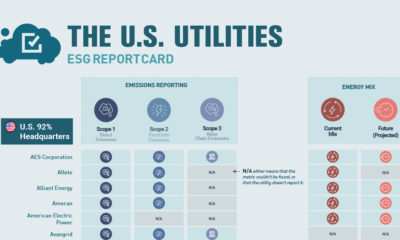

This graphic acts as an ESG report card that tracks the ESG metrics reported by different utilities in the U.S.—what gets left out?
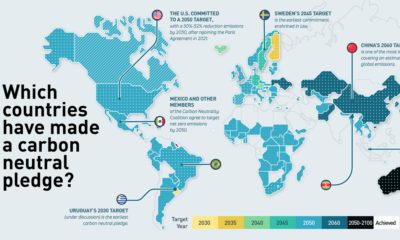

Which countries have made a net zero pledge, and how strong is it? This map breaks down carbon neutral pledges.
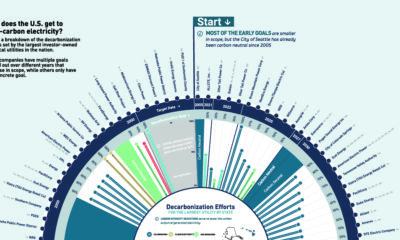

How are utilities reducing carbon emissions? Here are the decarbonization targets of the largest U.S. utilities.
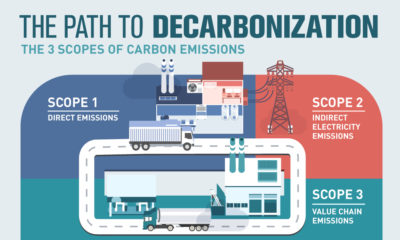

What types of carbon emissions do companies need to be aware of to effectively decarbonize? Here are the 3 scopes of carbon emissions.
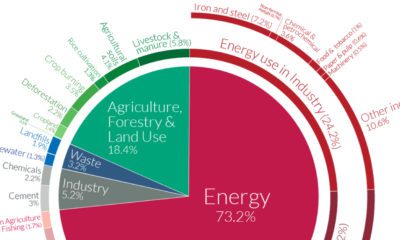

World emissions have reached almost 50 billion tonnes of greenhouse gases (GHGs) and counting. Which major sectors do they originate from?
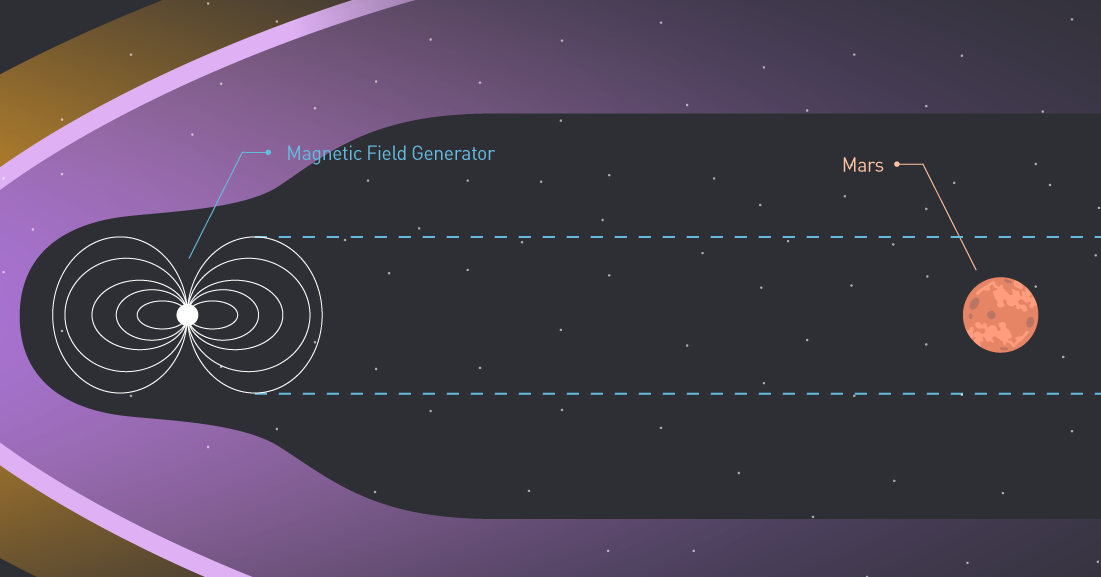
This infographic highlights some of the major problems we'd need to solve to make other planets like Mars more hospitable to human life.
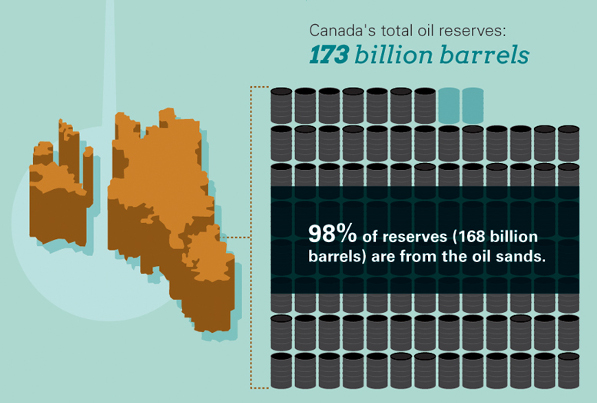
Infographic: How Big Are Canada’s Oil Sands? There’s no shortage of discussion on Canada’s oil sands. Even Leonardo Dicaprio has recently toured them while subsequently providing...


 Creator Program