Energy
Visualizing 50+ Years of the G20’s Energy Mix
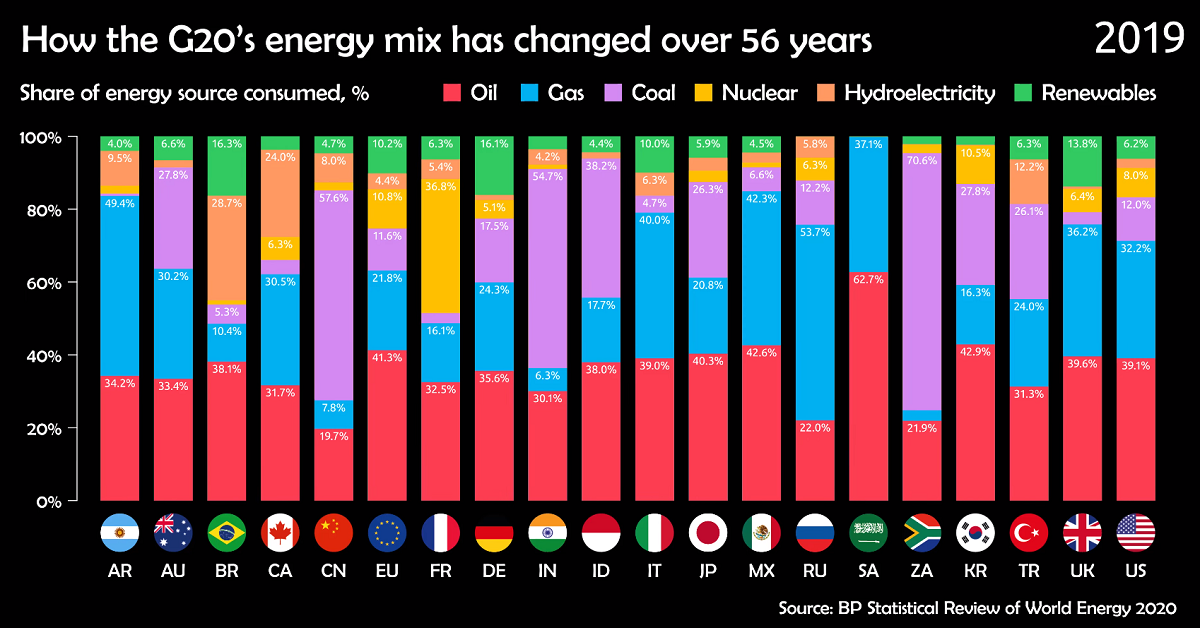
Visualizing 50+ Years of the G20’s Energy Mix (1965–2019)
Over the last 50 years, the energy mix of G20 countries has changed drastically in some ways.
With many countries and regions pledging to move away from fossil fuels and towards cleaner sources of energy, the overall energy mix is becoming more diversified. But shutting down plants and replacing them with new sources takes time, and most countries are still incredibly reliant on fossil fuels.
This video from James Eagle uses data from BP’s Statistical Review of World Energy to examine how the energy mix of G20 members has changed from 1965 to 2019.
G20’s Energy History: Fossil Fuel Dependence (1965–1999)
At first, there was oil and coal.
From the 1960s to the 1980s, energy consumption in the G20 countries relied almost entirely on these two fossil fuels. They were the cheapest and most efficient sources of energy for most, though some countries also used a lot of natural gas, like the United States, Mexico, and Russia.
| Country (Energy Mix - 1965) | Oil | Coal | Other |
|---|---|---|---|
| 🇦🇷 Argentina | 83% | 3% | 14% |
| 🇦🇺 Australia | 45% | 50% | 5% |
| 🇧🇷 Brazil | 66% | 8% | 26% |
| 🇨🇦 Canada | 47% | 13% | 40% |
| 🇨🇳 China | 8% | 87% | 5% |
| 🇪🇺 EU | 47% | 45% | 8% |
| 🇫🇷 France | 49% | 37% | 14% |
| 🇩🇪 Germany | 34% | 63% | 3% |
| 🇮🇳 India | 24% | 67% | 9% |
| 🇮🇩 Indonesia | 86% | 2% | 12% |
| 🇮🇹 Italy | 66% | 11% | 23% |
| 🇯🇵 Japan | 56% | 31% | 13% |
| 🇲🇽 Mexico | 61% | 3% | 36% |
| 🇷🇺 Russia | 29% | 50% | 21% |
| 🇸🇦 Saudi Arabia | 98% | 0% | 2% |
| 🇿🇦 South Africa | 19% | 81% | 0% |
| 🇰🇷 South Korea | 20% | 77% | 3% |
| 🇹🇷 Turkey | 46% | 47% | 7% |
| 🇬🇧 UK | 38% | 59% | 3% |
| 🇺🇸 U.S. | 45% | 22% | 33% |
But the use of oil for energy started to decrease, beginning most notably in the 1980s. Rocketing oil prices forced many utilities to turn to coal and natural gas (which were becoming cheaper), while others in countries like France, Japan, and the U.S. embraced the rise of nuclear power.
This is most notable in countries with high historic oil consumption, like Argentina and Indonesia. In 1965, these three countries relied on oil for more than 83% of energy, but by 1999, oil made up just 55% of Indonesia’s energy mix and 36% of Argentina’s.
Even Saudi Arabia, the world’s largest oil exporter, began to utilize oil less. By 1999, oil was used for 65% of energy in the country, down from a 1965 high of 97%.
G20’s Energy Mix: Gas and Renewables Climb (2000–2019)
The conversation around energy changed in the 21st century. Before, countries were focused primarily on efficiency and cost, but very quickly, they had to start contending with emissions.
Climate change was already on everyone’s radar. The UN Framework Convention on Climate Change was signed in 1992, and the resulting Kyoto Protocol aimed at reducing greenhouse gas emissions was signed in 1997.
But when the Kyoto Protocol went into effect in 2005, countries had very different options available to them. Some started to lean more heavily on hydroelectricity, though countries that already utilized them like Canada and Brazil had to look elsewhere. Others turned to nuclear power, but the 2011 Fukushima nuclear disaster in Japan turned many away.
This is the period of time that renewables started to pick up steam, primarily in the form of wind power at first. By 2019, the G20 members that relied on renewables the most were Brazil (16%), Germany (16%), and the UK (14%).
| Country (Energy Mix - 2019) | Natural Gas | Nuclear | Hydroelectric | Renewables | Other |
|---|---|---|---|---|---|
| 🇦🇷 Argentina | 49% | 2% | 10% | 4% | 35% |
| 🇦🇺 Australia | 30% | 0% | 2% | 7% | 61% |
| 🇧🇷 Brazil | 10% | 1% | 29% | 16% | 44% |
| 🇨🇦 Canada | 31% | 6% | 24% | 4% | 35% |
| 🇨🇳 China | 8% | 2% | 8% | 5% | 77% |
| 🇪🇺 EU | 22% | 11% | 4% | 10% | 53% |
| 🇫🇷 France | 16% | 37% | 5% | 6% | 36% |
| 🇩🇪 Germany | 24% | 5% | 1% | 16% | 54% |
| 🇮🇳 India | 6% | 1% | 4% | 4% | 85% |
| 🇮🇩 Indonesia | 18% | 0% | 2% | 4% | 76% |
| 🇮🇹 Italy | 40% | 0% | 6% | 10% | 44% |
| 🇯🇵 Japan | 21% | 3% | 4% | 6% | 66% |
| 🇲🇽 Mexico | 42% | 1% | 3% | 5% | 49% |
| 🇷🇺 Russia | 54% | 6% | 6% | 0% | 34% |
| 🇸🇦 Saudi Arabia | 37% | 0% | 0% | 0% | 63% |
| 🇿🇦 South Africa | 3% | 2% | 0% | 2% | 93% |
| 🇰🇷 South Korea | 16% | 11% | 0% | 2% | 71% |
| 🇹🇷 Turkey | 24% | 0% | 12% | 6% | 58% |
| 🇬🇧 UK | 36% | 6% | 1% | 14% | 43% |
| 🇺🇸 U.S. | 32% | 8% | 3% | 6% | 51% |
However, the need to reduce emissions quickly made many countries make a simpler switch: cut back on oil and coal and utilize more natural gas. Bituminous coal, one of the most commonly used in steam-electric power stations, emits 76% more CO₂ than natural gas. Diesel fuel and heating oil used in oil power plants emit 38% more CO₂ than natural gas.
As countries begin to push more strongly towards a carbon-neutral future, the energy mix of the 2020s and onward will continue to change.


Energy
Charted: 4 Reasons Why Lithium Could Be the Next Gold Rush
Visual Capitalist has partnered with EnergyX to show why drops in prices and growing demand may make now the right time to invest in lithium.


4 Reasons Why You Should Invest in Lithium
Lithium’s importance in powering EVs makes it a linchpin of the clean energy transition and one of the world’s most precious minerals.
In this graphic, Visual Capitalist partnered with EnergyX to explore why now may be the time to invest in lithium.
1. Lithium Prices Have Dropped
One of the most critical aspects of evaluating an investment is ensuring that the asset’s value is higher than its price would indicate. Lithium is integral to powering EVs, and, prices have fallen fast over the last year:
| Date | LiOH·H₂O* | Li₂CO₃** |
|---|---|---|
| Feb 2023 | $76 | $71 |
| March 2023 | $71 | $61 |
| Apr 2023 | $43 | $33 |
| May 2023 | $43 | $33 |
| June 2023 | $47 | $45 |
| July 2023 | $44 | $40 |
| Aug 2023 | $35 | $35 |
| Sept 2023 | $28 | $27 |
| Oct 2023 | $24 | $23 |
| Nov 2023 | $21 | $21 |
| Dec 2023 | $17 | $16 |
| Jan 2024 | $14 | $15 |
| Feb 2024 | $13 | $14 |
Note: Monthly spot prices were taken as close to the 14th of each month as possible.
*Lithium hydroxide monohydrate MB-LI-0033
**Lithium carbonate MB-LI-0029
2. Lithium-Ion Battery Prices Are Also Falling
The drop in lithium prices is just one reason to invest in the metal. Increasing economies of scale, coupled with low commodity prices, have caused the cost of lithium-ion batteries to drop significantly as well.
In fact, BNEF reports that between 2013 and 2023, the price of a Li-ion battery dropped by 82%.
| Year | Price per KWh |
|---|---|
| 2023 | $139 |
| 2022 | $161 |
| 2021 | $150 |
| 2020 | $160 |
| 2019 | $183 |
| 2018 | $211 |
| 2017 | $258 |
| 2016 | $345 |
| 2015 | $448 |
| 2014 | $692 |
| 2013 | $780 |

3. EV Adoption is Sustainable
One of the best reasons to invest in lithium is that EVs, one of the main drivers behind the demand for lithium, have reached a price point similar to that of traditional vehicle.
According to the Kelly Blue Book, Tesla’s average transaction price dropped by 25% between 2022 and 2023, bringing it in line with many other major manufacturers and showing that EVs are a realistic transport option from a consumer price perspective.
| Manufacturer | September 2022 | September 2023 |
|---|---|---|
| BMW | $69,000 | $72,000 |
| Ford | $54,000 | $56,000 |
| Volkswagon | $54,000 | $56,000 |
| General Motors | $52,000 | $53,000 |
| Tesla | $68,000 | $51,000 |
4. Electricity Demand in Transport is Growing
As EVs become an accessible transport option, there’s an investment opportunity in lithium. But possibly the best reason to invest in lithium is that the IEA reports global demand for the electricity in transport could grow dramatically by 2030:
| Transport Type | 2022 | 2025 | 2030 |
|---|---|---|---|
| Buses 🚌 | 23,000 GWh | 50,000 GWh | 130,000 GWh |
| Cars 🚙 | 65,000 GWh | 200,000 GWh | 570,000 GWh |
| Trucks 🛻 | 4,000 GWh | 15,000 GWh | 94,000 GWh |
| Vans 🚐 | 6,000 GWh | 16,000 GWh | 72,000 GWh |
The Lithium Investment Opportunity
Lithium presents a potentially classic investment opportunity. Lithium and battery prices have dropped significantly, and recently, EVs have reached a price point similar to other vehicles. By 2030, the demand for clean energy, especially in transport, will grow dramatically.
With prices dropping and demand skyrocketing, now is the time to invest in lithium.
EnergyX is poised to exploit lithium demand with cutting-edge lithium extraction technology capable of extracting 300% more lithium than current processes.

-

 Lithium4 days ago
Ranked: The Top 10 EV Battery Manufacturers in 2023
Asia dominates this ranking of the world’s largest EV battery manufacturers in 2023.
-

 Energy1 week ago
The World’s Biggest Nuclear Energy Producers
China has grown its nuclear capacity over the last decade, now ranking second on the list of top nuclear energy producers.
-

 Energy1 month ago
The World’s Biggest Oil Producers in 2023
Just three countries accounted for 40% of global oil production last year.
-

 Energy1 month ago
How Much Does the U.S. Depend on Russian Uranium?
Currently, Russia is the largest foreign supplier of nuclear power fuel to the U.S.
-

 Uranium2 months ago
Charted: Global Uranium Reserves, by Country
We visualize the distribution of the world’s uranium reserves by country, with 3 countries accounting for more than half of total reserves.
-

 Energy3 months ago
Visualizing the Rise of the U.S. as Top Crude Oil Producer
Over the last decade, the United States has established itself as the world’s top producer of crude oil, surpassing Saudi Arabia and Russia.


-

 Education1 week ago
How Hard Is It to Get Into an Ivy League School?
-

 Technology2 weeks ago
Ranked: Semiconductor Companies by Industry Revenue Share
-

 Markets2 weeks ago
Ranked: The World’s Top Flight Routes, by Revenue
-

 Demographics2 weeks ago
Population Projections: The World’s 6 Largest Countries in 2075
-

 Markets2 weeks ago
The Top 10 States by Real GDP Growth in 2023
-

 Demographics2 weeks ago
The Smallest Gender Wage Gaps in OECD Countries
-

 Economy2 weeks ago
Where U.S. Inflation Hit the Hardest in March 2024
-

 Green2 weeks ago
Top Countries By Forest Growth Since 2001