Energy
Mapped: The World’s Nuclear Reactor Landscape
View a more detailed version of this map


The World’s Changing Nuclear Reactor Landscape
View a more detailed version of the above map by clicking here
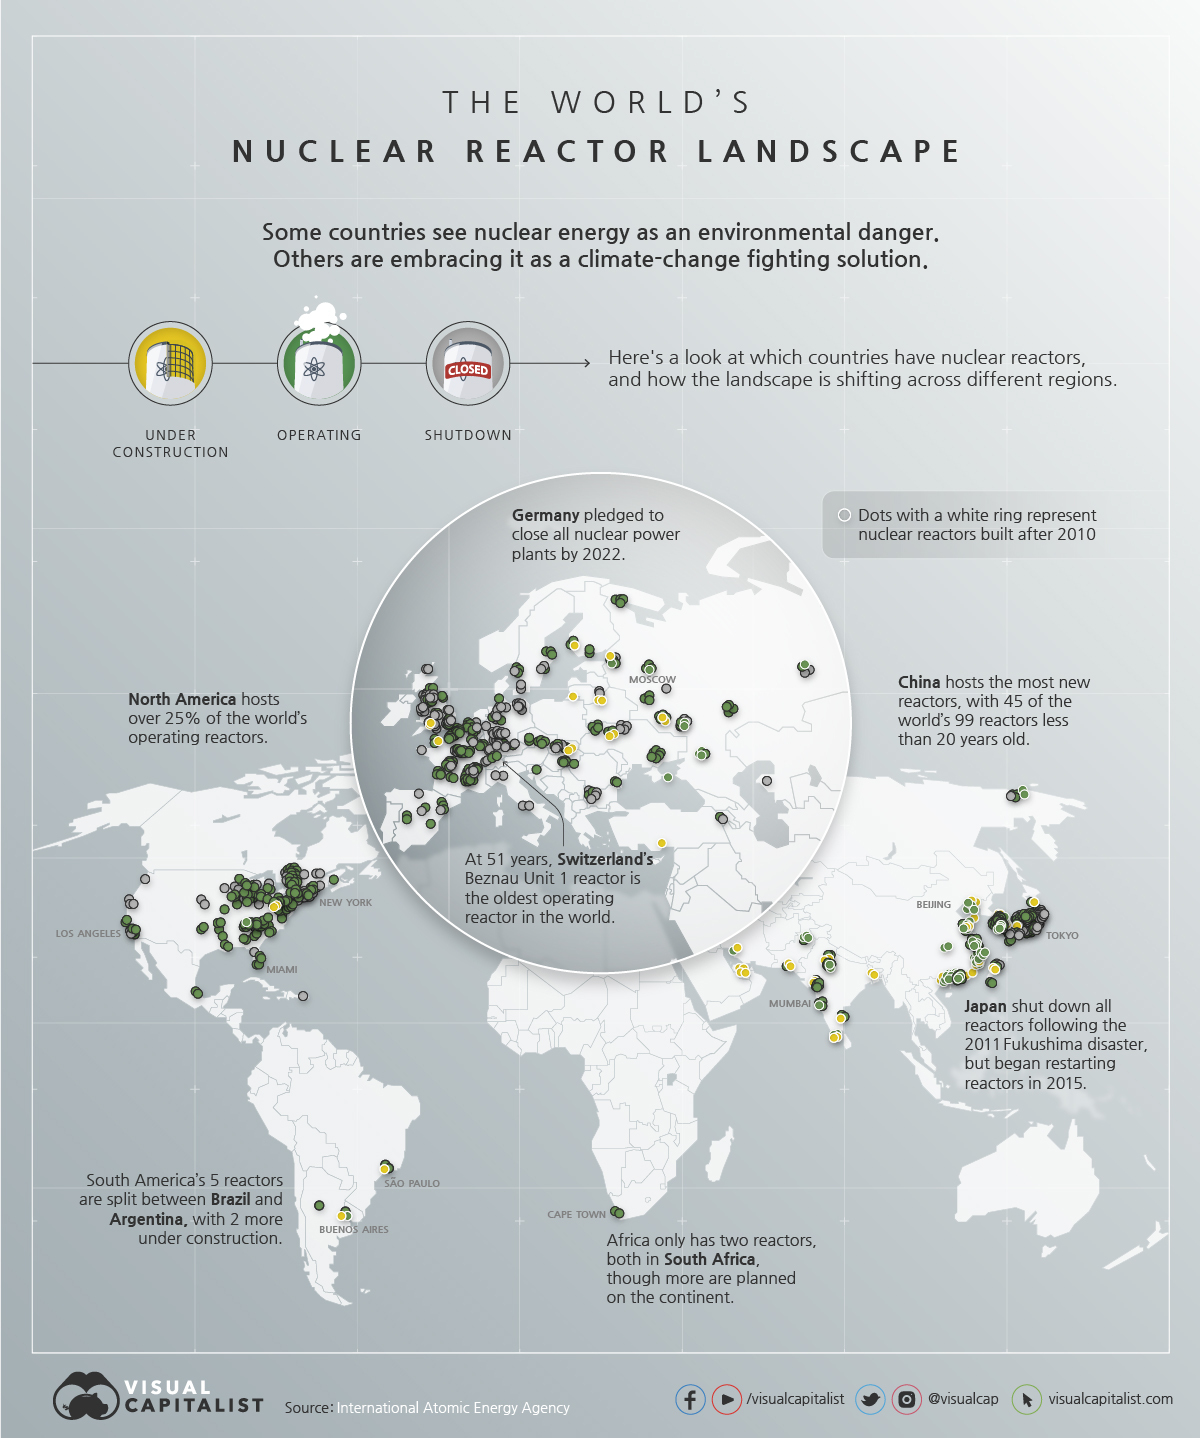
Following the 2011 Fukushima nuclear disaster in Japan, the most severe nuclear accident since Chernobyl, many nations reiterated their intent to wean off the energy source.
However, this sentiment is anything but universal—in many other regions of the world, nuclear power is still ramping up, and it’s expected to be a key energy source for decades to come.
Using data from the Power Reactor Information System, maintained by the International Atomic Energy Agency, the map above gives a comprehensive look at where nuclear reactors are subsiding, and where future capacity will reside.
Increasing Global Nuclear Use
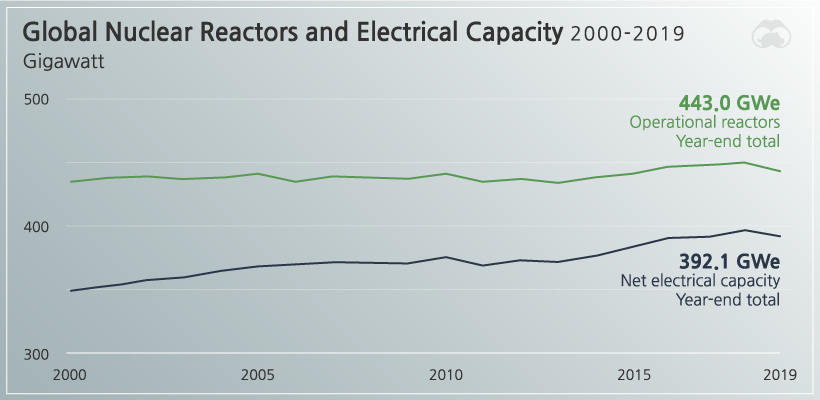
Despite a dip in total capacity and active reactors last year, nuclear power still generated around 10% of the world’s electricity in 2019.
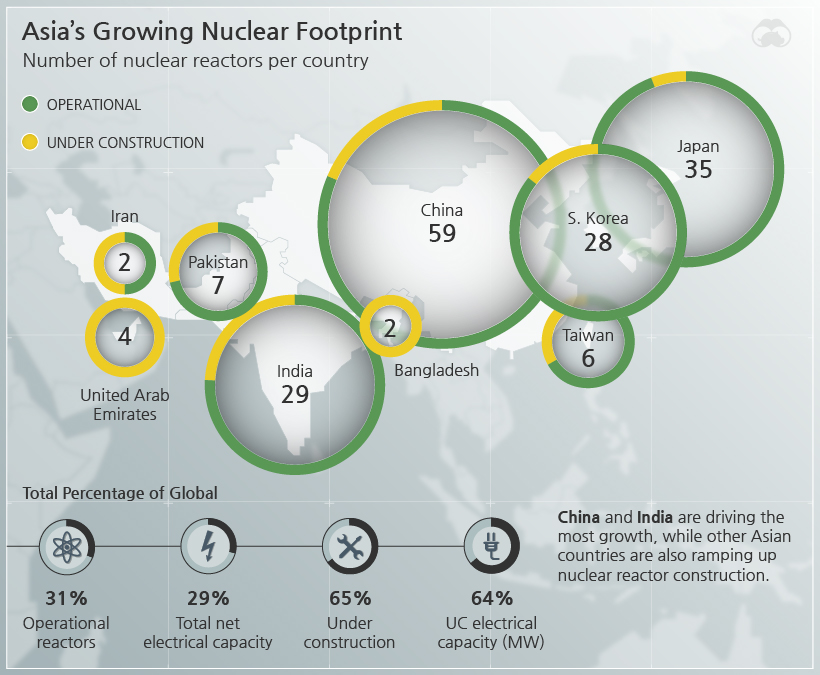
Part of the increased capacity came as Japan restarted some plants and European countries looked to replace aging reactors. But most of the growth is driven by new reactors coming online in Asia and the Middle East.
China is soon to have more than 50 nuclear reactors, while India is set to become a top-ten producer once construction on new reactors is complete.
Decreasing Use in Western Europe and North America
The slight downtrend from 450 operating reactors in 2018 to 443 in 2019 was the result of continued shutdowns in Europe and North America. Home to the majority of the world’s reactors, the two continents also have the oldest reactors, with many being retired.
At the same time, European countries are leading the charge in reducing dependency on the energy source. Germany has pledged to close all nuclear plants by 2022, and Italy has already become the first country to completely shut down their plants.
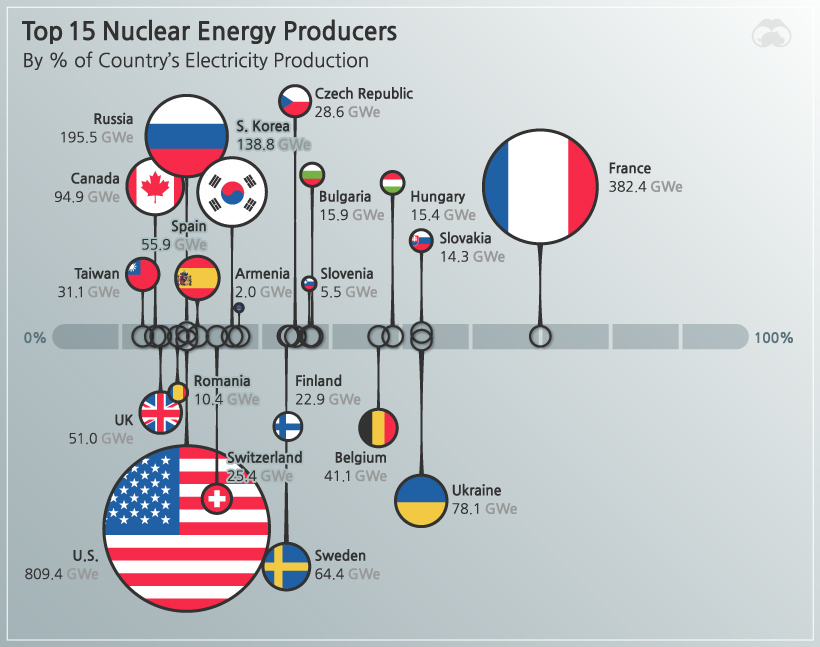
Despite leading in shutdowns, Europe still emerges as the most nuclear-reliant region for a majority of electricity production and consumption.
In addition, some countries are starting to reassess nuclear energy as a means of fighting climate change. Reactors don’t produce greenhouse gases during operation, and are more efficient (and safer) than wind and solar per unit of electricity.
Facing steep emission reduction requirements, a variety of countries are looking to expand nuclear capacity or to begin planning for their first reactors.
A New Generation of Nuclear Reactors?
For those parties interested in the benefits of nuclear power, past accidents have also led towards a push for innovation in the field. That includes studies of miniature nuclear reactors that are easier to manage, as well as full-size reactors with robust redundancy measures that won’t physically melt down.
Additionally, some reactors are being designed with the intention of utilizing accumulated nuclear waste—a byproduct of nuclear energy and weapon production that often had to be stored indefinitely—as a fuel source.
With some regions aiming to reduce reliance on nuclear power, and others starting to embrace it, the landscape is certain to change.


Energy
Charted: 4 Reasons Why Lithium Could Be the Next Gold Rush
Visual Capitalist has partnered with EnergyX to show why drops in prices and growing demand may make now the right time to invest in lithium.


4 Reasons Why You Should Invest in Lithium
Lithium’s importance in powering EVs makes it a linchpin of the clean energy transition and one of the world’s most precious minerals.
In this graphic, Visual Capitalist partnered with EnergyX to explore why now may be the time to invest in lithium.
1. Lithium Prices Have Dropped
One of the most critical aspects of evaluating an investment is ensuring that the asset’s value is higher than its price would indicate. Lithium is integral to powering EVs, and, prices have fallen fast over the last year:
| Date | LiOH·H₂O* | Li₂CO₃** |
|---|---|---|
| Feb 2023 | $76 | $71 |
| March 2023 | $71 | $61 |
| Apr 2023 | $43 | $33 |
| May 2023 | $43 | $33 |
| June 2023 | $47 | $45 |
| July 2023 | $44 | $40 |
| Aug 2023 | $35 | $35 |
| Sept 2023 | $28 | $27 |
| Oct 2023 | $24 | $23 |
| Nov 2023 | $21 | $21 |
| Dec 2023 | $17 | $16 |
| Jan 2024 | $14 | $15 |
| Feb 2024 | $13 | $14 |
Note: Monthly spot prices were taken as close to the 14th of each month as possible.
*Lithium hydroxide monohydrate MB-LI-0033
**Lithium carbonate MB-LI-0029
2. Lithium-Ion Battery Prices Are Also Falling
The drop in lithium prices is just one reason to invest in the metal. Increasing economies of scale, coupled with low commodity prices, have caused the cost of lithium-ion batteries to drop significantly as well.
In fact, BNEF reports that between 2013 and 2023, the price of a Li-ion battery dropped by 82%.
| Year | Price per KWh |
|---|---|
| 2023 | $139 |
| 2022 | $161 |
| 2021 | $150 |
| 2020 | $160 |
| 2019 | $183 |
| 2018 | $211 |
| 2017 | $258 |
| 2016 | $345 |
| 2015 | $448 |
| 2014 | $692 |
| 2013 | $780 |

3. EV Adoption is Sustainable
One of the best reasons to invest in lithium is that EVs, one of the main drivers behind the demand for lithium, have reached a price point similar to that of traditional vehicle.
According to the Kelly Blue Book, Tesla’s average transaction price dropped by 25% between 2022 and 2023, bringing it in line with many other major manufacturers and showing that EVs are a realistic transport option from a consumer price perspective.
| Manufacturer | September 2022 | September 2023 |
|---|---|---|
| BMW | $69,000 | $72,000 |
| Ford | $54,000 | $56,000 |
| Volkswagon | $54,000 | $56,000 |
| General Motors | $52,000 | $53,000 |
| Tesla | $68,000 | $51,000 |
4. Electricity Demand in Transport is Growing
As EVs become an accessible transport option, there’s an investment opportunity in lithium. But possibly the best reason to invest in lithium is that the IEA reports global demand for the electricity in transport could grow dramatically by 2030:
| Transport Type | 2022 | 2025 | 2030 |
|---|---|---|---|
| Buses 🚌 | 23,000 GWh | 50,000 GWh | 130,000 GWh |
| Cars 🚙 | 65,000 GWh | 200,000 GWh | 570,000 GWh |
| Trucks 🛻 | 4,000 GWh | 15,000 GWh | 94,000 GWh |
| Vans 🚐 | 6,000 GWh | 16,000 GWh | 72,000 GWh |
The Lithium Investment Opportunity
Lithium presents a potentially classic investment opportunity. Lithium and battery prices have dropped significantly, and recently, EVs have reached a price point similar to other vehicles. By 2030, the demand for clean energy, especially in transport, will grow dramatically.
With prices dropping and demand skyrocketing, now is the time to invest in lithium.
EnergyX is poised to exploit lithium demand with cutting-edge lithium extraction technology capable of extracting 300% more lithium than current processes.

-

 Lithium4 days ago
Ranked: The Top 10 EV Battery Manufacturers in 2023
Asia dominates this ranking of the world’s largest EV battery manufacturers in 2023.
-

 Energy1 week ago
The World’s Biggest Nuclear Energy Producers
China has grown its nuclear capacity over the last decade, now ranking second on the list of top nuclear energy producers.
-

 Energy1 month ago
The World’s Biggest Oil Producers in 2023
Just three countries accounted for 40% of global oil production last year.
-

 Energy1 month ago
How Much Does the U.S. Depend on Russian Uranium?
Currently, Russia is the largest foreign supplier of nuclear power fuel to the U.S.
-

 Uranium2 months ago
Charted: Global Uranium Reserves, by Country
We visualize the distribution of the world’s uranium reserves by country, with 3 countries accounting for more than half of total reserves.
-

 Energy3 months ago
Visualizing the Rise of the U.S. as Top Crude Oil Producer
Over the last decade, the United States has established itself as the world’s top producer of crude oil, surpassing Saudi Arabia and Russia.


-

 Education1 week ago
How Hard Is It to Get Into an Ivy League School?
-

 Technology2 weeks ago
Ranked: Semiconductor Companies by Industry Revenue Share
-

 Markets2 weeks ago
Ranked: The World’s Top Flight Routes, by Revenue
-

 Demographics2 weeks ago
Population Projections: The World’s 6 Largest Countries in 2075
-

 Markets2 weeks ago
The Top 10 States by Real GDP Growth in 2023
-

 Demographics2 weeks ago
The Smallest Gender Wage Gaps in OECD Countries
-

 Economy2 weeks ago
Where U.S. Inflation Hit the Hardest in March 2024
-

 Green2 weeks ago
Top Countries By Forest Growth Since 2001