Brands
The World’s Top Car Manufacturers by Market Capitalization
View the full-resolution version of this infographic
The World’s Top Car Manufacturers by Market Cap
View the high-resolution of the infographic by clicking here.
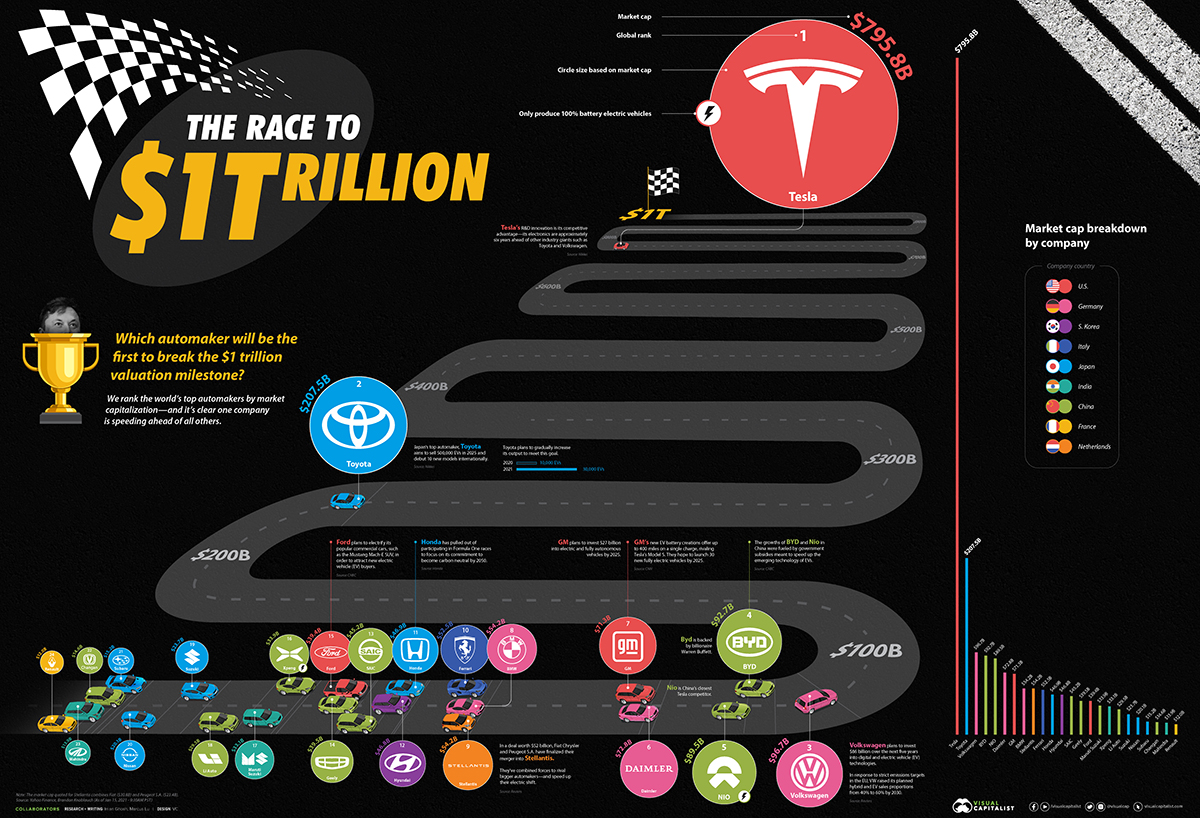
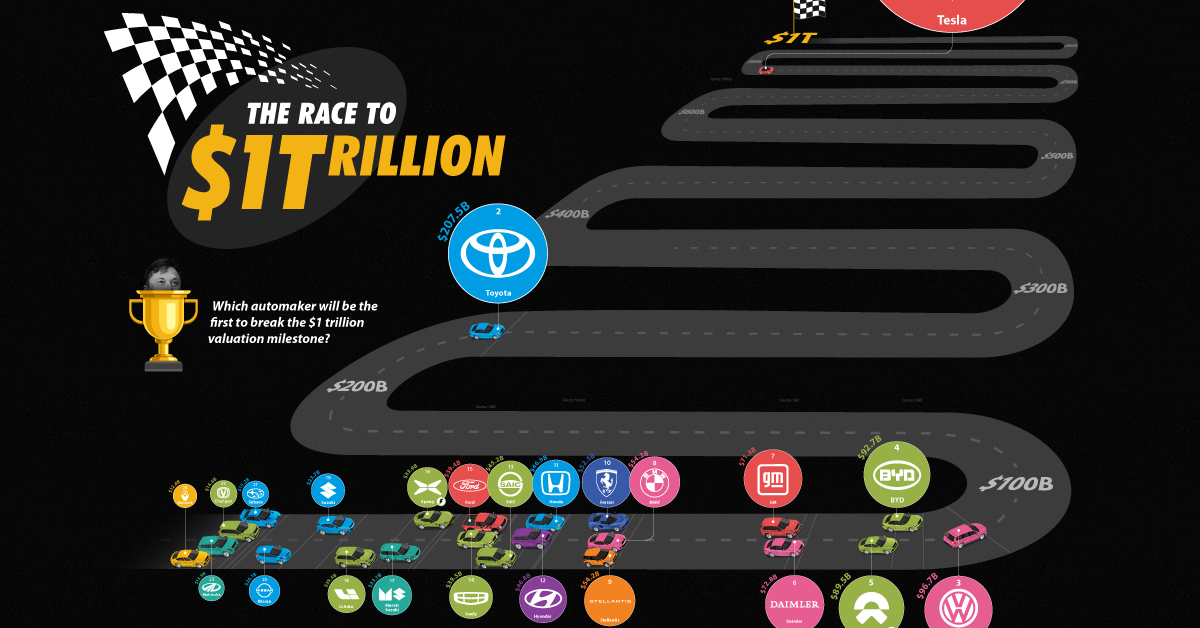
Ever since Apple and other Big Tech companies hit a market capitalization of $1 trillion, many sectors are revving to follow suit—including the automotive industry.
But among those car brands racing to reach this total valuation, some are closer to the finish line than others. This visualization uses data from Yahoo Finance to rank the world’s top car manufacturers by market capitalization.
What could this spell for the future of the automotive industry?
A special hat-tip to Brandon Knoblauch for compiling the original, regularly-updated spreadsheet.
The World’s Top Car Manufacturers
It’s clear one company is pulling far ahead of the pack. In the competition to clinch this coveted title, Tesla is the undoubted favorite so far.
The electric vehicle (EV) and clean energy company first became the world’s most valuable car manufacturer in June 2020, and shows no signs of slowing its trajectory.
| Rank | Company | Market Cap (US$B) | Country |
|---|---|---|---|
| #1 | Tesla | $795.8 | 🇺🇸 U.S. |
| #2 | Toyota | $207.5 | 🇯🇵 Japan |
| #3 | Volkswagen | $96.7 | 🇩🇪 Germany |
| #4 | BYD | $92.7 | 🇨🇳 China |
| #5 | NIO | $89.5 | 🇨🇳 China |
| #6 | Daimler | $72.8 | 🇩🇪 Germany |
| #7 | General Motors | $71.3 | 🇺🇸 U.S. |
| #8 | BMW | $54.2 | 🇩🇪 Germany |
| #9 | Stellantis | $54.2 | 🇳🇱 Netherlands |
| #10 | Ferrari | $52.5 | 🇮🇹 Italy |
| #11 | Honda | $46.9 | 🇯🇵 Japan |
| #12 | Hyundai | $46.8 | 🇰🇷 South Korea |
| #13 | SAIC | $45.2 | 🇨🇳 China |
| #14 | Geely | $39.5 | 🇨🇳 China |
| #15 | Ford | $39.4 | 🇺🇸 U.S. |
| #16 | Xpeng | $33.9 | 🇨🇳 China |
| #17 | Maruti Suzuki | $33.1 | 🇮🇳 India |
| #18 | Li Auto | $29.5 | 🇨🇳 China |
| #19 | Suzuki | $23.7 | 🇯🇵 Japan |
| #20 | Nissan | $20.1 | 🇯🇵 Japan |
| #21 | Subaru | $15.2 | 🇯🇵 Japan |
| #22 | Changan | $14.6 | 🇨🇳 China |
| #23 | Mahindra | $13.9 | 🇮🇳 India |
| #24 | Renault | $12.0 | 🇫🇷 France |
All data as of January 15, 2021 (9:30AM PST)
Tesla’s competitive advantage comes as a result of its dedicated emphasis on research and development (R&D). In fact, many of its rivals have admitted that Tesla’s electronics far surpass their own—a teardown revealed that its batteries and AI chips are roughly six years ahead of other industry giants such as Toyota and Volkswagen.
The Green Revolution is Underway
The sheer growth of Tesla may spell the inevitability of a green revolution in the industry. Already, many major brands have followed in the company’s tracks, announcing their own ambitious plans to add more EVs to their vehicle line-ups.
Here’s how a selection of car manufacturers are embracing the electric future:
Toyota: Ranked #2
The second-most valuable car manufacturer in the world, Toyota is steadily ramping up its EV output. In 2020, it produced 10,000 EVs and plans to increase this to 30,000 in 2021.
Through this gradual increase, the company hopes to hit an expected target of 500,000 EVs by 2025. Toyota also aims to debut 10 new models internationally to achieve this goal.
Volkswagen: Ranked #3
By 2025, Volkswagen plans to invest $86 billion into digital and EV technologies. Considering the car manufacturer generates the most gross revenue per second of all automakers, it’s no wonder Volkswagen is looking to the future in order to keep such numbers up.
The company is also well-positioned to ride the wave of a potential consumer shift towards EVs in Europe. In response to the region’s strict emissions targets, Volkswagen upped its planned sales proportions for European hybrid and EV sales from 40% to 60% by 2030.
BYD and Nio: Ranked #4-5
China jumped on the electric bandwagon early. Eager to make its mark as a global leader in the emerging technology of lithium ion batteries (an essential component of any EV), the Chinese government handed out billions of dollars in subsidies—fueling the growths of domestic car manufacturers BYD and Nio alike.
BYD gained the interest and attention of its billionaire backer Warren Buffett, while Nio is China’s response to Tesla and an attempt to capture the EV market locally.
General Motors: Ranked #7
Also with a 2025 target year in mind, General Motors is investing $27 billion into electric and fully autonomous vehicles. That’s just the tip of the iceberg, too—the company also hopes to launch 30 new fully electric vehicles by the same year.
One particular factor is giving GM confidence: its new EV battery creations. They will be able to extend the range of its new EVs to 400 miles (644km) on a single charge, at a rate that rivals Tesla’s Model S.
Stellantis: Ranked #9
In a long-anticipated move, Fiat Chrysler and Peugeot S.A. finalized their merger into Stellantis N.V. on January 16, 2021.
With the combined forces and funds of a $52 billion deal, the new Dutch-based car manufacturer hopes to rival bigger brands and race even more quickly towards the electric shift.
Honda: Ranked #11
Speaking of fast-paced races, Honda has decided to bow out of future Formula One (F1) World Championships. As these competitions were usually a way for the company to show off its engineering prowess, the move was a surprising one.
However, there’s a noble reason behind this decision. Honda is choosing instead to focus on its commitment to become carbon neutral by 2050. To do so, it’ll be shifting its financial resources away from F1 and towards R&D into fuel cell vehicle (FCV) and battery EV (BEV) technologies.
Ford: Ranked #15
Ford knows exactly what its fans want. In that regard, its electrification plans begin with its most popular commercial cars, such as the Mustang Mach-E SUV. This is Ford’s major strategy for attracting new EV buyers, part of a larger $11.5 billion investment agenda into EVs through 2022.
While the car’s specs compare to Tesla’s Model Y, its engineers also drew from the iPhone and Netflix to incorporate an infotainment system and driver profiles to create a truly tech-first specimen.
Speeding into the Horizon
As more and more companies enter the racetrack, EV innovation across the entire industry may power the move to lower overall costs, extend the total range of vehicles, and put any other concerns by potential buyers to rest.
While Tesla is currently in the best position to become the first car manufacturer to reach the $1 trillion milestone, how long will it be for the others to catch up?


Brands
How Tech Logos Have Evolved Over Time
From complete overhauls to more subtle tweaks, these tech logos have had quite a journey. Featuring: Google, Apple, and more.


How Tech Logos Have Evolved Over Time
This was originally posted on our Voronoi app. Download the app for free on iOS or Android and discover incredible data-driven charts from a variety of trusted sources.
One would be hard-pressed to find a company that has never changed its logo. Granted, some brands—like Rolex, IBM, and Coca-Cola—tend to just have more minimalistic updates. But other companies undergo an entire identity change, thus necessitating a full overhaul.
In this graphic, we visualized the evolution of prominent tech companies’ logos over time. All of these brands ranked highly in a Q1 2024 YouGov study of America’s most famous tech brands. The logo changes are sourced from 1000logos.net.
How Many Times Has Google Changed Its Logo?
Google and Facebook share a 98% fame rating according to YouGov. But while Facebook’s rise was captured in The Social Network (2010), Google’s history tends to be a little less lionized in popular culture.
For example, Google was initially called “Backrub” because it analyzed “back links” to understand how important a website was. Since its founding, Google has undergone eight logo changes, finally settling on its current one in 2015.
| Company | Number of Logo Changes |
|---|---|
| 8 | |
| HP | 8 |
| Amazon | 6 |
| Microsoft | 6 |
| Samsung | 6 |
| Apple | 5* |
Note: *Includes color changes. Source: 1000Logos.net
Another fun origin story is Microsoft, which started off as Traf-O-Data, a traffic counter reading company that generated reports for traffic engineers. By 1975, the company was renamed. But it wasn’t until 2012 that Microsoft put the iconic Windows logo—still the most popular desktop operating system—alongside its name.
And then there’s Samsung, which started as a grocery trading store in 1938. Its pivot to electronics started in the 1970s with black and white television sets. For 55 years, the company kept some form of stars from its first logo, until 1993, when the iconic encircled blue Samsung logo debuted.
Finally, Apple’s first logo in 1976 featured Isaac Newton reading under a tree—moments before an apple fell on his head. Two years later, the iconic bitten apple logo would be designed at Steve Jobs’ behest, and it would take another two decades for it to go monochrome.

-

 Education1 week ago
How Hard Is It to Get Into an Ivy League School?
-

 Technology2 weeks ago
Ranked: Semiconductor Companies by Industry Revenue Share
-

 Markets2 weeks ago
Ranked: The World’s Top Flight Routes, by Revenue
-

 Demographics2 weeks ago
Population Projections: The World’s 6 Largest Countries in 2075
-

 Markets2 weeks ago
The Top 10 States by Real GDP Growth in 2023
-

 Demographics2 weeks ago
The Smallest Gender Wage Gaps in OECD Countries
-

 Economy2 weeks ago
Where U.S. Inflation Hit the Hardest in March 2024
-

 Green2 weeks ago
Top Countries By Forest Growth Since 2001