Business
Mapped: The 50 Richest Women in the World in 2021
View the full-resolution version of this infographic


Mapped: The 50 Richest Women in the World in 2021
View the high-resolution of the infographic by clicking here.
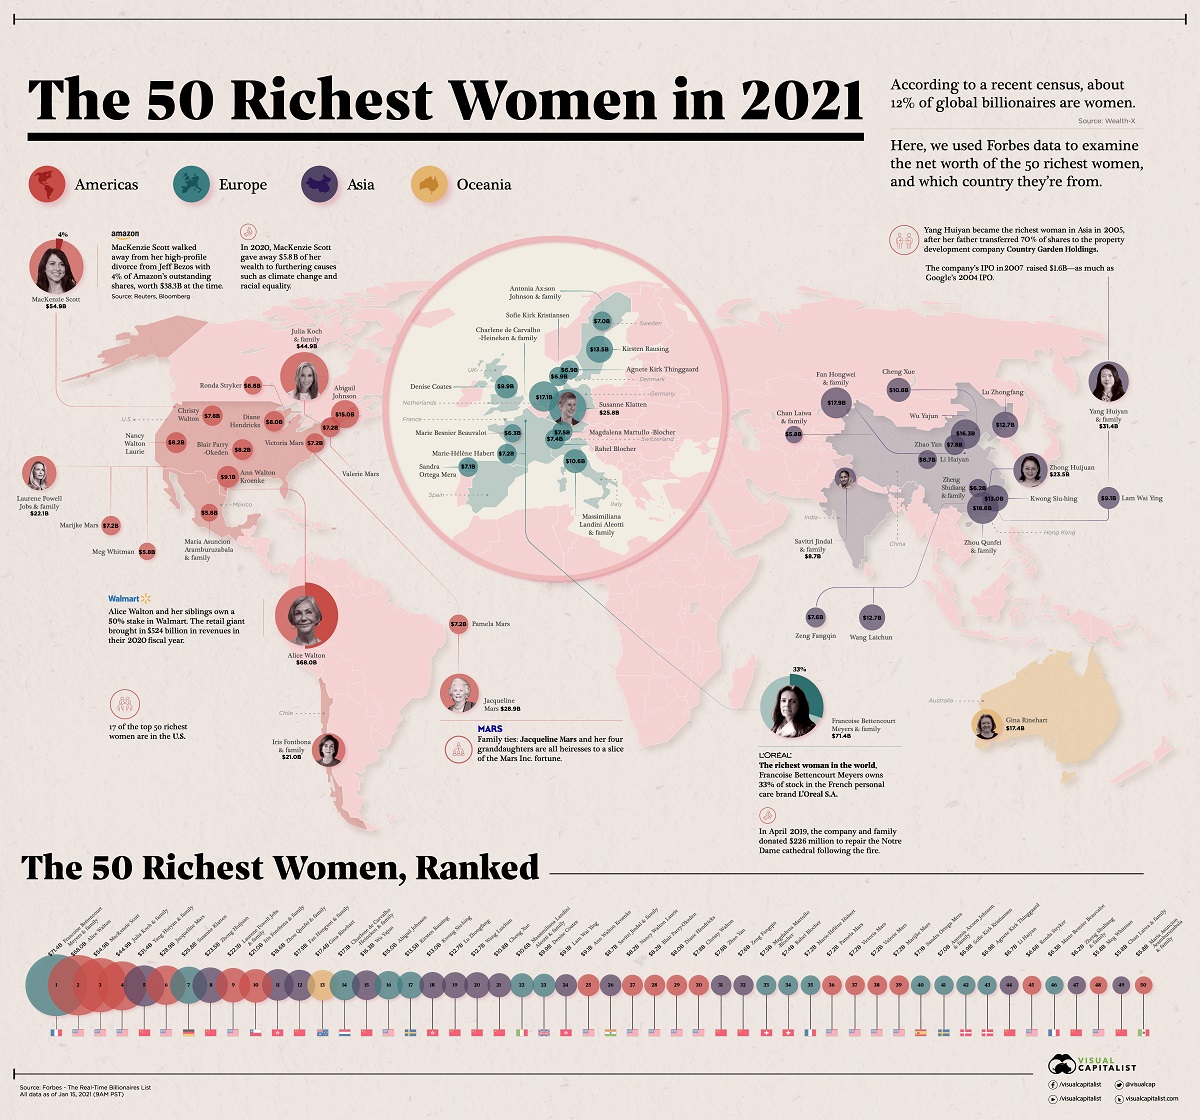
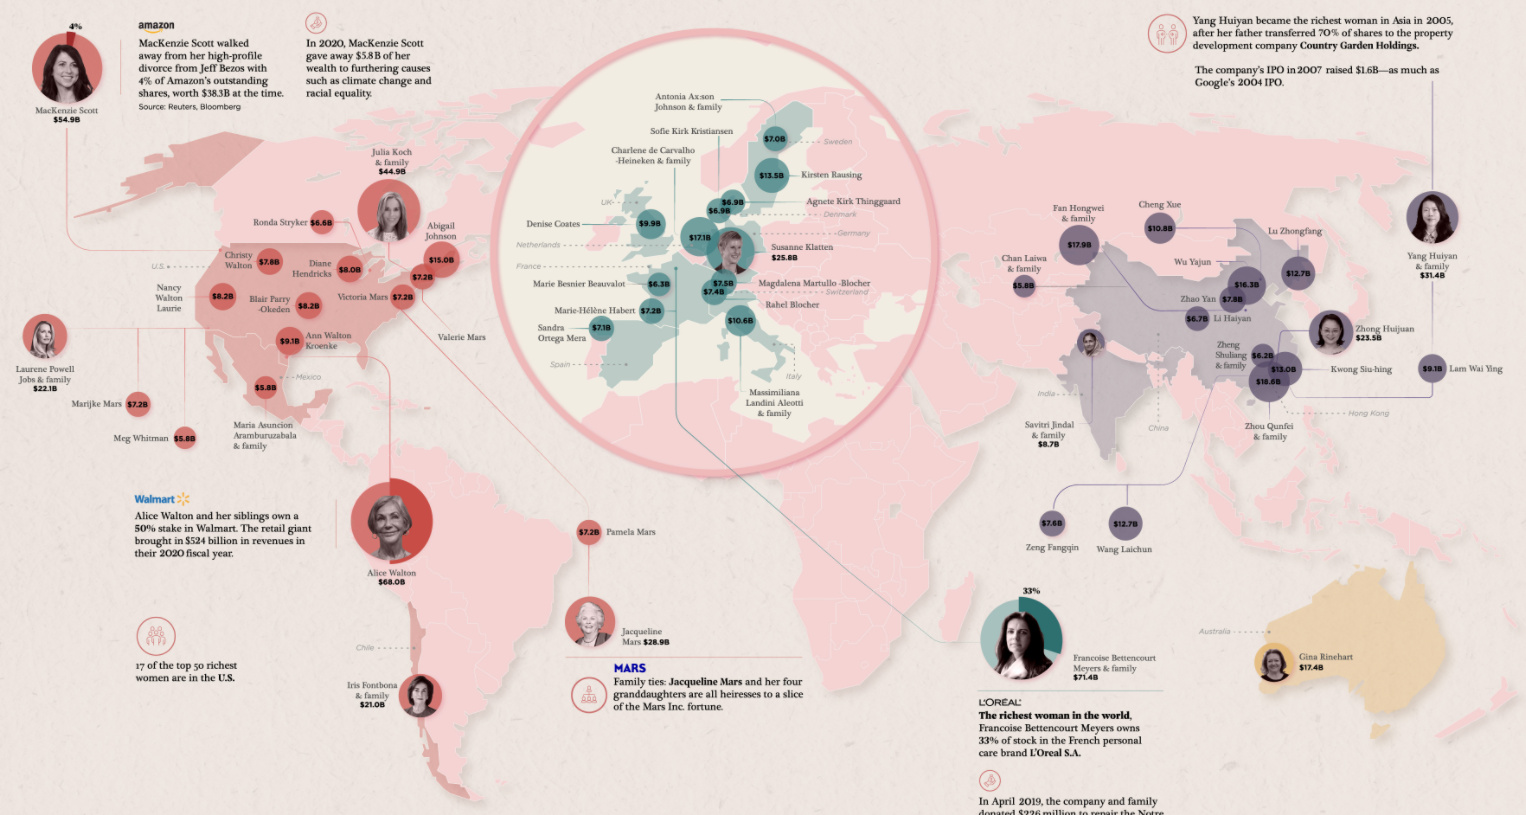
According to a recent census by Wealth-X, 11.9% of global billionaires are women. Even at such a minority share, this group still holds massive amounts of wealth.
Using a real-time list of billionaires from Forbes, we examine the net worth of the 50 richest women in the world and which country they’re from.
Where are the World’s Richest Women?
The richest woman in the world, Francoise Bettencourt Meyers and family own 33% of stock in L’Oréal S.A., a French personal care brand. She is also the granddaughter of its founder.
In April 2019, L’Oréal and the Bettencourt Meyers family pledged $226 million (€200 million) towards the repair of the Notre Dame cathedral after its devastating fire.
Following closely behind is Alice Walton of the Walmart empire—also the world’s richest family. Together with her brothers, they own over 50% of the company’s shares. That’s a pretty tidy sum, considering Walmart raked in $524 billion in revenues in their 2020 fiscal year.
Other family ties among the richest women in the world include Jacqueline Mars and her four granddaughters, heiresses to a slice of the Mars Inc. fortune in candy and pet food—and all of them make this list.
| Rank | Name | Net Worth ($B) | Country |
|---|---|---|---|
| #1 | Francoise Bettencourt Meyers & family | $71.4 | 🇫🇷 France |
| #2 | Alice Walton | $68.0 | 🇺🇸 United States |
| #3 | MacKenzie Scott | $54.9 | 🇺🇸 United States |
| #4 | Julia Koch & family | $44.9 | 🇺🇸 United States |
| #5 | Yang Huiyan & family | $31.4 | 🇨🇳 China |
| #6 | Jacqueline Mars | $28.9 | 🇺🇸 United States |
| #7 | Susanne Klatten | $25.8 | 🇩🇪 Germany |
| #8 | Zhong Huijuan | $23.5 | 🇨🇳 China |
| #9 | Laurene Powell Jobs & family | $22.1 | 🇺🇸 United States |
| #10 | Iris Fontbona & family | $21.0 | 🇨🇱 Chile |
| #11 | Zhou Qunfei & family | $18.6 | 🇭🇰 Hong Kong |
| #12 | Fan Hongwei & family | $17.9 | 🇨🇳 China |
| #13 | Gina Rinehart | $17.4 | 🇦🇺 Australia |
| #14 | Charlene de Carvalho-Heineken & family | $17.1 | 🇳🇱 Netherlands |
| #15 | Wu Yajun | $16.3 | 🇨🇳 China |
| #16 | Abigail Johnson | $15.0 | 🇺🇸 United States |
| #17 | Kirsten Rausing | $13.5 | 🇸🇪 Sweden |
| #18 | Kwong Siu-hing | $13.0 | 🇭🇰 Hong Kong |
| #19 | Lu Zhongfang | $12.7 | 🇨🇳 China |
| #20 | Wang Laichun | $12.7 | 🇨🇳 China |
| #21 | Cheng Xue | $10.8 | 🇨🇳 China |
| #22 | Massimiliana Landini Aleotti & family | $10.6 | 🇮🇹 Italy |
| #23 | Denise Coates | $9.9 | 🇬🇧 United Kingdom |
| #24 | Lam Wai Ying | $9.1 | 🇭🇰 Hong Kong |
| #25 | Ann Walton Kroenke | $9.1 | 🇺🇸 United States |
| #26 | Savitri Jindal & family | $8.7 | 🇮🇳 India |
| #27 | Nancy Walton Laurie | $8.2 | 🇺🇸 United States |
| #28 | Blair Parry-Okeden | $8.2 | 🇺🇸 United States |
| #29 | Diane Hendricks | $8.0 | 🇺🇸 United States |
| #30 | Christy Walton | $7.8 | 🇺🇸 United States |
| #31 | Zhao Yan | $7.8 | 🇨🇳 China |
| #32 | Zeng Fangqin | $7.6 | 🇨🇳 China |
| #33 | Magdalena Martullo-Blocher | $7.5 | 🇨🇭 Switzerland |
| #34 | Rahel Blocher | $7.4 | 🇨🇭 Switzerland |
| #35 | Marie-Hélène Habert | $7.2 | 🇫🇷 France |
| #36 | Pamela Mars | $7.2 | 🇺🇸 United States |
| #37 | Victoria Mars | $7.2 | 🇺🇸 United States |
| #38 | Valerie Mars | $7.2 | 🇺🇸 United States |
| #39 | Marijke Mars | $7.2 | 🇺🇸 United States |
| #40 | Sandra Ortega Mera | $7.1 | 🇪🇸 Spain |
| #41 | Antonia Ax:son Johnson & family | $7.0 | 🇸🇪 Sweden |
| #42 | Sofie Kirk Kristiansen | $6.9 | 🇩🇰 Denmark |
| #43 | Agnete Kirk Thinggaard | $6.9 | 🇩🇰 Denmark |
| #44 | Li Haiyan | $6.7 | 🇨🇳 China |
| #45 | Ronda Stryker | $6.6 | 🇺🇸 United States |
| #46 | Marie Besnier Beauvalot | $6.3 | 🇫🇷 France |
| #47 | Zheng Shuliang & family | $6.2 | 🇨🇳 China |
| #48 | Meg Whitman | $5.8 | 🇺🇸 United States |
| #49 | Chan Laiwa & family | $5.8 | 🇨🇳 China |
| #50 | Maria Asuncion Aramburuzabala & family | $5.8 | 🇲🇽 Mexico |
All data as of January 15, 2021 (9AM PST)
MacKenzie Scott, ranked #3 on the list, was heavily involved in the early days of turning Amazon into an e-commerce behemoth. She was involved in areas from bookkeeping and accounts to negotiating the company’s first freight contract. Her high-profile divorce from Jeff Bezos captured the headlines, notably because she gained control over 4% of Amazon’s outstanding shares.
The total value of these shares? An eye-watering $38.3 billion—propelling her to the status of one of America’s richest people.
However, MacKenzie Scott has more altruistic ventures in mind for this wealth. In 2020, she gave away $5.8 billion towards causes such as climate change and racial equality in just four months, and is a signatory on the Giving Pledge.
[Scott’s near $6 billion donation has] to be one of the biggest annual distributions by a living individual.
—Melissa Berman, CEO of Rockefeller Philanthropy Advisors
Looking towards the East, Yang Huiyan became the richest woman in Asia after inheriting 70% of shares in the property development company Country Garden Holdings. The company went public in 2007, raising $1.6 billion in its IPO—an amount comparable to Google’s IPO in 2004.
To aid frontline health workers during the pandemic, Country Garden Holdings set up robotic, automated buffet stations to safely serve medical staff in Wuhan, China.
Giving Generously
While the 50 richest women in the world have certainly made progress, the overall tier of billionaires is still very much a boys’ club. One thing that also factors into this could be the way this wealth is spent.
As many female billionaires inherited their wealth, a large share are more inclined to contribute to charitable causes where they can use their money to make an impact. What percentage of billionaires by gender have contributed at least $1 million in donations over the past five years?
Made $1mm in donations over last 5 years (%)
| Source of wealth | 👩 Female philanthropists | 👨 Male philanthropists |
|---|---|---|
| Inherited | 68% | 5% |
| Inherited/Self-made | 20% | 28% |
| Self-made | 12% | 67% |
Source: Wealth-X
Meanwhile, male billionaires are more likely to donate to charity if they built the wealth themselves—and many companies that fall into this category certainly stepped up during the early days of the COVID-19 crisis.


Brands
How Tech Logos Have Evolved Over Time
From complete overhauls to more subtle tweaks, these tech logos have had quite a journey. Featuring: Google, Apple, and more.


How Tech Logos Have Evolved Over Time
This was originally posted on our Voronoi app. Download the app for free on iOS or Android and discover incredible data-driven charts from a variety of trusted sources.
One would be hard-pressed to find a company that has never changed its logo. Granted, some brands—like Rolex, IBM, and Coca-Cola—tend to just have more minimalistic updates. But other companies undergo an entire identity change, thus necessitating a full overhaul.
In this graphic, we visualized the evolution of prominent tech companies’ logos over time. All of these brands ranked highly in a Q1 2024 YouGov study of America’s most famous tech brands. The logo changes are sourced from 1000logos.net.
How Many Times Has Google Changed Its Logo?
Google and Facebook share a 98% fame rating according to YouGov. But while Facebook’s rise was captured in The Social Network (2010), Google’s history tends to be a little less lionized in popular culture.
For example, Google was initially called “Backrub” because it analyzed “back links” to understand how important a website was. Since its founding, Google has undergone eight logo changes, finally settling on its current one in 2015.
| Company | Number of Logo Changes |
|---|---|
| 8 | |
| HP | 8 |
| Amazon | 6 |
| Microsoft | 6 |
| Samsung | 6 |
| Apple | 5* |
Note: *Includes color changes. Source: 1000Logos.net
Another fun origin story is Microsoft, which started off as Traf-O-Data, a traffic counter reading company that generated reports for traffic engineers. By 1975, the company was renamed. But it wasn’t until 2012 that Microsoft put the iconic Windows logo—still the most popular desktop operating system—alongside its name.
And then there’s Samsung, which started as a grocery trading store in 1938. Its pivot to electronics started in the 1970s with black and white television sets. For 55 years, the company kept some form of stars from its first logo, until 1993, when the iconic encircled blue Samsung logo debuted.
Finally, Apple’s first logo in 1976 featured Isaac Newton reading under a tree—moments before an apple fell on his head. Two years later, the iconic bitten apple logo would be designed at Steve Jobs’ behest, and it would take another two decades for it to go monochrome.

-

 Debt1 week ago
How Debt-to-GDP Ratios Have Changed Since 2000
-

 Markets2 weeks ago
Ranked: The World’s Top Flight Routes, by Revenue
-

 Countries2 weeks ago
Population Projections: The World’s 6 Largest Countries in 2075
-

 Markets2 weeks ago
The Top 10 States by Real GDP Growth in 2023
-

 Demographics2 weeks ago
The Smallest Gender Wage Gaps in OECD Countries
-

 United States2 weeks ago
Where U.S. Inflation Hit the Hardest in March 2024
-

 Green2 weeks ago
Top Countries By Forest Growth Since 2001
-

 United States2 weeks ago
Ranked: The Largest U.S. Corporations by Number of Employees