Automotive
Visualized: How Much Revenue Automakers Generate Every Second
How Much Revenue Automakers Generate Every Second
Since their invention, automobiles have been a driving force of the global economy.
Used by millions of people to get to work, transport goods, and travel, the modern automobile has become ubiquitous in our daily lives. So much so, that a whopping 92 million cars were produced in just 2019.
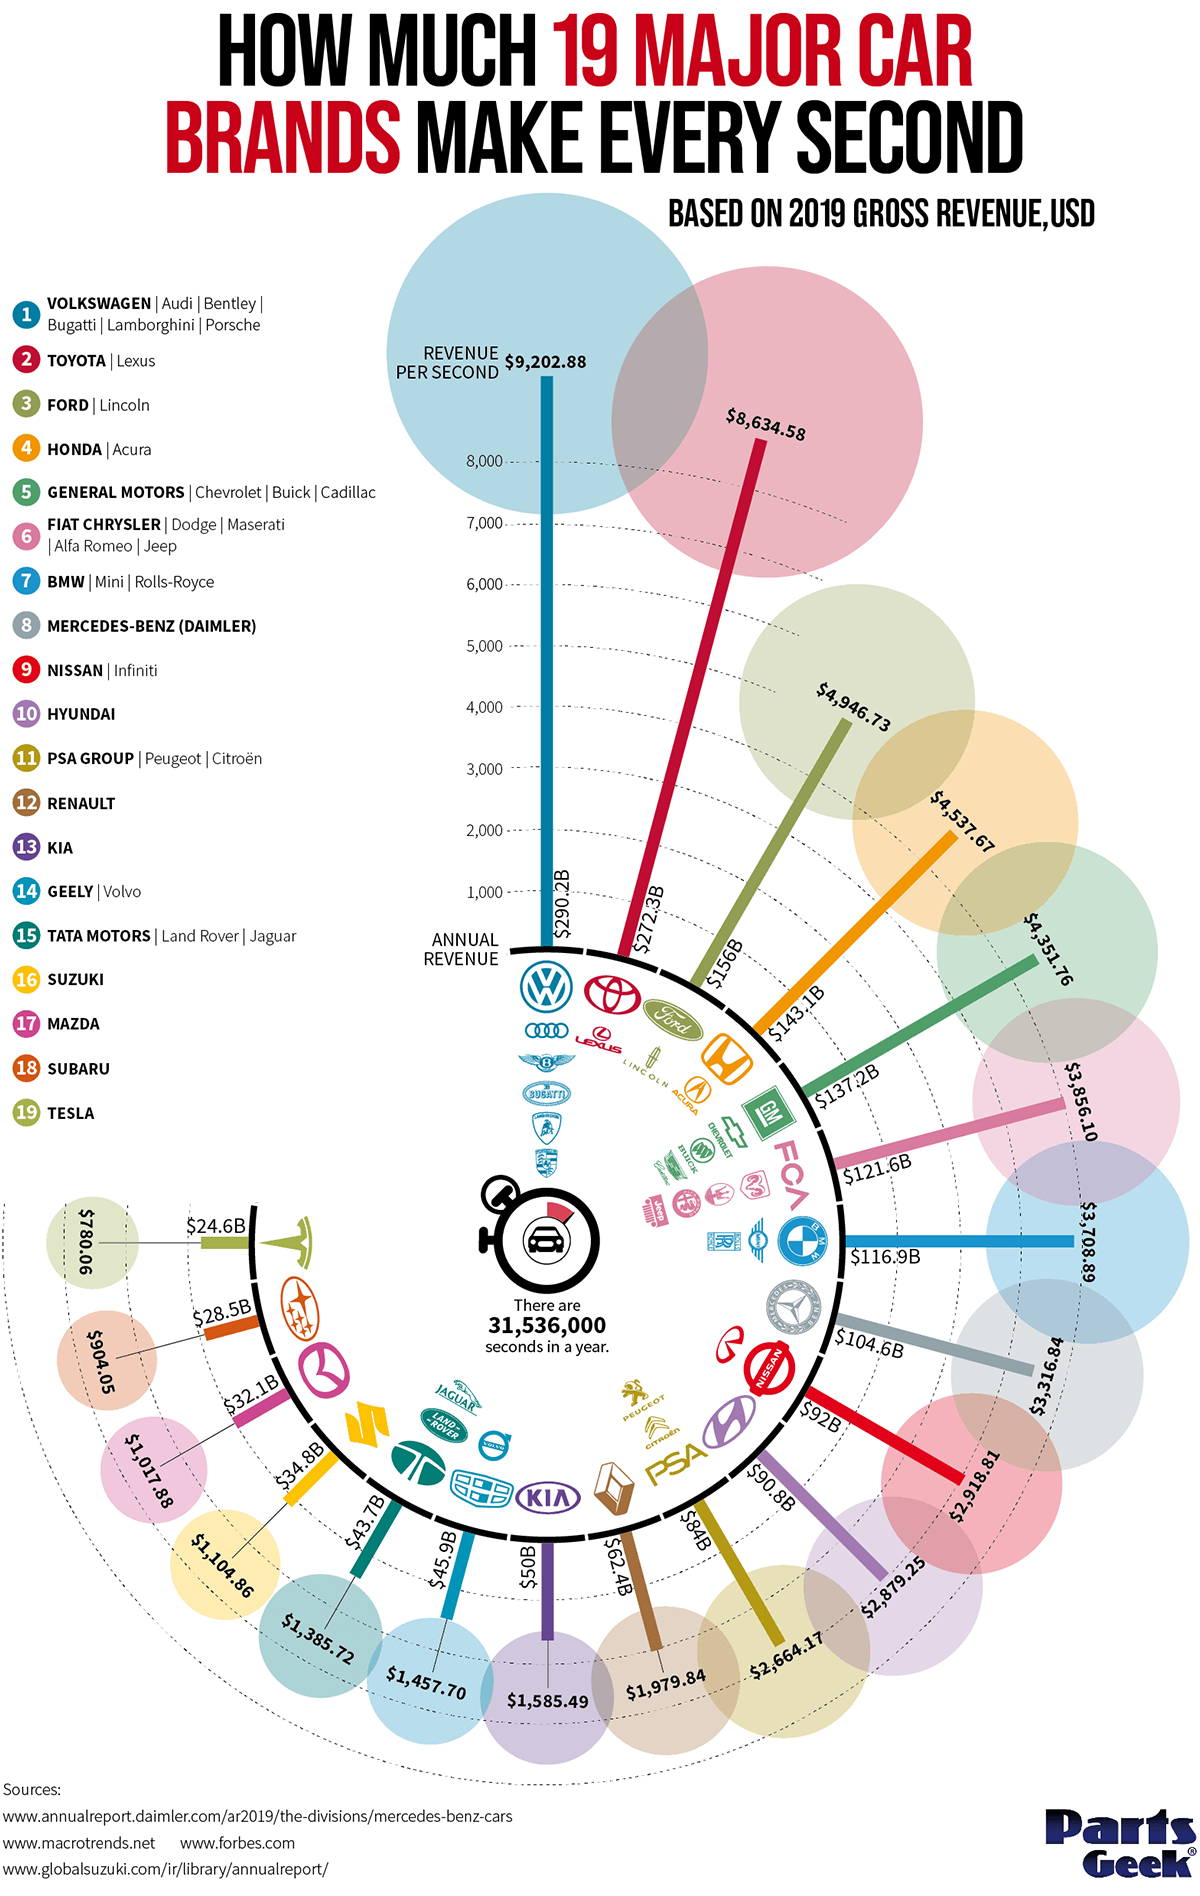
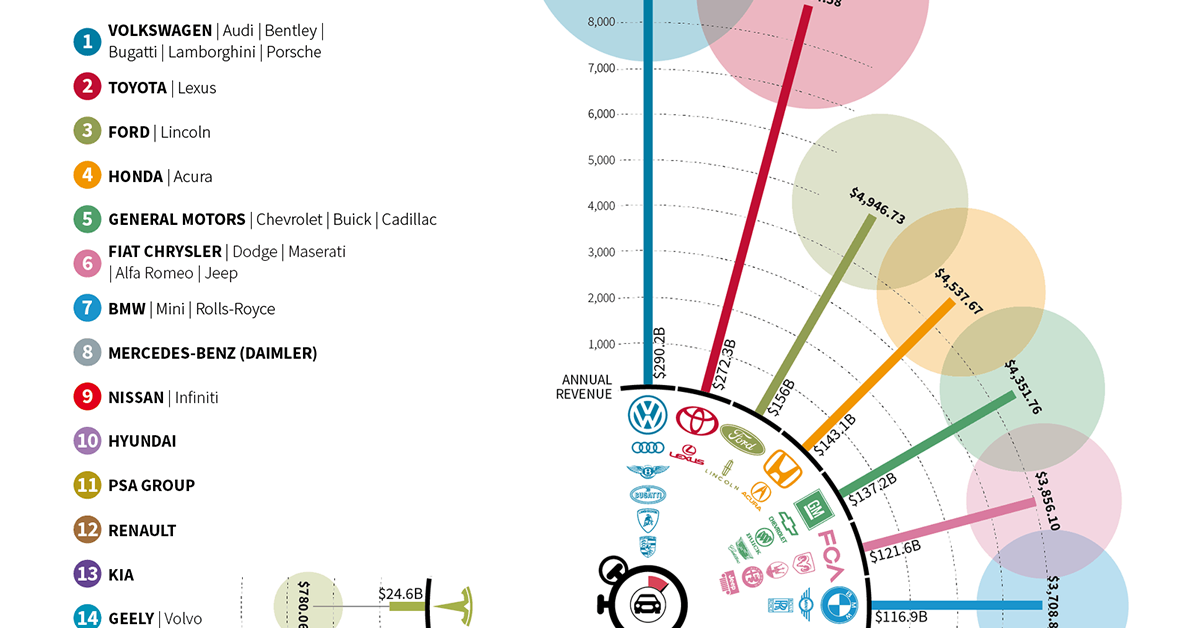
To help us understand the might of the auto industry, this infographic from Parts Geek breaks down the earnings of 19 major car companies by an interesting metric—revenue per second.
The Full List of Automakers
Below are the earnings of the 19 automakers featured in the infographic.
The Volkswagen Group claims the top spot with $290.2B in gross revenue, translating to $9,202.88 per second. Capping off the list is the world’s most valuable automaker, Tesla, which generated a relatively smaller $24.6B in gross revenue, or $780.06 per second.
| Automaker | 2019 Gross Revenue ($) | 2019 Gross Revenue per Second ($) |
|---|---|---|
| Volkswagen | $290.2B | $9,202.88 |
| Toyota | $272.3B | $8,634.58 |
| Ford | $156.0B | $4,946.73 |
| Honda | $143.1B | $4,537.67 |
| General Motors | $137.2B | $4,351.76 |
| Fiat Chrysler | $121.6B | $3,856.10 |
| BMW | $116.9B | $3,708.89 |
| Mercedes-Benz (Daimler) | $104.6B | $3,316.84 |
| Nissan | $92.0B | $2,918.81 |
| Hyundai | $90.8B | $2,879.25 |
| PSA Group | $84.0B | $2,664.17 |
| Renault | $62.4B | $1,979.84 |
| Kia | $50.0B | $1,585.49 |
| Geely | $45.9B | $1,457.70 |
| Tata Motors | $43.7B | $1,385.72 |
| Suzuki | $34.8B | $1,104.86 |
| Mazda | $32.1B | $1,017.88 |
| Subaru | $28.5B | $904.05 |
| Tesla | $24.6B | $780.06 |
A clear takeaway from this data is that Volkswagen and Toyota have a sizable lead over the rest of their peers. Let’s take a closer look at how these two companies operate.
The Volkswagen Group
The Volkswagen Group holds a comprehensive portfolio of brands and services, and has been the world’s largest automaker, by sales, for the past three years.
Beginning with passenger cars and motorcycles, its numerous brands reported the following results for 2019.
| Brand | Vehicle Sales | Sales Revenue* ($) | Average Revenue per Vehicle ($) |
|---|---|---|---|
| Volkswagen | 3,677,000 | $99.1B | $26,960 |
| Audi (includes Lamborghini and Ducatti) | 1,200,000 | $62.4B | $52,028 |
| ŠKODA | 1,062,000 | $22.2B | $20,912 |
| SEAT | 667,000 | $12.9B | $19,326 |
| Porsche | 277,000 | $29.2B | $105,491 |
| Bentley | 12,000 | $2.3B | $195,480 |
*Based on an exchange rate of 1.12 EUR/USD (Dec. 31, 2019)
Source: Volkswagen
Other sources of revenue were Volkswagen’s $44.5B commercial vehicle business, its $4.7B power engineering business, and lastly its $44.4B financial services division.
In total, the Volkswagen Group delivered just short of 11 million vehicles in 2019, besting its 2018 deliveries by 1.3% and setting a new record for the group. While a majority of these vehicles were produced in Europe, the group operates a global production network with a significant presence in Asia.
| Region | Number of locations | Share of total production |
|---|---|---|
| Europe | 36 | 49% |
| Asia | 19 | 38% |
| South America | 6 | 5% |
| North America | 4 | 7% |
| Africa | 4 | 1% |
Source: Volkswagen
The German automaker has invested billions in China, the world’s largest car market, to scale its electric vehicle (EV) production capabilities.
Toyota Motor Corporation
Toyota Motor Corporation operates a much more concentrated brand portfolio, with Toyota and Lexus being its two most prominent names. This strategy seems to be working well, as Toyota was ranked the ninth most valuable brand in 2019, and was the only automaker to crack the top ten.
A testament to Toyota’s global influence is its relatively balanced breakdown of 2019 revenues by regional market:
- North America: 30%
- Japan: 25%
- Asia: 18%
- Europe: 11.5%
- Other: 15.3%
For comparison, here is Volkswagen’s 2019 revenues by region, which leans heavily towards Europe:
- Europe (excl. Germany): 42%
- Germany: 19%
- North America: 17%
- South America: 4%
- Asia-Pacific: 17%
The Japanese automaker’s popularity in foreign regions is likely the result of its reputation for reliability and affordability. It may also explain why Toyota’s trucks are a common sight in tough environments such as conflict zones of the developing world.
Altogether, Toyota and its subsidiaries sold nearly 9 million vehicles in 2019, setting a new record for the company but just 0.1% higher than its 2018 figure. Similar to Volkswagen, a majority of Toyota’s vehicles are produced in its home region, with the remainder being built around the world.
| Region | Share of total production |
|---|---|
| Japan | 50% |
| North America | 20% |
| Asia | 17% |
| Europe | 8% |
| Other | 5% |
Source: Toyota
Outside of Japan, Toyota has significant production capabilities in the U.S., where it makes everything from pickup trucks to sedans. In 2016, the Toyota Camry made headlines after being ranked the most American-made car—over 75% of its parts were sourced domestically.
Alternative Revenue Sources
While automobiles represent the core business for these companies, many of them have alternative revenue sources. Honda, for example, produces motorcycles, boat engines, lawn mowers, and even personal jets.
Porsche takes a slightly different approach with its accessories and licensing subsidiary, Porsche Design. Since 2003, a variety of lifestyle goods including eyewear, smartphones, and watches have been sold under the Porsche name. Its most noteworthy project is the Porsche Design Tower Miami, a residential skyscraper which features a robotic car elevator.
Finally, electric vehicle (EV) maker Tesla earns additional revenues by selling carbon credits to other automakers that fail to meet government-imposed quotas on EV sales. Since Tesla only produces EVs, it has no need for its credits and is free to sell them. In the second quarter of 2020, Tesla earned $428 million from selling carbon credits, representing 7% of its total revenues for the period.
The Road Ahead
Additional revenue streams are continuing to open up as automakers integrate new technologies into their cars.
Cadillac and Tesla, two American brands, have both announced that their self-driving capabilities will eventually become a paid subscription service. Meanwhile, Germany’s premium automakers are expanding into wireless services. BMW claims it will become the first automaker to offer 5G connectivity in its cars, while Mercedes now sells downloadable software packages to enhance a driver’s experience.
While it’s too early to say whether or not these services will have a significant impact on an automaker’s bottom line, forecasts claim this so-called “connected car market” will be worth $166 billion by 2025. To put that into perspective, that’s more than half of Volkswagen’s gross revenue in 2019, or $5,264 per second.


Lithium
Ranked: The Top 10 EV Battery Manufacturers in 2023
Asia dominates this ranking of the world’s largest EV battery manufacturers in 2023.


The Top 10 EV Battery Manufacturers in 2023
This was originally posted on our Voronoi app. Download the app for free on iOS or Android and discover incredible data-driven charts from a variety of trusted sources.
Despite efforts from the U.S. and EU to secure local domestic supply, all major EV battery manufacturers remain based in Asia.
In this graphic we rank the top 10 EV battery manufacturers by total battery deployment (measured in megawatt-hours) in 2023. The data is from EV Volumes.
Chinese Dominance
Contemporary Amperex Technology Co. Limited (CATL) has swiftly risen in less than a decade to claim the title of the largest global battery group.
The Chinese company now has a 34% share of the market and supplies batteries to a range of made-in-China vehicles, including the Tesla Model Y, SAIC’s MG4/Mulan, and various Li Auto models.
| Company | Country | 2023 Production (megawatt-hour) | Share of Total Production |
|---|---|---|---|
| CATL | 🇨🇳 China | 242,700 | 34% |
| BYD | 🇨🇳 China | 115,917 | 16% |
| LG Energy Solution | 🇰🇷 Korea | 108,487 | 15% |
| Panasonic | 🇯🇵 Japan | 56,560 | 8% |
| SK On | 🇰🇷 Korea | 40,711 | 6% |
| Samsung SDI | 🇰🇷 Korea | 35,703 | 5% |
| CALB | 🇨🇳 China | 23,493 | 3% |
| Farasis Energy | 🇨🇳 China | 16,527 | 2% |
| Envision AESC | 🇨🇳 China | 8,342 | 1% |
| Sunwoda | 🇨🇳 China | 6,979 | 1% |
| Other | - | 56,040 | 8% |
In 2023, BYD surpassed LG Energy Solution to claim second place. This was driven by demand from its own models and growth in third-party deals, including providing batteries for the made-in-Germany Tesla Model Y, Toyota bZ3, Changan UNI-V, Venucia V-Online, as well as several Haval and FAW models.
The top three battery makers (CATL, BYD, LG) collectively account for two-thirds (66%) of total battery deployment.
Once a leader in the EV battery business, Panasonic now holds the fourth position with an 8% market share, down from 9% last year. With its main client, Tesla, now sourcing batteries from multiple suppliers, the Japanese battery maker seems to be losing its competitive edge in the industry.
Overall, the global EV battery market size is projected to grow from $49 billion in 2022 to $98 billion by 2029, according to Fortune Business Insights.

-

 Science7 days ago
Visualizing the Average Lifespans of Mammals
-

 Markets2 weeks ago
The Top 10 States by Real GDP Growth in 2023
-

 Demographics2 weeks ago
The Smallest Gender Wage Gaps in OECD Countries
-

 United States2 weeks ago
Where U.S. Inflation Hit the Hardest in March 2024
-

 Green2 weeks ago
Top Countries By Forest Growth Since 2001
-

 United States2 weeks ago
Ranked: The Largest U.S. Corporations by Number of Employees
-

 Maps2 weeks ago
The Largest Earthquakes in the New York Area (1970-2024)
-

 Green2 weeks ago
Ranked: The Countries With the Most Air Pollution in 2023