COVID-19
Visualized: A Global Risk Assessment of 2021 And Beyond
How to Use: The below maps will animate automatically. To pause, move your cursor on the image. Arrows on left/right navigate.

Visualized: A Global Risk Assessment of 2021 And Beyond
Risk is all around us. After the events of 2020, it’s not surprising that the level and variety of risks we face have become more pronounced than ever.
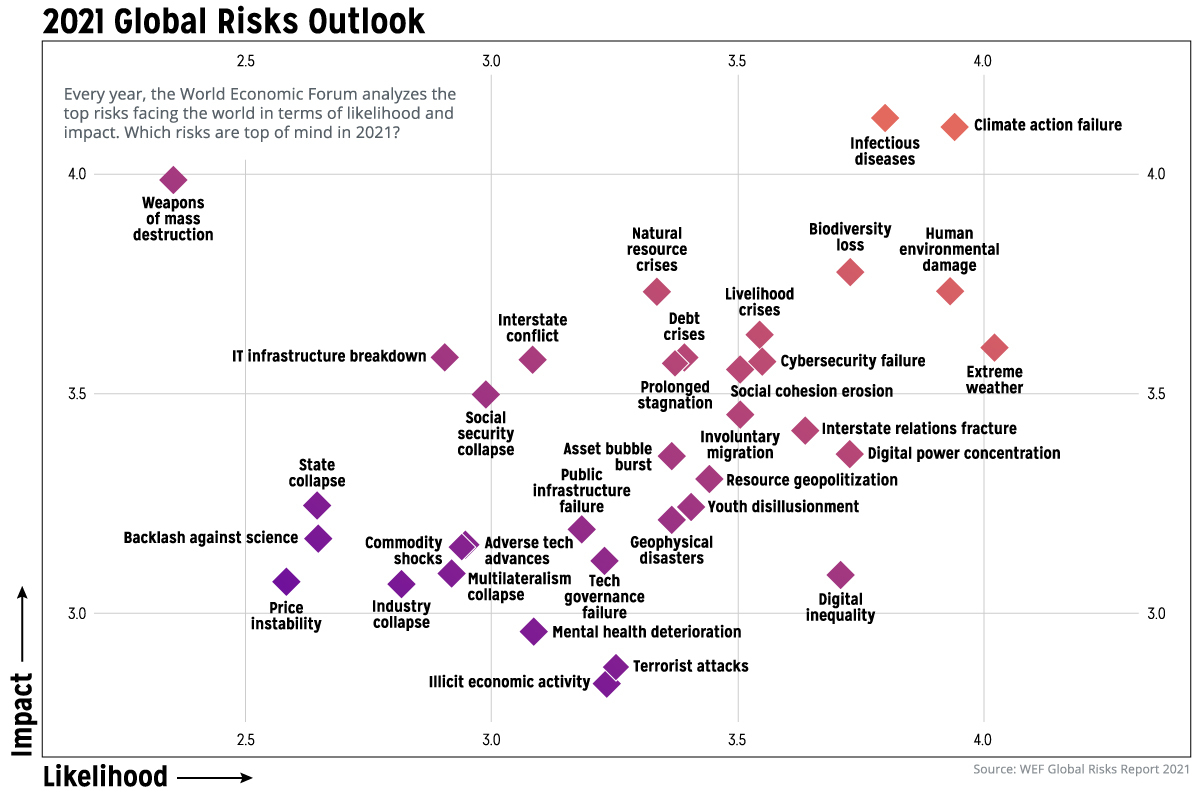
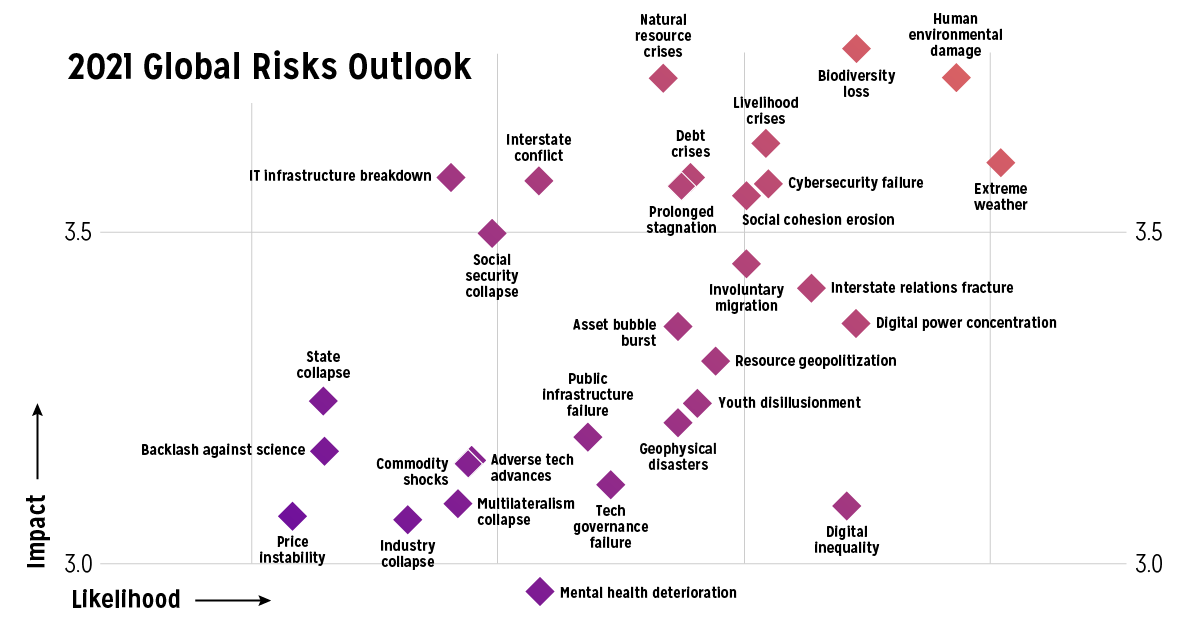
Every year, the World Economic Forum analyzes the top risks in the world in its Global Risks Report. Risks were identified based on 800+ responses of surveyed leaders across various levels of expertise, organizations, and regional distribution.
Which risks are top of mind in 2021?
The World’s Top Risks by Likelihood and Impact
According to WEF’s risk assessment methodology, all the global risks in 2021 fall into the following broad categories:
- 🔵 Economic
- 🟢 Environmental
- 🟠 Geopolitical
- 🔴 Societal
- 🟣 Technological
It goes without saying that infectious diseases have now become one of the top societal risks on both metrics of likelihood and impact.
That said, environmental risks continue to dominate the leaderboard, accounting for five of the top 10 risks by impact, especially when it comes to climate action failure.
Several countries are off-track in meeting emissions goals set by the Paris Climate Agreement in 2015, while the pandemic has also delayed progress in the shift towards a carbon-neutral economy. Meanwhile, biodiversity loss is occurring at unprecedented rates.
| Rank | Top Risks by Likelihood | Top Risks by Impact |
|---|---|---|
| #1 | 🟢Extreme weather | 🔴Infectious diseases |
| #2 | 🟢Climate action failure | 🟢Climate action failure |
| #3 | 🟢Human environmental damage | 🟠Weapons of mass destruction |
| #4 | 🔴Infectious diseases | 🟢Biodiversity loss |
| #5 | 🟢Biodiversity loss | 🟢Natural resource crises |
| #6 | 🟣Digital power concentration | 🟢Human environmental damage |
| #7 | 🟣Digital inequality | 🔴Livelihood crises |
| #8 | 🟠Interstate relations fracture | 🟢Extreme weather |
| #9 | 🟣Cybersecurity failure | 🔵Debt crises |
| #10 | 🔴Livelihood crises | 🟣IT Infrastructure breakdown |
As for other risks, the prospect of weapons of mass destruction ranks in third place for potential impact. In the global arms race, a single misstep would trigger severe consequences on civil and political stability.
New Risks in 2021
While many of the risks included in the Global Risks Report 2021 are familiar to those who have read the editions of years past, there are a flurry of new entries to the list this year.
Here are some of the most interesting ones in the risk assessment, sorted by category:
Societal Risks
COVID-19 has resulted in a myriad of knock-on societal risks, from youth disillusionment and mental health deterioration to livelihood crises. The first two risks in particular go hand-in-hand, as “pandemials” (youth aged 15-24) are staring down a turbulent future. This generation is more likely to report high distress from disrupted educational and economic prospects.
At the same time, as countries prepare for widespread immunization against COVID-19, another related societal risk is the backlash against science. The WEF identifies vaccines and immunization as subjects susceptible to disinformation and denial of scientific evidence.
Economic Risks
As monetary stimulus was kicked into high gear to prop up markets and support many closed businesses and quarantined families, the economic outlook seems more fragile than ever. Debt-to-GDP ratios continue to rise across advanced economies—if GDP growth stagnates for too long, a potential debt crisis could see many businesses and major nations default on their debt.
With greater stress accumulating on a range of major industries such as travel and hospitality, the economy risks a build-up of “zombie” firms that drag down overall productivity. Despite this, market valuations and asset prices continue to rise, with equity markets rewarding investors betting on a swift recovery so far.
Technological Risks
Last but not least, COVID-19 has raised the alert on various technological risks. Despite the accelerated shift towards remote work and digitalization of entire industries, the reality is that digital inequality leaves those with lower digital literacy behind—worsening existing inequalities.
Big Tech is also bloating even further, growing its digital power concentration. The market share some companies hold in their respective sectors, such as Amazon in online retail, threatens to erode the agency of other players.
Assessing the Top 10 Risks On the Horizon
Back in mid-2020, the WEF attempted to quantify the biggest risks over an 18-month period, with a prolonged economic recession emerging on top.
In this report’s risk assessment, global risks are further classified by how soon their resulting threats are expected to occur. Weapons of mass destruction remain the top risk, though on a much longer scale of up to 10 years in the future.
| Rank | Risk | % | Time Horizon |
|---|---|---|---|
| #1 | 🟠Weapons of mass destruction | 62.7 | Long-term (5-10 years) |
| #2 | 🔴Infectious diseases | 58 | Short-term risks (0-2 years) |
| #3 | 🔴Livelihood crises | 55.1 | Short-term risks (0-2 years) |
| #4 | 🔵Asset bubble burst | 53.3 | Medium-term risks (3-5 years) |
| #5 | 🟣 IT infrastructure breakdown | 53.3 | Medium-term risks (3-5 years) |
| #6 | 🔵Price instability | 52.9 | Medium-term risks (3-5 years) |
| #7 | 🟢Extreme weather events | 52.7 | Short-term risks (0-2 years) |
| #8 | 🔵Commodity shocks | 52.7 | Medium-term risks (3-5 years) |
| #9 | 🔵Debt crises | 52.3 | Medium-term risks (3-5 years) |
| #10 | 🟠State collapse | 51.8 | Long-term (5-10 years) |
Through this perspective, COVID-19 (and its variants) remains high in the next two years as the world scrambles to return to normal.
It’s also clear that more economic risks are taking center stage, from an asset bubble burst to price instability that could have a profound effect over the next five years.
Healthcare
Visualizing How COVID-19 Antiviral Pills and Vaccines Work at the Cellular Level
Despite tackling the same disease, vaccines and antiviral pills work differently to combat COVID-19. We visualize how they work in the body.

Current Strategies to Tackle COVID-19
Since the pandemic started in 2020, a number of therapies have been developed to combat COVID-19.
The leading options for preventing infection include social distancing, mask-wearing, and vaccination. They are still recommended during the upsurge of the coronavirus’s latest mutation, the Omicron variant.
But in December 2021, The United States Food and Drug Administration (USDA) granted Emergency Use Authorization to two experimental pills for the treatment of new COVID-19 cases.
These medications, one made by Pfizer and the other by Merck & Co., hope to contribute to the fight against the coronavirus and its variants. Alongside vaccinations, they may help to curb extreme cases of COVID-19 by reducing the need for hospitalization.
Despite tackling the same disease, vaccines and pills work differently:
| Vaccines | Pills |
|---|---|
| Taken by injection | Taken by mouth |
| Used for prevention | Used for treatment only |
| Create an enhanced immune system by stimulating antibody production | Disrupt the assembly of new viral particles |
How a Vaccine Helps Prevent COVID-19
The main purpose of a vaccine is to prewarn the body of a potential COVID-19 infection by creating antibodies that target and destroy the coronavirus.
In order to do this, the immune system needs an antigen.
It’s difficult to do this risk-free since all antigens exist directly on a virus. Luckily, vaccines safely expose antigens to our immune systems without the dangerous parts of the virus.
In the case of COVID-19, the coronavirus’s antigen is the spike protein that covers its outer surface. Vaccines inject antigen-building instructions* and use our own cellular machinery to build the coronavirus antigen from scratch.
When exposed to the spike protein, the immune system begins to assemble antigen-specific antibodies. These antibodies wait for the opportunity to attack the real spike protein when a coronavirus enters the body. Since antibodies decrease over time, booster immunizations help to maintain a strong line of defense.
*While different vaccine technologies exist, they all do a similar thing: introduce an antigen and build a stronger immune system.
How COVID Antiviral Pills Work
Antiviral pills, unlike vaccines, are not a preventative strategy. Instead, they treat an infected individual experiencing symptoms from the virus.
Two drugs are now entering the market. Merck & Co.’s Lagevrio®, composed of one molecule, and Pfizer’s Paxlovid®, composed of two.
These medications disrupt specific processes in the viral assembly line to choke the virus’s ability to replicate.
The Mechanism of Molnupiravir
RNA-dependent RNA Polymerase (RdRp) is a cellular component that works similar to a photocopying machine for the virus’s genetic instructions. An infected host cell is forced to produce RdRp, which starts generating more copies of the virus’s RNA.
Molnupiravir, developed by Merck & Co., is a polymerase inhibitor. It inserts itself into the viral instructions that RdRp is copying, jumbling the contents. The RdRp then produces junk.
The Mechanism of Nirmatrelvir + Ritonavir
A replicating virus makes proteins necessary for its survival in a large, clumped mass called a polyprotein. A cellular component called a protease cuts a virus’s polyprotein into smaller, workable pieces.
Pfizer’s antiviral medication is a protease inhibitor made of two pills:
- The first pill, nirmatrelvir, stops protease from cutting viral products into smaller pieces.
- The second pill, ritonavir, protects nirmatrelvir from destruction by the body and allows it to keep working.
With a faulty polymerase or a large, unusable polyprotein, antiviral medications make it difficult for the coronavirus to replicate. If treated early enough, they can lessen the virus’s impact on the body.
The Future of COVID Antiviral Pills and Medications
Antiviral medications seem to have a bright future ahead of them.
COVID-19 antivirals are based on early research done on coronaviruses from the 2002-04 SARS-CoV and the 2012 MERS-CoV outbreaks. Current breakthroughs in this technology may pave the way for better pharmaceuticals in the future.
One half of Pfizer’s medication, ritonavir, currently treats many other viruses including HIV/AIDS.
Gilead Science is currently developing oral derivatives of remdesivir, another polymerase inhibitor currently only offered to inpatients in the United States.
More coronavirus antivirals are currently in the pipeline, offering a glimpse of control on the looming presence of COVID-19.
Author’s Note: The medical information in this article is an information resource only, and is not to be used or relied on for any diagnostic or treatment purposes. Please talk to your doctor before undergoing any treatment for COVID-19. If you become sick and believe you may have symptoms of COVID-19, please follow the CDC guidelines.
-

 Education1 week ago
How Hard Is It to Get Into an Ivy League School?
-

 Technology2 weeks ago
Ranked: Semiconductor Companies by Industry Revenue Share
-

 Markets2 weeks ago
Ranked: The World’s Top Flight Routes, by Revenue
-

 Demographics2 weeks ago
Population Projections: The World’s 6 Largest Countries in 2075
-

 Markets2 weeks ago
The Top 10 States by Real GDP Growth in 2023
-

 Demographics2 weeks ago
The Smallest Gender Wage Gaps in OECD Countries
-

 Economy2 weeks ago
Where U.S. Inflation Hit the Hardest in March 2024
-

 Green2 weeks ago
Top Countries By Forest Growth Since 2001


