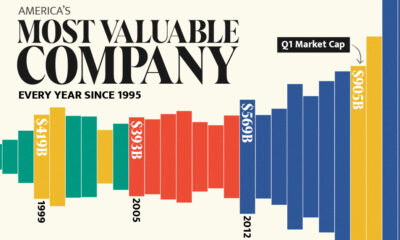

Over the last three decades, the growth of tech companies has driven a shift in the ranking of the most valuable companies in the U.S.
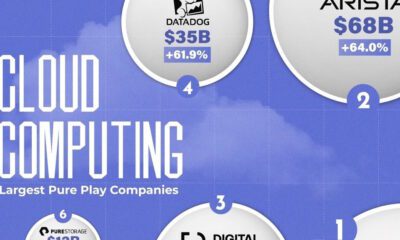

This graphic highlights the largest pure play cloud computing companies by market cap and annual return as of November 2023.
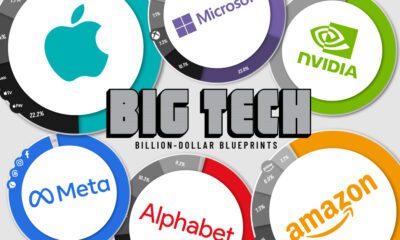

Thanks to the ubiquity of their products and services, these Big Tech companies have revenues bigger than many national GDPs.
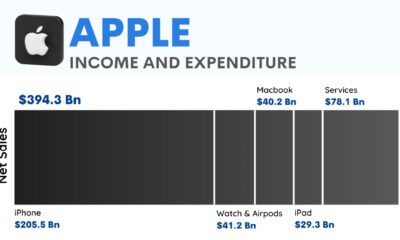

How does the world's largest tech company make its billions? This graphic charts Apple's profit in 2022 totaling $100 billion.
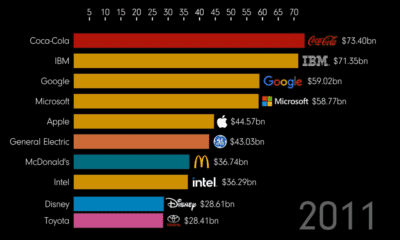

How much money is in a brand? And which brands have risen and fallen? This animation tracks the most valuable brands over 20+ years
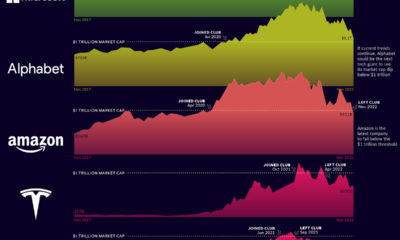

Economic woes and Fed tightening have taken their toll on the world's most valuable companies. Here's who is still part of the $1T club, and who's...
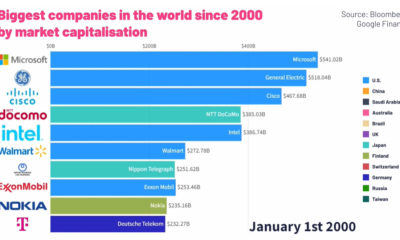

This animated graphic provides a breakdown of the world’s top ten largest public companies from 2000 to 2022.
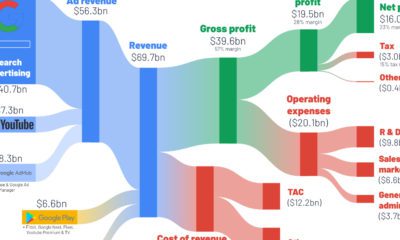

How do the big tech giants make their money? This series of graphics shows a breakdown of big tech revenue, using Q2 2022 income statements.


This series of visualizations uses Google trends search data to show the most googled countries around the world, from 2004 to 2022.
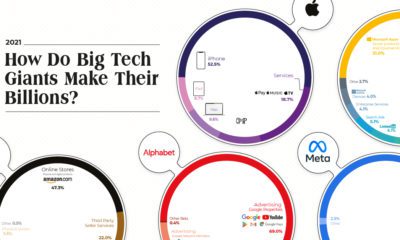

The Big Five tech companies made $1.4 trillion in revenue combined—more than Mexico’s entire GDP. Here's how they earned it all.


 Creator Program