Culture
Visualized: The Most Googled Countries
Article/Editing:
View a higher resolution version of this network diagram.
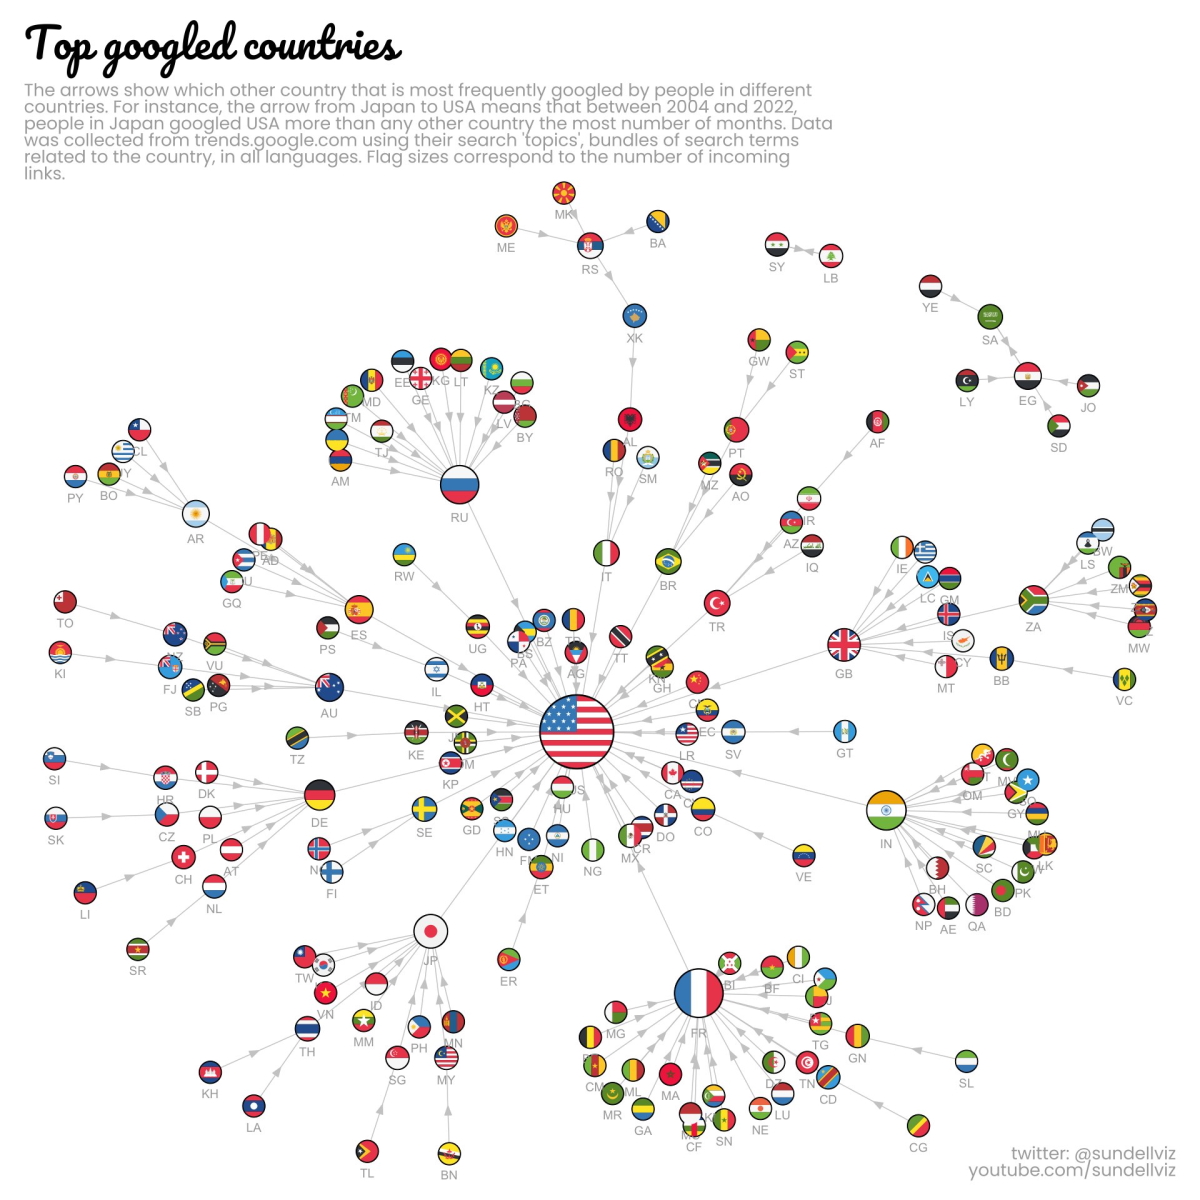
Visualized: The Most Googled Countries, Worldwide
View a higher resolution version of this network diagram.
Analyzing societal trends can teach us a lot about a population’s cultural fabric.
And since Google makes up more than 90% of internet searches outside of the Great Firewall, studying its usage is one of the best resources for modern social research.
This series of visualizations by Anders Sundell uses Google Trends search data to show the most googled countries around the world, from 2004 to 2022. These graphics provide thought-provoking insight into different cultural similarities and geopolitical dynamics.
A Quick Note on Methodology
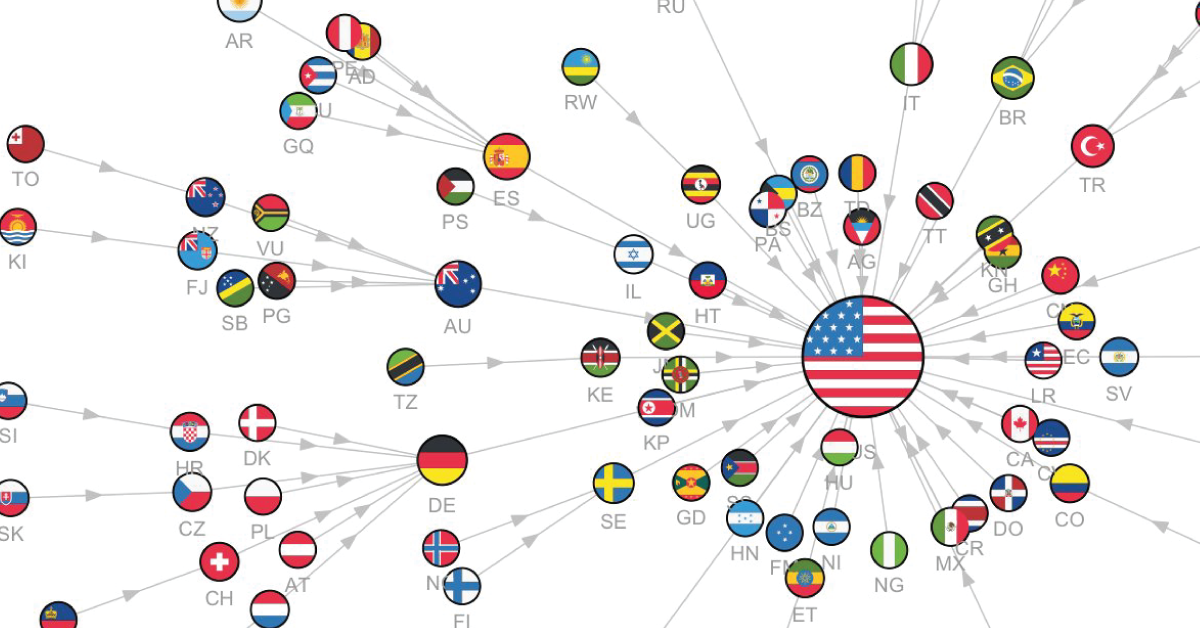
The visualization above shows the most googled country in each nation around the world over the last couple of decades.
For example, the arrow pointing from Canada to the United States means that, between 2004 and 2022, people in Canada had more searches about the U.S. than any other country globally.
And since this study only looked at interest in other countries, queries of countries searching for themselves were not included in the data.
Finally, each country’s circle is scaled relative to its search interest, meaning the bigger the circle, the more countries pointing to it (and searching for it).
The Top Googled Countries Overall
Perhaps unsurprisingly, the U.S. is the most googled country on the list, ranking first place in 45 of the 190 countries included in the dataset.
| Country | Top Googled Country |
|---|---|
| 🇦🇩 Andorra | 🇪🇸 Spain |
| 🇦🇪 The United Arab Emirates | 🇮🇳 India |
| 🇦🇫 Afghanistan | 🇮🇷 Iran |
| 🇦🇬 Antigua and Barbuda | 🇺🇸 The United States |
| 🇦🇱 Albania | 🇮🇹 Italy |
| 🇦🇲 Armenia | 🇷🇺 Russia |
| 🇦🇴 Angola | 🇧🇷 Brazil |
| 🇦🇷 Argentina | 🇪🇸 Spain |
| 🇦🇹 Austria | 🇩🇪 Germany |
| 🇦🇺 Australia | 🇺🇸 The United States |
| 🇦🇿 Azerbaijan | 🇹🇷 Turkey |
| 🏴 Bosnia and Herzegovina | 🇷🇴 Romania |
| 🇧🇧 Barbados | 🇬🇧 United Kingdom |
| 🇧🇩 Bangladesh | 🇮🇳 India |
| 🇧🇪 Belgium | 🇫🇷 France |
| 🇧🇫 Burkina Faso | 🇫🇷 France |
| 🇧🇬 Bulgaria | 🇷🇺 Russia |
| 🇧🇭 Bahrain | 🇮🇳 India |
| 🇧🇮 Burundi | 🇫🇷 France |
| 🇧🇯 Benin | 🇫🇷 France |
| 🇧🇳 Brunei | 🇲🇾 Malaysia |
| 🇧🇴 Bolivia | 🇦🇷 Argentina |
| 🇧🇷 Brazil | 🇺🇸 The United States |
| 🇧🇸 The Bahamas | 🇺🇸 The United States |
| 🇧🇹 Bhutan | 🇮🇳 India |
| 🇧🇼 Botswana | 🇿🇦 South Africa |
| 🇧🇾 Belarus | 🇷🇺 Russia |
| 🇧🇿 Belize | 🇺🇸 The United States |
| 🇨🇦 Canada | 🇺🇸 The United States |
| 🇨🇩 The Democratic Republic of Congo | 🇫🇷 France |
| 🇨🇫 The Central African Republic | 🇫🇷 France |
| 🇨🇬 The Congo | 🇨🇩 The Democratic Republic of Congo |
| 🇨🇭 Switzerland | 🇩🇪 Germany |
| 🇨🇮 Côte d'Ivoire | 🇫🇷 France |
| 🇨🇱 Chile | 🇦🇷 Argentina |
| 🇨🇲 Cameroon | 🇫🇷 France |
| 🇨🇳 China | 🇺🇸 The United States |
| 🇨🇴 Colombia | 🇺🇸 The United States |
| 🇨🇷 Costa Rica | 🇺🇸 The United States |
| 🇨🇺 Cuba | 🇪🇸 Spain |
| 🇨🇻 Cabo Verde | 🇺🇸 The United States |
| 🇨🇾 Cyprus | 🇬🇧 United Kingdom |
| 🇨🇿 Czechia | 🇩🇪 Germany |
| 🇩🇪 Germany | 🇺🇸 The United States |
| 🇩🇯 Djibouti | 🇫🇷 France |
| 🇩🇰 Denmark | 🇩🇪 Germany |
| 🇩🇲 Dominica | 🇺🇸 The United States |
| 🇩🇴 The Dominican Republic | 🇺🇸 The United States |
| 🇩🇿 Algeria | 🇫🇷 France |
| 🇪🇨 Ecuador | 🇺🇸 The United States |
| 🇪🇪 Estonia | 🇷🇺 Russia |
| 🇪🇬 Egypt | 🇸🇦 Saudi Arabia |
| 🇪🇷 Eritrea | 🇪🇹 Ethiopia |
| 🇪🇸 Spain | 🇺🇸 The United States |
| 🇪🇹 Ethiopia | 🇺🇸 The United States |
| 🇫🇮 Finland | 🇸🇪 Sweden |
| 🇫🇯 Fiji | 🇦🇺 Australia |
| 🇫🇲 Micronesia | 🇺🇸 The United States |
| 🇫🇷 France | 🇺🇸 The United States |
| 🇬🇦 Gabon | 🇫🇷 France |
| 🇬🇧 United Kingdom | 🇺🇸 The United States |
| 🇬🇩 Grenada | 🇺🇸 The United States |
| 🇬🇪 Georgia | 🇷🇺 Russia |
| 🇬🇭 Ghana | 🇺🇸 The United States |
| 🇬🇲 Gambia | 🇬🇧 United Kingdom |
| 🇬🇳 Guinea | 🇫🇷 France |
| 🇬🇶 Equatorial Guinea | 🇪🇸 Spain |
| 🇬🇷 Greece | 🇬🇧 United Kingdom |
| 🇬🇹 Guatemala | 🇸🇻 El Salvador |
| 🇬🇼 Guinea-Bissau | 🇵🇹 Portugal |
| 🇬🇾 Guyana | 🇮🇳 India |
| 🇭🇳 Honduras | 🇺🇸 The United States |
| 🇭🇷 Croatia | 🇩🇪 Germany |
| 🇭🇹 Haiti | 🇺🇸 The United States |
| 🇭🇺 Hungary | 🇺🇸 The United States |
| 🇮🇩 Indonesia | 🇯🇵 Japan |
| 🇮🇪 Ireland | 🇬🇧 United Kingdom |
| 🇮🇱 Israel | 🇺🇸 The United States |
| 🇮🇳 India | 🇺🇸 The United States |
| 🇮🇶 Iraq | 🇹🇷 Turkey |
| 🇮🇷 Iran | 🇹🇷 Turkey |
| 🇮🇸 Iceland | 🇬🇧 United Kingdom |
| 🇮🇹 Italy | 🇺🇸 The United States |
| 🇯🇲 Jamaica | 🇺🇸 The United States |
| 🇯🇴 Jordan | 🇪🇬 Egypt |
| 🇯🇵 Japan | 🇺🇸 The United States |
| 🇰🇪 Kenya | 🇺🇸 The United States |
| 🇰🇬 Kyrgyzstan | 🇷🇺 Russia |
| 🇰🇭 Cambodia | 🇹🇭 Thailand |
| 🇰🇮 Kiribati | 🇫🇯 Fiji |
| 🇰🇲 Comoros | 🇫🇷 France |
| 🇰🇳 Saint Kitts and Nevis | 🇺🇸 The United States |
| 🇰🇵 North Korea | 🇺🇸 The United States |
| 🇰🇷 South Korea | 🇯🇵 Japan |
| 🇰🇼 Kuwait | 🇮🇳 India |
| 🇰🇿 Kazakhstan | 🇷🇺 Russia |
| 🇱🇦 Laos | 🇹🇭 Thailand |
| 🇱🇧 Lebanon | 🇸🇾 Syria |
| 🇱🇨 Saint Lucia | 🇬🇧 United Kingdom |
| 🇱🇮 Liechtenstein | 🇨🇭 Switzerland |
| 🇱🇰 Sri Lanka | 🇮🇳 India |
| 🇱🇷 Liberia | 🇺🇸 The United States |
| 🇱🇸 Lesotho | 🇿🇦 South Africa |
| 🇱🇹 Lithuania | 🇷🇺 Russia |
| 🇱🇺 Luxembourg | 🇫🇷 France |
| 🇱🇻 Latvia | 🇷🇺 Russia |
| 🇱🇾 Libya | 🇪🇬 Egypt |
| 🇲🇦 Morocco | 🇫🇷 France |
| 🇲🇨 Monaco | 🇫🇷 France |
| 🇲🇩 Moldova | 🇷🇺 Russia |
| 🇲🇪 Montenegro | 🇷🇸 Serbia |
| 🇲🇬 Madagascar | 🇫🇷 France |
| 🇲🇰 Republic of North Macedonia | 🇷🇸 Serbia |
| 🇲🇱 Mali | 🇫🇷 France |
| 🇲🇲 Myanmar | 🇯🇵 Japan |
| 🇲🇳 Mongolia | 🇯🇵 Japan |
| 🇲🇷 Mauritania | 🇫🇷 France |
| 🇲🇹 Malta | 🇬🇧 United Kingdom |
| 🇲🇺 Mauritius | 🇮🇳 India |
| 🇲🇻 Maldives | 🇮🇳 India |
| 🇲🇼 Malawi | 🇿🇦 South Africa |
| 🇲🇽 Mexico | 🇺🇸 The United States |
| 🇲🇾 Malaysia | 🇯🇵 Japan |
| 🇲🇿 Mozambique | 🇧🇷 Brazil |
| 🇳🇪 The Niger | 🇫🇷 France |
| 🇳🇬 Nigeria | 🇺🇸 The United States |
| 🇳🇮 Nicaragua | 🇺🇸 The United States |
| 🇳🇱 The Netherlands | 🇩🇪 Germany |
| 🇳🇴 Norway | 🇸🇪 Sweden |
| 🇳🇵 Nepal | 🇮🇳 India |
| 🇳🇿 New Zealand | 🇦🇺 Australia |
| 🇴🇲 Oman | 🇮🇳 India |
| 🇵🇦 Panama | 🇺🇸 The United States |
| 🇵🇪 Peru | 🇪🇸 Spain |
| 🇵🇬 Papua New Guinea | 🇦🇺 Australia |
| 🇵🇭 The Philippines | 🇯🇵 Japan |
| 🇵🇰 Pakistan | 🇮🇳 India |
| 🇵🇱 Poland | 🇩🇪 Germany |
| 🇵🇸 Palestine | 🇮🇱 Israel |
| 🇵🇹 Portugal | 🇧🇷 Brazil |
| 🇵🇾 Paraguay | 🇦🇷 Argentina |
| 🇶🇦 Qatar | 🇮🇳 India |
| 🇷🇴 Romania | 🇮🇹 Italy |
| 🇷🇸 Serbia | 🇽🇰 Kosovo |
| 🇷🇺 Russia | 🇺🇸 The United States |
| 🇷🇼 Rwanda | 🇺🇬 Uganda |
| 🇸🇦 Saudi Arabia | 🇪🇬 Egypt |
| 🇸🇧 Solomon Islands | 🇦🇺 Australia |
| 🇸🇨 Seychelles | 🇮🇳 India |
| 🇸🇩 Sudan | 🇪🇬 Egypt |
| 🇸🇪 Sweden | 🇺🇸 The United States |
| 🇸🇬 Singapore | 🇯🇵 Japan |
| 🇸🇮 Slovenia | 🇭🇷 Croatia |
| 🇸🇰 Slovakia | 🇨🇿 Czechia |
| 🇸🇱 Sierra Leone | 🇬🇳 Guinea |
| 🇸🇲 San Marino | 🇮🇹 Italy |
| 🇸🇳 Senegal | 🇫🇷 France |
| 🇸🇴 Somalia | 🇮🇳 India |
| 🇸🇷 Suriname | 🇳🇱 The Netherlands |
| 🇸🇸 South Sudan | 🇺🇸 The United States |
| 🇸🇹 Sao Tome and Principe | 🇵🇹 Portugal |
| 🇸🇻 El Salvador | 🇺🇸 The United States |
| 🇸🇾 Syria | 🇱🇧 Lebanon |
| 🇸🇿 Eswatini | 🇿🇦 South Africa |
| 🇹🇩 Chad | 🇺🇸 The United States |
| 🇹🇬 Togo | 🇫🇷 France |
| 🇹🇭 Thailand | 🇯🇵 Japan |
| 🇹🇯 Tajikistan | 🇷🇺 Russia |
| 🇹🇱 Timor-Leste | 🇸🇬 Singapore |
| 🇹🇲 Turkmenistan | 🇷🇺 Russia |
| 🇹🇳 Tunisia | 🇫🇷 France |
| 🇹🇴 Tonga | 🇳🇿 New Zealand |
| 🇹🇷 Turkey | 🇺🇸 The United States |
| 🇹🇹 Trinidad and Tobago | 🇺🇸 The United States |
| 🇹🇼 Taiwan | 🇯🇵 Japan |
| 🇹🇿 Tanzania | 🇰🇪 Kenya |
| 🇺🇦 Ukraine | 🇷🇺 Russia |
| 🇺🇬 Uganda | 🇺🇸 The United States |
| 🇺🇸 The United States | 🇲🇽 Mexico |
| 🇺🇾 Uruguay | 🇦🇷 Argentina |
| 🇺🇿 Uzbekistan | 🇷🇺 Russia |
| 🇻🇨 Saint Vincent and the Grenadines | 🇧🇧 Barbados |
| 🇻🇪 Venezuela | 🇨🇴 Colombia |
| 🇻🇳 Vietnam | 🇯🇵 Japan |
| 🇻🇺 Vanuatu | 🇦🇺 Australia |
| 🇽🇰 Kosovo | 🇦🇱 Albania |
| 🇾🇪 Yemen | 🇸🇦 Saudi Arabia |
| 🇿🇦 South Africa | 🇬🇧 United Kingdom |
| 🇿🇲 Zambia | 🇿🇦 South Africa |
| 🇿🇼 Zimbabwe | 🇿🇦 South Africa |
While it’s the top googled country in neighboring places like Canada and Mexico, it’s also number one in countries much farther away like Nigeria, Sweden, and Australia.
The U.S. is currently the world’s largest economy by nominal GDP, and one of the biggest cultural influences globally. However, it’s worth noting that China, the world’s second-largest economy and the most populated, had very little search interest in comparison, at least based on Google Trends data.
Zooming into Specific Regions
In addition to the network map highlighting the overall top googled countries, Sundell created a series of videos breaking down the data monthly, by regions. Here are the videos for the U.S., Europe, and Asia.
The United States
Since 2004, there have been a high number of searches for Canada, Mexico and India in America.
The searches for Mexico seem to be concentrated in the Western U.S., which is also where a large portion of the country’s Hispanic population lives. In contrast, searches for India seem to come mostly from the eastern side of the country.
Europe
The U.S. is by the far the most commonly googled country across Europe, ranking number one consistently over the last two decades.
However, Russia stole the limelight in 2014, the year that they invaded and ultimately annexed Crimea.
Asia
In the early 2000s, the U.S. held the top googled spot in Asia, but over time, relative searches for the U.S. go down. India stole the top spot to become the most googled country in Asia for a majority of the 2010s.
One anomaly occurred when Japan briefly took the top spot in March 2011, which is when a magnitude 9.0 earthquake hit the northern coast of Japan, causing a devastating tsunami.
What will future search results reveal about the global landscape? Were any of the results surprising?

This article was published as a part of Visual Capitalist's Creator Program, which features data-driven visuals from some of our favorite Creators around the world.


Brands
How Tech Logos Have Evolved Over Time
From complete overhauls to more subtle tweaks, these tech logos have had quite a journey. Featuring: Google, Apple, and more.


How Tech Logos Have Evolved Over Time
This was originally posted on our Voronoi app. Download the app for free on iOS or Android and discover incredible data-driven charts from a variety of trusted sources.
One would be hard-pressed to find a company that has never changed its logo. Granted, some brands—like Rolex, IBM, and Coca-Cola—tend to just have more minimalistic updates. But other companies undergo an entire identity change, thus necessitating a full overhaul.
In this graphic, we visualized the evolution of prominent tech companies’ logos over time. All of these brands ranked highly in a Q1 2024 YouGov study of America’s most famous tech brands. The logo changes are sourced from 1000logos.net.
How Many Times Has Google Changed Its Logo?
Google and Facebook share a 98% fame rating according to YouGov. But while Facebook’s rise was captured in The Social Network (2010), Google’s history tends to be a little less lionized in popular culture.
For example, Google was initially called “Backrub” because it analyzed “back links” to understand how important a website was. Since its founding, Google has undergone eight logo changes, finally settling on its current one in 2015.
| Company | Number of Logo Changes |
|---|---|
| 8 | |
| HP | 8 |
| Amazon | 6 |
| Microsoft | 6 |
| Samsung | 6 |
| Apple | 5* |
Note: *Includes color changes. Source: 1000Logos.net
Another fun origin story is Microsoft, which started off as Traf-O-Data, a traffic counter reading company that generated reports for traffic engineers. By 1975, the company was renamed. But it wasn’t until 2012 that Microsoft put the iconic Windows logo—still the most popular desktop operating system—alongside its name.
And then there’s Samsung, which started as a grocery trading store in 1938. Its pivot to electronics started in the 1970s with black and white television sets. For 55 years, the company kept some form of stars from its first logo, until 1993, when the iconic encircled blue Samsung logo debuted.
Finally, Apple’s first logo in 1976 featured Isaac Newton reading under a tree—moments before an apple fell on his head. Two years later, the iconic bitten apple logo would be designed at Steve Jobs’ behest, and it would take another two decades for it to go monochrome.

-

 Green1 week ago
Ranked: The Countries With the Most Air Pollution in 2023
-

 Automotive2 weeks ago
Almost Every EV Stock is Down After Q1 2024
-

 AI2 weeks ago
The Stock Performance of U.S. Chipmakers So Far in 2024
-

 Markets2 weeks ago
Charted: Big Four Market Share by S&P 500 Audits
-

 Real Estate2 weeks ago
Ranked: The Most Valuable Housing Markets in America
-

 Money2 weeks ago
Which States Have the Highest Minimum Wage in America?
-

 AI2 weeks ago
Ranked: Semiconductor Companies by Industry Revenue Share
-

 Travel2 weeks ago
Ranked: The World’s Top Flight Routes, by Revenue