Finance
The Stocks to Rule Them All: Big Tech’s Might in Five Charts
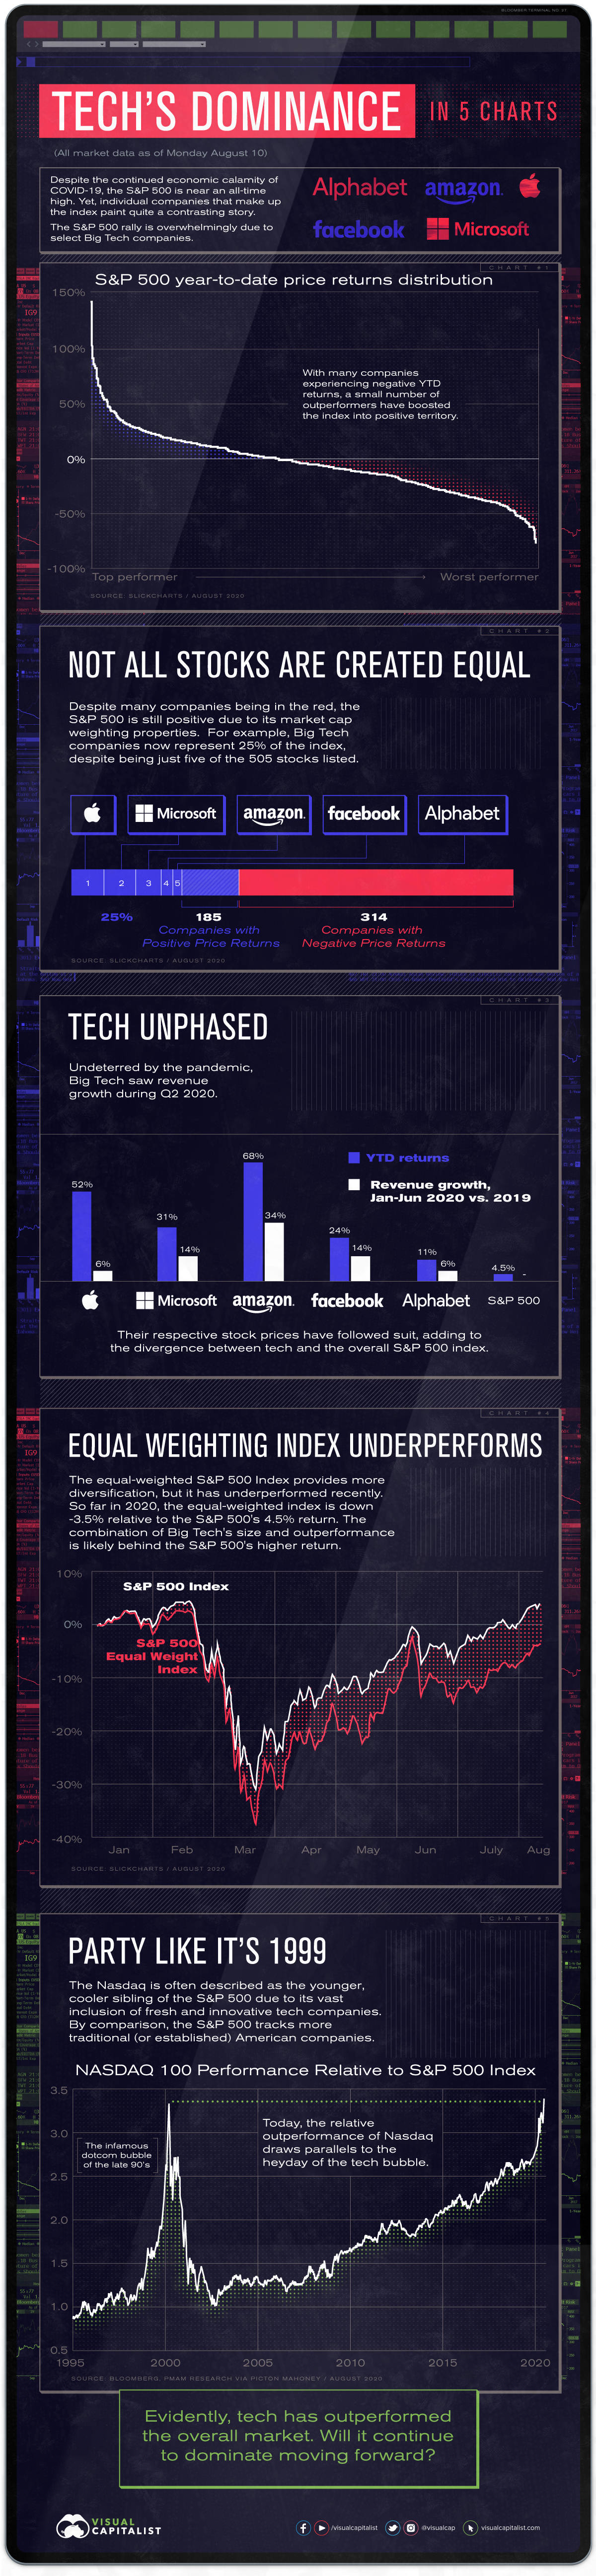


The Stocks to Rule them All: Big Tech’s Might in Five Charts
American’s tech giants have caught the public’s attention as of late.
Four of the Big Five recently appeared in front of U.S. Congress to discuss their anti-competitive business practices and privacy concerns.
Yet business is booming. Compared to the traditional economy, Big Tech operates within an intangible realm of business. This enables them to move faster, cheaper, and more profitably—with business models that possess widespread scale via the internet.
The above five charts are a reflection of Big Tech’s momentum and the significant role they have played in the swift and vigorous market recovery. Let’s take a closer look at the data.
| Company | Market Capitalization (In Billions) | Weighting in the S&P 500 Index |
|---|---|---|
| Apple | $1,930 | 7.1% |
| Microsoft | $1,590 | 5.9% |
| Amazon | $1,590 | 5.9% |
| Alphabet | $1,030 | 3.8% |
| $742 | 2.7% | |
| Total | $6,883 | 25.41% |
| S&P 500 | $27,050 | 100% |
Not All Stocks Are Created Equal
Of the 505 stocks that make up the S&P 500 Index, only about a third have experienced positive returns year-to-date (YTD), with the remaining stocks in the red.
Despite the majority of companies underperforming, the S&P 500 has generated a positive year-to-date return. This is due to the fact that companies are weighted according to market capitalization. For example, the Big Five now represent 25% of the index, despite being just five of the 505 stocks listed.
Big Tech’s dominance is being driven by ballooning market valuations. For instance, Apple reached the $1 trillion valuation in August 2018, and now the company is awfully close to topping the $2 trillion mark after just two years. This is just one of many examples that illustrate the growing power of Big Tech.
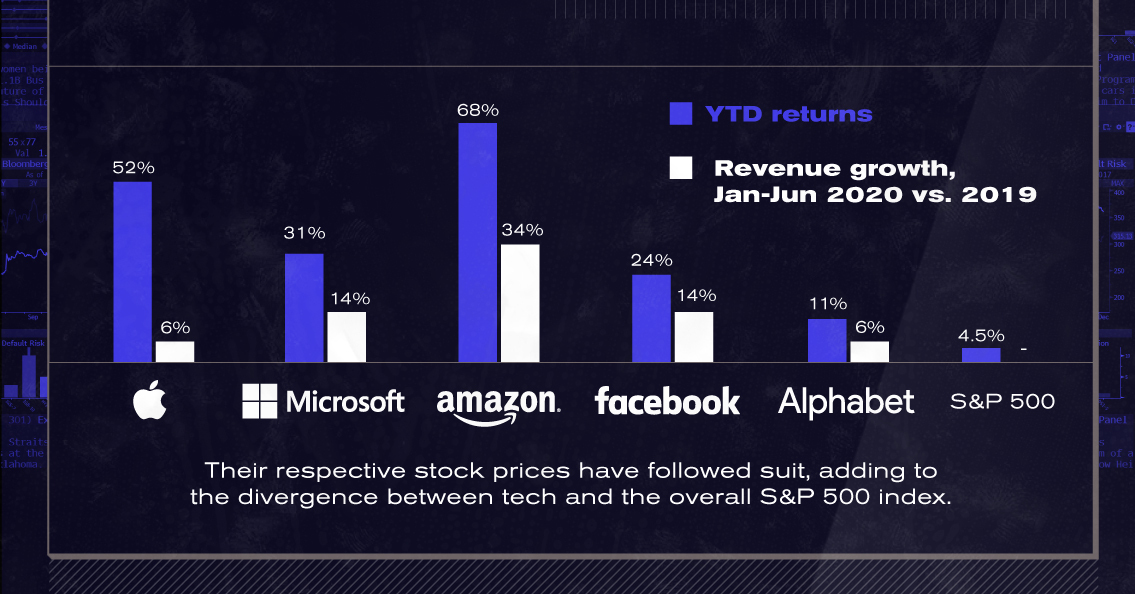
Pandemic Proof?
The five Big Tech companies are also seeing business as usual, with revenues in the first half of the year growing steadily compared to the first half of 2019.
| Company | YTD Price Returns | Revenue Growth (H1 2020 vs. 2019) |
|---|---|---|
| Apple | 52% | 6% |
| Microsoft | 31% | 14% |
| Amazon | 68% | 34% |
| 24% | 14% | |
| Alphabet | 11% | 6% |
| S&P 500 | 4.5% |
Their respective stock prices have followed suit, adding to the divergence between the performance of tech and the overall S&P 500 Index.
The equal-weighted S&P 500 Index provides diversification, but it has underperformed recently. Year-to-date, the equal-weighted index is down -3.5% relative to the positive 4.5% seen for the S&P 500, a spread of 8%. The combination of Big Tech’s outperformance and large weighting is likely behind the index staying afloat.
Dissecting the Disconnect
You may notice the phrase “stock market disconnect” reverberating recently, reflecting consumer views on the state of financial markets and their relationship with the economy, or lack thereof. While the economy combats record levels of unemployment and a plethora of bankruptcies, major American indexes edge closer to record highs.
This disconnect can be explained by the market capitalization weighted qualities of these indexes as well as the geographic source of company revenues in the S&P 500.
The most visible businesses to the everyday individual represent a small and vulnerable basket of companies that account for a undersized component of the stock market. No matter how clobbered they get, their effects on the market as a whole are miniscule.
A Global Footprint
In the era of globalization, American companies are more diversified than ever. Their revenue streams carry a greater global presence, meaning domestic revenues in the United States are less crucial than in times past. For example, the S&P 500’s foreign revenue exposure stands at 42.9% in 2018 and these figures are even higher for Big Tech stocks.
| Revenues Recognized Outside of North America/America | |
|---|---|
| Apple | 55% |
| Microsoft | 41% |
| Amazon | 31% |
| Alphabet | 51% |
| 54% | |
| Average | 46% |
Big Tech has outdone itself by virtually any measure.
They’ve shown their capacity to translate headwinds to tailwinds, even under challenging economic circumstances. Going forward, estimates by analysts on Wall Street suggest that even more growth for these companies could be on the horizon.


Business
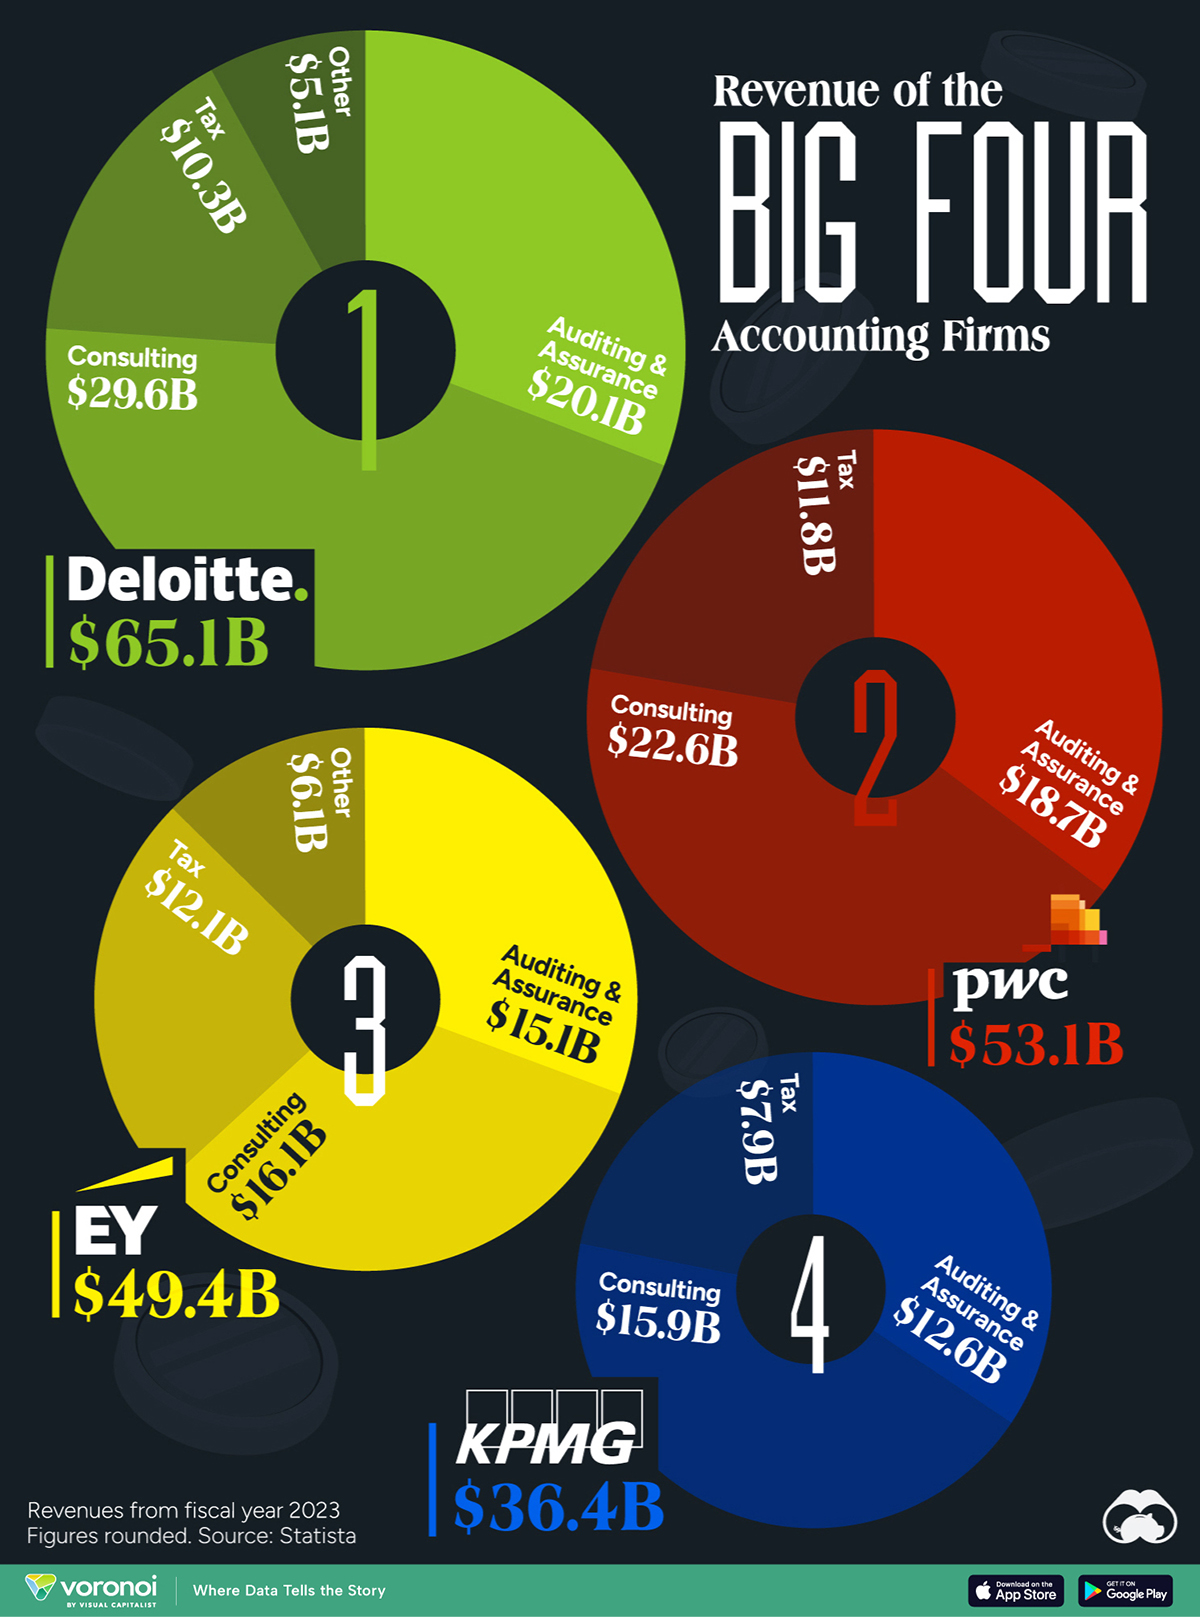
Visualizing the Revenue of the Big Four Accounting Firms
The Big Four accounting firms amassed over $200 billion in combined revenue in 2023.
Visualizing the Revenue of the Big Four Accounting Firms
This was originally posted on our Voronoi app. Download the app for free on iOS or Android and discover incredible data-driven charts from a variety of trusted sources.
The Big Four accounting firms – Deloitte, Ernst & Young (EY), PricewaterhouseCoopers (PwC), and KPMG – have solidified their positions as global industry leaders, boasting a combined revenue exceeding $200 billion in 2023.
Together, these firms audit the majority of publicly traded companies worldwide.
This infographic details the revenues of the “Big Four” accounting firms for the fiscal year 2023, based on data from Statista.
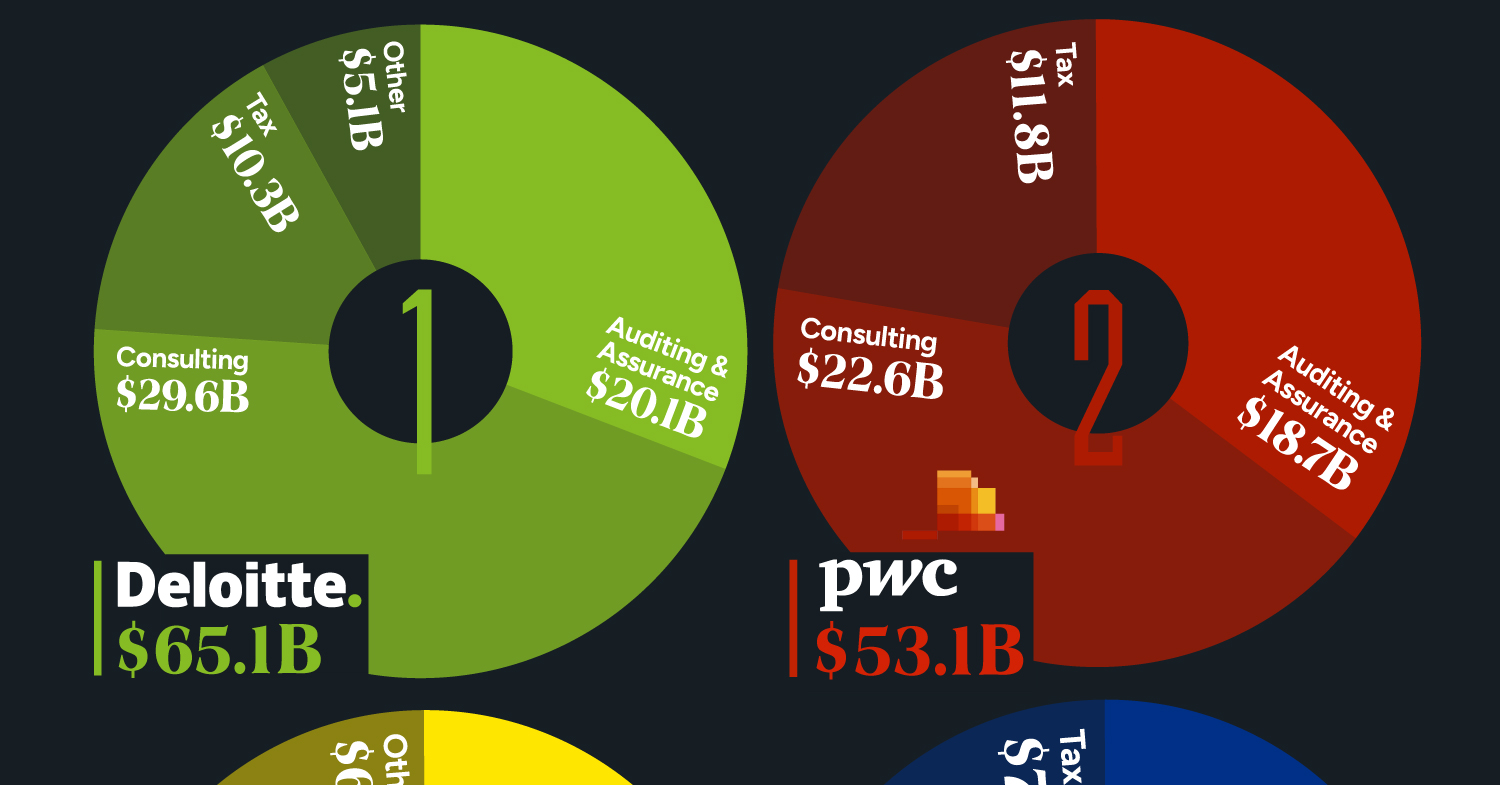
Deloitte Leads the Big Four in 2023 Revenues
Offering diverse services, the Big Four specialize in auditing and assurance, ensuring financial transparency, and regulatory compliance for their clients. Additionally, they provide strategic consulting services. All four are legally headquartered in the UK and command a dominant global market share.
| Company | Auditing & Assurance | Consulting | Tax | Other | Total ($ billions) |
|---|---|---|---|---|---|
| Deloitte | $20.1 | $29.6 | $10.3 | $5.1 | $65.1 |
| PwC | $18.7 | $22.6 | $11.8 | $53.1 | |
| EY | $15.1 | $16.1 | $12.1 | $6.1 | $49.4 |
| KPMG | $12.6 | $15.9 | $7.9 | $36.4 |
Interestingly, the largest accounting firms were formerly known as the “Big Eight,” but mergers and closures starting in the late 1980s have reduced their number to four.
The original group consisted of Arthur Andersen, Arthur Young, Coopers & Lybrand, Deloitte Haskin & Sells, Ernst & Whinney, Peat Marwick Mitchell, Price Waterhouse, and Touche Ross, all headquartered in the U.S. or UK.
Arthur Young merged with Ernst & Whinney, and Deloitte Haskin & Sells combined with Touche Ross. Subsequently, Price Waterhouse and Coopers & Lybrand merged their practices, reducing the count to five. However, following the collapse of Arthur Andersen due to its involvement in the Enron scandal, the “Big Five” became the present-day four.
The Scale of the Big Four
Deloitte is the largest in terms of headcount, with over 456,000 employees as of FY2023, followed by Ernst & Young with more than 395,000 workers, and PwC with 364,000. Despite being the smallest among the four, KPMG still has 298,356 employees.

-

 Markets2 weeks ago
Visualizing America’s Shortage of Affordable Homes
-

 Technology1 week ago
Ranked: Semiconductor Companies by Industry Revenue Share
-

 Money1 week ago
Which States Have the Highest Minimum Wage in America?
-

 Real Estate1 week ago
Ranked: The Most Valuable Housing Markets in America
-

 Business1 week ago
Charted: Big Four Market Share by S&P 500 Audits
-

 AI1 week ago
The Stock Performance of U.S. Chipmakers So Far in 2024
-

 Automotive2 weeks ago
Almost Every EV Stock is Down After Q1 2024
-

 Money2 weeks ago
Where Does One U.S. Tax Dollar Go?