United States
The Best Selling Vehicles in America, By State
View the full-size infographic map
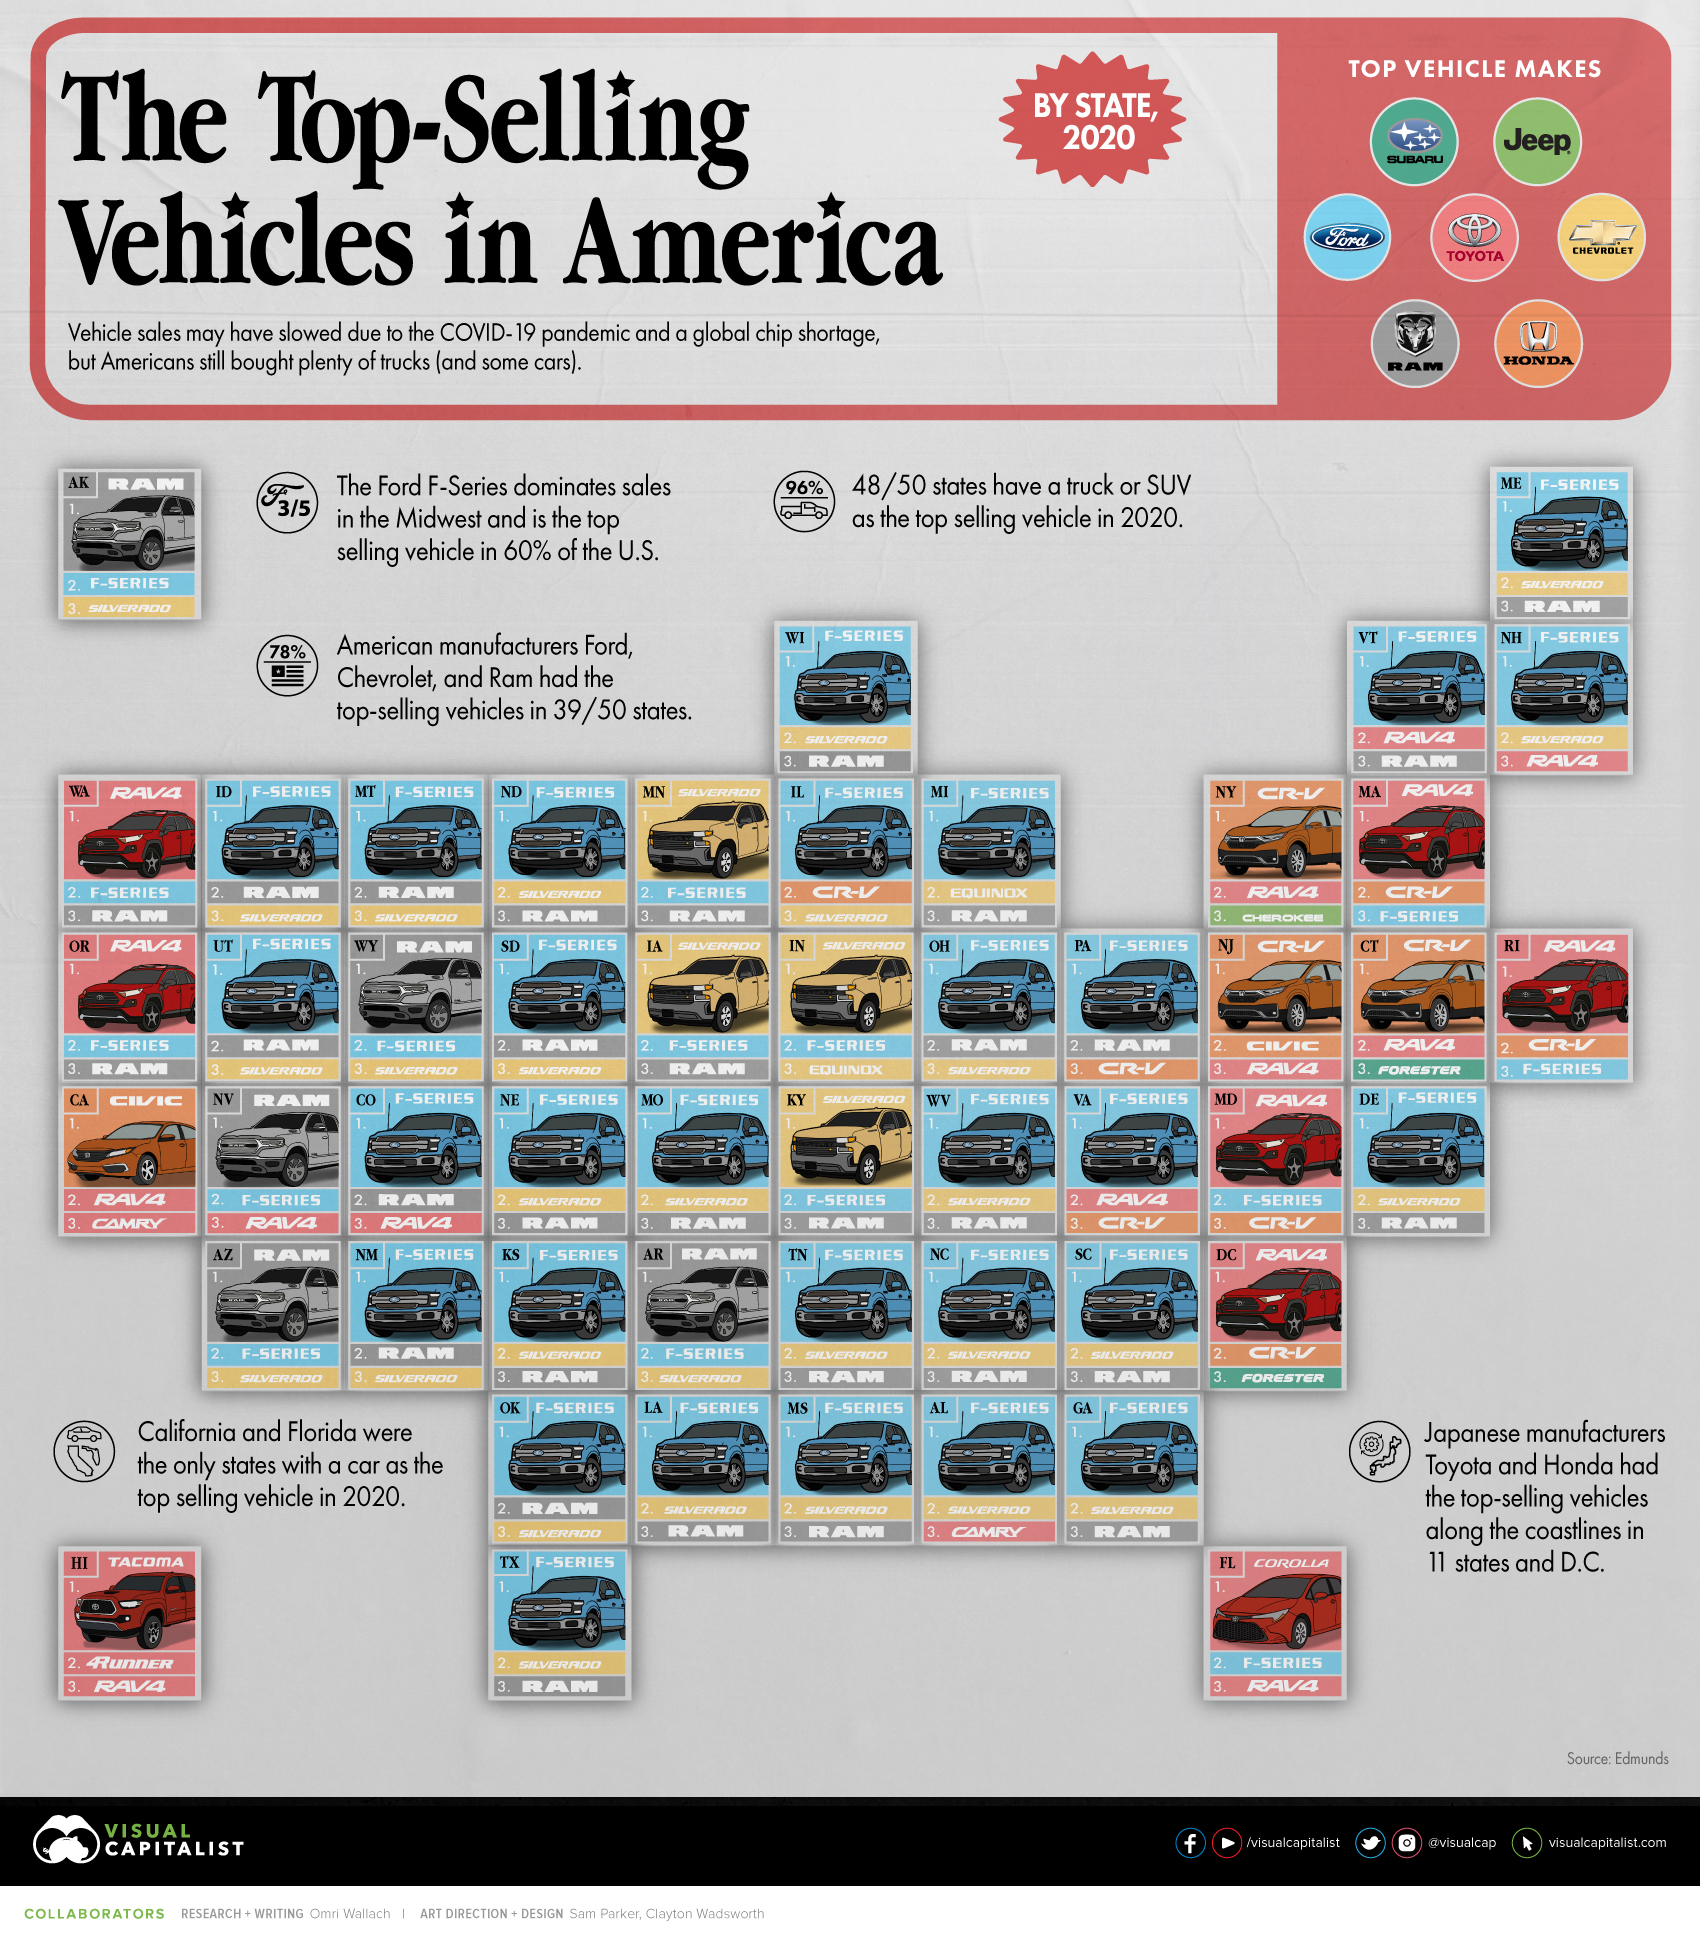


The Best Selling Vehicles in America, By State
From Ford trucks in the Midwest to Toyotas on the coasts, the best selling vehicles in America reveal a lot about the country.
Compared to other countries with fewer highways or narrower roads, the U.S. is very much a truck-friendly country. Across the U.S., the most sold vehicle in 2019 was the Ford F-Series of trucks, primarily the F-150.
As the home of the world’s pioneer automotive manufacturers, including Ford and GM, consumers primarily purchase local brands. But that hasn’t stopped Toyota, the largest foreign manufacturer in the world, from also gaining a foothold.
This graphic uses 2020 sales data from automotive information resource Edmunds.com, breaking down the best selling vehicles in each state through new vehicle retail registration.
What Are the Best Selling Vehicles in Each State?
Despite a slowdown in vehicle sales due to the COVID-19 pandemic and a global chip shortage, Americans still bought plenty of trucks last year.
In fact, 48 out of the 50 states had a truck or SUV as the top selling vehicle in 2020—and most states actually had trucks taking all of the top three spots. The only two with a car topping the leaderboard were California and Florida.
| Top Selling Vehicle By State (2020) | #1 | #2 | #3 |
|---|---|---|---|
| Alabama | Ford F-Series | Chevrolet Silverado | Toyota Camry |
| Alaska | Ram 1500-3500 | Ford F-Series | Chevrolet Silverado |
| Arizona | Ram 1500-3500 | Ford F-Series | Chevrolet Silverado |
| Arkansas | Ram 1500-3500 | Ford F-Series | Chevrolet Silverado |
| California | Honda Civic | Toyota RAV4 | Toyota Camry |
| Colorado | Ford F-Series | Ram 1500-3500 | Toyota RAV4 |
| Connecticut | Honda CR-V | Toyota RAV4 | Subaru Forester |
| D.C. | Toyota RAV4 | Honda CR-V | Subaru Forester |
| Delaware | Ford F-Series | Chevrolet Silverado | RAM 1500-3500 |
| Florida | Toyota Corolla | Ford F-Series | Toyota RAV4 |
| Georgia | Ford F-Series | Chevrolet Silverado | RAM 1500-3500 |
| Hawaii | Toyota Tacoma | Toyota 4Runner | Toyota RAV4 |
| Idaho | Ford F-Series | RAM 1500-3500 | Chevrolet Silverado |
| Illinois | Ford F-Series | Honda CR-V | Chevrolet Silverado |
| Indiana | Chevrolet Silverado | Ford F-Series | Chevrolet Equinox |
| Iowa | Chevrolet Silverado | Ford F-Series | RAM 1500-3500 |
| Kansas | Ford F-Series | Chevrolet Silverado | RAM 1500-3500 |
| Kentucky | Chevrolet Silverado | Ford F-Series | RAM 1500-3500 |
| Louisiana | Ford F-Series | Chevrolet Silverado | RAM 1500-3500 |
| Maine | Ford F-Series | Chevrolet Silverado | RAM 1500-3500 |
| Maryland | Toyota RAV4 | Ford F-Series | Honda CR-V |
| Massachusetts | Toyota RAV4 | Honda CR-V | Ford F-Series |
| Michigan | Ford F-Series | Chevrolet Equinox | RAM 1500-3500 |
| Minnesota | Chevrolet Silverado | Ford F-Series | RAM 1500-3500 |
| Mississippi | Ford F-Series | Chevrolet Silverado | RAM 1500-3500 |
| Missouri | Ford F-Series | Chevrolet Silverado | RAM 1500-3500 |
| Montana | Ford F-Series | RAM 1500-3500 | Chevrolet Silverado |
| Nebraska | Ford F-Series | Chevrolet Silverado | RAM 1500-3500 |
| Nevada | Ram 1500-3500 | Ford F-Series | Toyota RAV4 |
| New Hampshire | Ford F-Series | Chevrolet Silverado | Toyota RAV4 |
| New Jersey | Honda CR-V | Honda Civic | Toyota RAV4 |
| New Mexico | Ford F-Series | RAM 1500-3500 | Chevrolet Silverado |
| New York | Honda CR-V | Toyota RAV4 | Jeep Cherokee |
| North Carolina | Ford F-Series | Chevrolet Silverado | RAM 1500-3500 |
| North Dakota | Ford F-Series | Chevrolet Silverado | RAM 1500-3500 |
| Ohio | Ford F-Series | RAM 1500-3500 | Chevrolet Silverado |
| Oklahoma | Ford F-Series | RAM 1500-3500 | Chevrolet Silverado |
| Oregon | Toyota RAV4 | Ford F-Series | RAM 1500-3500 |
| Pennsylvania | Ford F-Series | RAM 1500-3500 | Honda CR-V |
| Puerto Rico | Toyota RAV4 | Toyota Yaris | Toyota Corolla |
| Rhode Island | Toyota RAV4 | Honda CR-V | Ford F-Series |
| South Carolina | Ford F-Series | Chevrolet Silverado | RAM 1500-3500 |
| South Dakota | Ford F-Series | RAM 1500-3500 | Chevrolet Silverado |
| Tennessee | Ford F-Series | Chevrolet Silverado | RAM 1500-3500 |
| Texas | Ford F-Series | Chevrolet Silverado | RAM 1500-3500 |
| Utah | Ford F-Series | RAM 1500-3500 | Chevrolet Silverado |
| Vermont | Ford F-Series | Toyota RAV4 | RAM 1500-3500 |
| Virginia | Ford F-Series | Toyota RAV4 | Honda CR-V |
| Washington | Toyota RAV4 | Ford F-Series | Ram 1500-3500 |
| West Virginia | Ford F-Series | Chevrolet Silverado | Ram 1500-3500 |
| Wisconsin | Ford F-Series | Chevrolet Silverado | Ram 1500-3500 |
| Wyoming | Ram 1500-3500 | Ford F-Series | Chevrolet Silverado |
The Ford F-Series was the clear leader in sales, primarily in the Midwest. With a top-selling spot in 60% of U.S. states, the F-Series was the best selling vehicle in America.
Combined with the Chevrolet Silverado and Ram 1500-3500 series, the big three American truck brands accounted for 73% of the top three selling vehicles across all American states and territories.
Japanese Automakers in the Mix
Though American manufacturers had the best selling cars in most states, they had some overseas competition.
Japanese manufacturers Toyota and Honda had the top-selling vehicle in 11 states (and D.C.). They primarily captured car sales along the coastlines, including in California, Florida, New York and Washington, some of the most populated states in the country.
| America's Best Selling Vehicles (2020) | Type | # Times in Top 3 |
|---|---|---|
| Ford F-Series | Truck | 45 |
| Ram 1500-3500 | Truck | 36 |
| Chevrolet Silverado | Truck | 33 |
| Toyota RAV4 | SUV | 18 |
| Honda CR-V | SUV | 10 |
| Chevrolet Equinox | SUV | 2 |
| Honda Civic | Car | 2 |
| Subaru Forester | SUV | 2 |
| Toyota Camry | Car | 2 |
| Toyota Corolla | Car | 2 |
| Jeep Cherokee | SUV | 1 |
| Toyota 4Runner | SUV | 1 |
| Toyota Tacoma | Truck | 1 |
| Toyota Yaris | Car | 1 |
Despite many cars being available for sale in the U.S., only seven manufacturers made the top-selling vehicles list in 2020.
- Ford
- Ram
- Chevrolet
- Toyota
- Honda
- Subaru
- Jeep
With the full effects of the COVID-19 pandemic yet to be reflected in the sales, and electric vehicle manufacturers like Tesla on the rise, how will the best selling vehicles in America evolve?


Misc
Visualizing the Most Common Pets in the U.S.
Lions, tigers, and bears, oh my!—these animals do not feature on this list of popular American household pets.


Visualizing The Most Common Pets in the U.S.
This was originally posted on our Voronoi app. Download the app for free on iOS or Android and discover incredible data-driven charts from a variety of trusted sources.
In this graphic, we visualized the most common American household pets, based on 2023-2024 data from the American Pet Products Association (accessed via Forbes Advisor).
Figures represent the number of households that own each pet type, rather than the actual number of each animal. The “small animal” category includes hamsters, gerbils, rabbits, guinea pigs, chinchillas, mice, rats, and ferrets.
What is the Most Popular American Household Pet?
Based on this data, dogs—one of the first domesticated animals—are the most common pets in the United States. In fact, around 65 million households own a dog, and spend an average of $900 a year on their care.
| Rank | Species | Households |
|---|---|---|
| 1 | 🐶 Dog | 65M |
| 2 | 🐱 Cat | 47M |
| 3 | 🐟 Freshwater Fish | 11M |
| 4 | 🐰 Small Animals | 7M |
| 5 | 🐦 Bird | 6M |
| 6 | 🦎 Reptile | 6M |
| 7 | 🐴 Horse | 2M |
| 8 | 🐠 Saltwater Fish | 2M |
Note: Households can own multiple pets, and are counted for all relevant categories.
Cats rank second, at 47 million households, and these smaller felines are a little less expensive to own at $700/year according to Forbes estimates.
But aside from these two juggernauts, there are plenty of other common pet types found in households across the country.
Freshwater fish can be found in 11 million households, along with small animals—rabbits, hamsters, guinea pigs—in 7 million. Meanwhile, nearly 6 million homes have birds or reptiles.
Pet Ownership is on the Rise in America
Forbes found that 66% of all American households (numbering 87 million) own at least one pet, up from 56% in 1988. One third of these (29 million) own multiple pets.
A combination of factors is driving this increase: rising incomes, delayed childbirth, and of course the impact of the pandemic which nearly cleared out animal shelters across the globe.
America’s loneliness epidemic may also be a factor. Fledgling research has shown that single-individual households with pets recorded lower rates of loneliness during the pandemic than those without a pet.

-

 Science1 week ago
Visualizing the Average Lifespans of Mammals
-

 Markets2 weeks ago
The Top 10 States by Real GDP Growth in 2023
-

 Demographics2 weeks ago
The Smallest Gender Wage Gaps in OECD Countries
-

 United States2 weeks ago
Where U.S. Inflation Hit the Hardest in March 2024
-

 Green2 weeks ago
Top Countries By Forest Growth Since 2001
-

 United States2 weeks ago
Ranked: The Largest U.S. Corporations by Number of Employees
-

 Maps2 weeks ago
The Largest Earthquakes in the New York Area (1970-2024)
-

 Green2 weeks ago
Ranked: The Countries With the Most Air Pollution in 2023