Brands
The Best-Selling Car in America, Every Year Since 1978
The Best-Selling Car in America, Every Year Since 1978
Cars have been a staple of the U.S. economy almost since their inception. But as vehicle designs have evolved over time, and consumer tastes alongside them, the best-selling car in America has changed as well.
Finding the right mix of affordability, style, and features has meant that different manufacturers have been in the market lead during different decades.
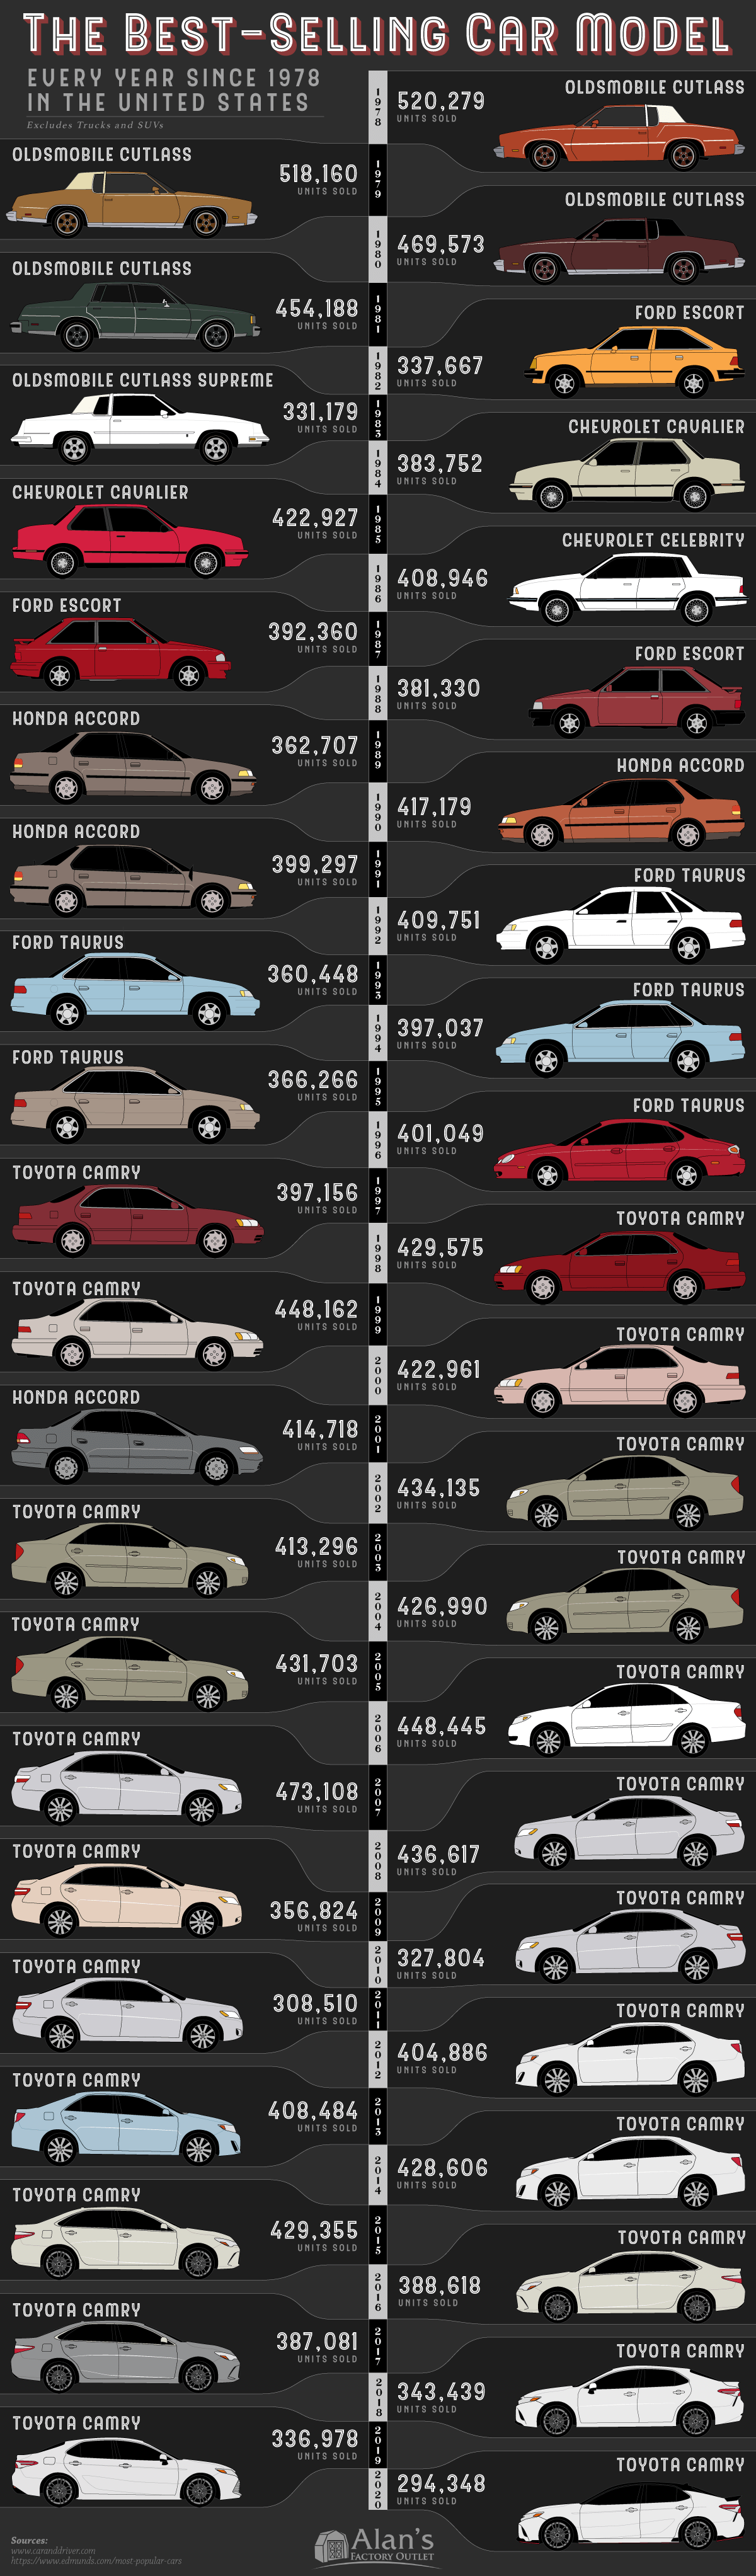
This infographic from Alan’s Factory Outlet shows the most-purchased cars in the U.S. since 1978, not including trucks and SUVs.
What Is The Best-Selling Car in America By Year?
From 1978 to 2020, over 348 million cars were sold in the U.S., or an average of 8.1 million cars per year. Car sales were especially strong during times of high oil prices, such as following the 1979 oil crisis, as consumers avoided less fuel-efficient trucks and SUVs.
And throughout most of the 20th century, car sales in the U.S. were led by American manufacturers.
From 1978 to 1988, two of the “Big Three” Detroit-based auto manufacturers had the best-selling cars in the country. GM had two models of the Oldsmobile Cutlass and two different Chevrolets in the top spot, while Ford was able to compete with the compact Ford Escort.
But since the late 1980s, Japanese manufacturers started to take over in affordability, reliability, and overall sales.
| Years | Car Model | Best-Selling Span (U.S.) |
|---|---|---|
| 1978–1981 | Oldsmobile Cutlass | 4 years |
| 1982 | Ford Escort | 1 year |
| 1983 | Oldsmobile Cutlass Supreme | 1 year |
| 1984–1985 | Chevrolet Cavalier | 2 years |
| 1986 | Chevrolet Celebrity | 1 year |
| 1987–1988 | Ford Escort | 2 years |
| 1989–1991 | Honda Accord | 3 years |
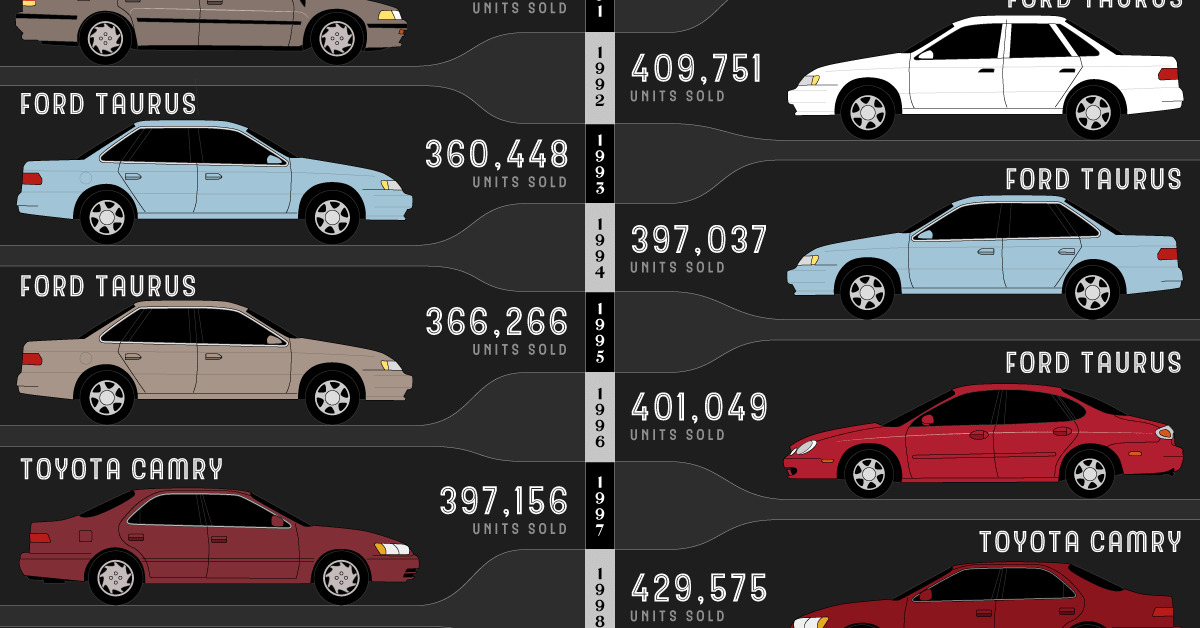
| 1992–1996 | Ford Taurus | 5 years |
| 1997–2000 | Toyota Camry | 4 years |
| 2001 | Honda Accord | 1 year |
| 2002–2020 | Toyota Camry | 19 years |
After Honda and Ford fought closely for the most popular cars with the Accord and the Taurus, Toyota grabbed the crown with the ultra-popular Toyota Camry.
Toyota, which was the world’s largest automaker by market cap for a majority of the last 30 years, also has the world’s best-selling car of all-time with another popular model, the Toyota Corolla.
The company’s cars have resonated with consumers due to reliability, safety, and efficiency in spite of being mass-produced and affordable. High ownership satisfaction and low incidence rates also led Camrys to have high resale value.
Runner Ups and Best-Selling Trucks and SUVs
Just behind Toyota for many years was another Japanese automaker, Honda. The company’s Accord and Civic models consistently ranked just behind the Toyota Camry in U.S. sales throughout most of the 2000s.
Despite most of the world preferring cars for vehicle purchases, the U.S. has become light truck and SUV dominant since the 2000s.
| Car Model | Units Sold (U.S. 2020) |
|---|---|
| Ford F-Series | 787,422 |
| Chevrolet Silverado | 594,094 |
| Ram pickup | 563,676 |
| Toyota RAV4 | 430,387 |
| Honda CR-V | 333,502 |
| Toyota Camry | 294,348 |
| Chevrolet Equinox | 270,994 |
| Honda Civic | 270,994 |
| GMC Sierra | 253,016 |
| Toyota Tacoma | 238,806 |
The proliferation of light trucks also meant that Toyota, one of the world’s leading hybrid sellers, saw the crossover/SUV Toyota RAV4 Hybrid beat the well-known Prius consistently in U.S. sales.
Meanwhile, electric car sales in the U.S. are still far behind, climbing up to 1.8% of sales in 2020 from 1.4% the year before. Compared to countries like Norway where electric cars make up the majority of vehicle sales, the U.S. will likely be dominated by light-trucks for years to come.


Brands
How Tech Logos Have Evolved Over Time
From complete overhauls to more subtle tweaks, these tech logos have had quite a journey. Featuring: Google, Apple, and more.


How Tech Logos Have Evolved Over Time
This was originally posted on our Voronoi app. Download the app for free on iOS or Android and discover incredible data-driven charts from a variety of trusted sources.
One would be hard-pressed to find a company that has never changed its logo. Granted, some brands—like Rolex, IBM, and Coca-Cola—tend to just have more minimalistic updates. But other companies undergo an entire identity change, thus necessitating a full overhaul.
In this graphic, we visualized the evolution of prominent tech companies’ logos over time. All of these brands ranked highly in a Q1 2024 YouGov study of America’s most famous tech brands. The logo changes are sourced from 1000logos.net.
How Many Times Has Google Changed Its Logo?
Google and Facebook share a 98% fame rating according to YouGov. But while Facebook’s rise was captured in The Social Network (2010), Google’s history tends to be a little less lionized in popular culture.
For example, Google was initially called “Backrub” because it analyzed “back links” to understand how important a website was. Since its founding, Google has undergone eight logo changes, finally settling on its current one in 2015.
| Company | Number of Logo Changes |
|---|---|
| 8 | |
| HP | 8 |
| Amazon | 6 |
| Microsoft | 6 |
| Samsung | 6 |
| Apple | 5* |
Note: *Includes color changes. Source: 1000Logos.net
Another fun origin story is Microsoft, which started off as Traf-O-Data, a traffic counter reading company that generated reports for traffic engineers. By 1975, the company was renamed. But it wasn’t until 2012 that Microsoft put the iconic Windows logo—still the most popular desktop operating system—alongside its name.
And then there’s Samsung, which started as a grocery trading store in 1938. Its pivot to electronics started in the 1970s with black and white television sets. For 55 years, the company kept some form of stars from its first logo, until 1993, when the iconic encircled blue Samsung logo debuted.
Finally, Apple’s first logo in 1976 featured Isaac Newton reading under a tree—moments before an apple fell on his head. Two years later, the iconic bitten apple logo would be designed at Steve Jobs’ behest, and it would take another two decades for it to go monochrome.

-

 Science1 week ago
Visualizing the Average Lifespans of Mammals
-

 Markets2 weeks ago
The Top 10 States by Real GDP Growth in 2023
-

 Demographics2 weeks ago
The Smallest Gender Wage Gaps in OECD Countries
-

 United States2 weeks ago
Where U.S. Inflation Hit the Hardest in March 2024
-

 Green2 weeks ago
Top Countries By Forest Growth Since 2001
-

 United States2 weeks ago
Ranked: The Largest U.S. Corporations by Number of Employees
-

 Maps2 weeks ago
The Largest Earthquakes in the New York Area (1970-2024)
-

 Green2 weeks ago
Ranked: The Countries With the Most Air Pollution in 2023