Commodities
Coffee vs Tea vs Soft Drinks: What Caffeine Drinks Do Countries Prefer?


Coffee vs Tea vs Soft Drinks: Caffeinated Drink Popularity
Coffee, tea, or soft drinks… How do you get your caffeine fix?
It might be the world’s most widely consumed psychoactive substance, but your preferred caffeine drink of choice might come down to where you live.
A study into caffeine consumption of 57 countries examined the role it plays in our diets, using the volume sales of caffeine-containing beverages from Euromonitor to see what caffeine source each country prefers.
The resulting map of caffeine preference shows regional trends, including some surprising standouts.
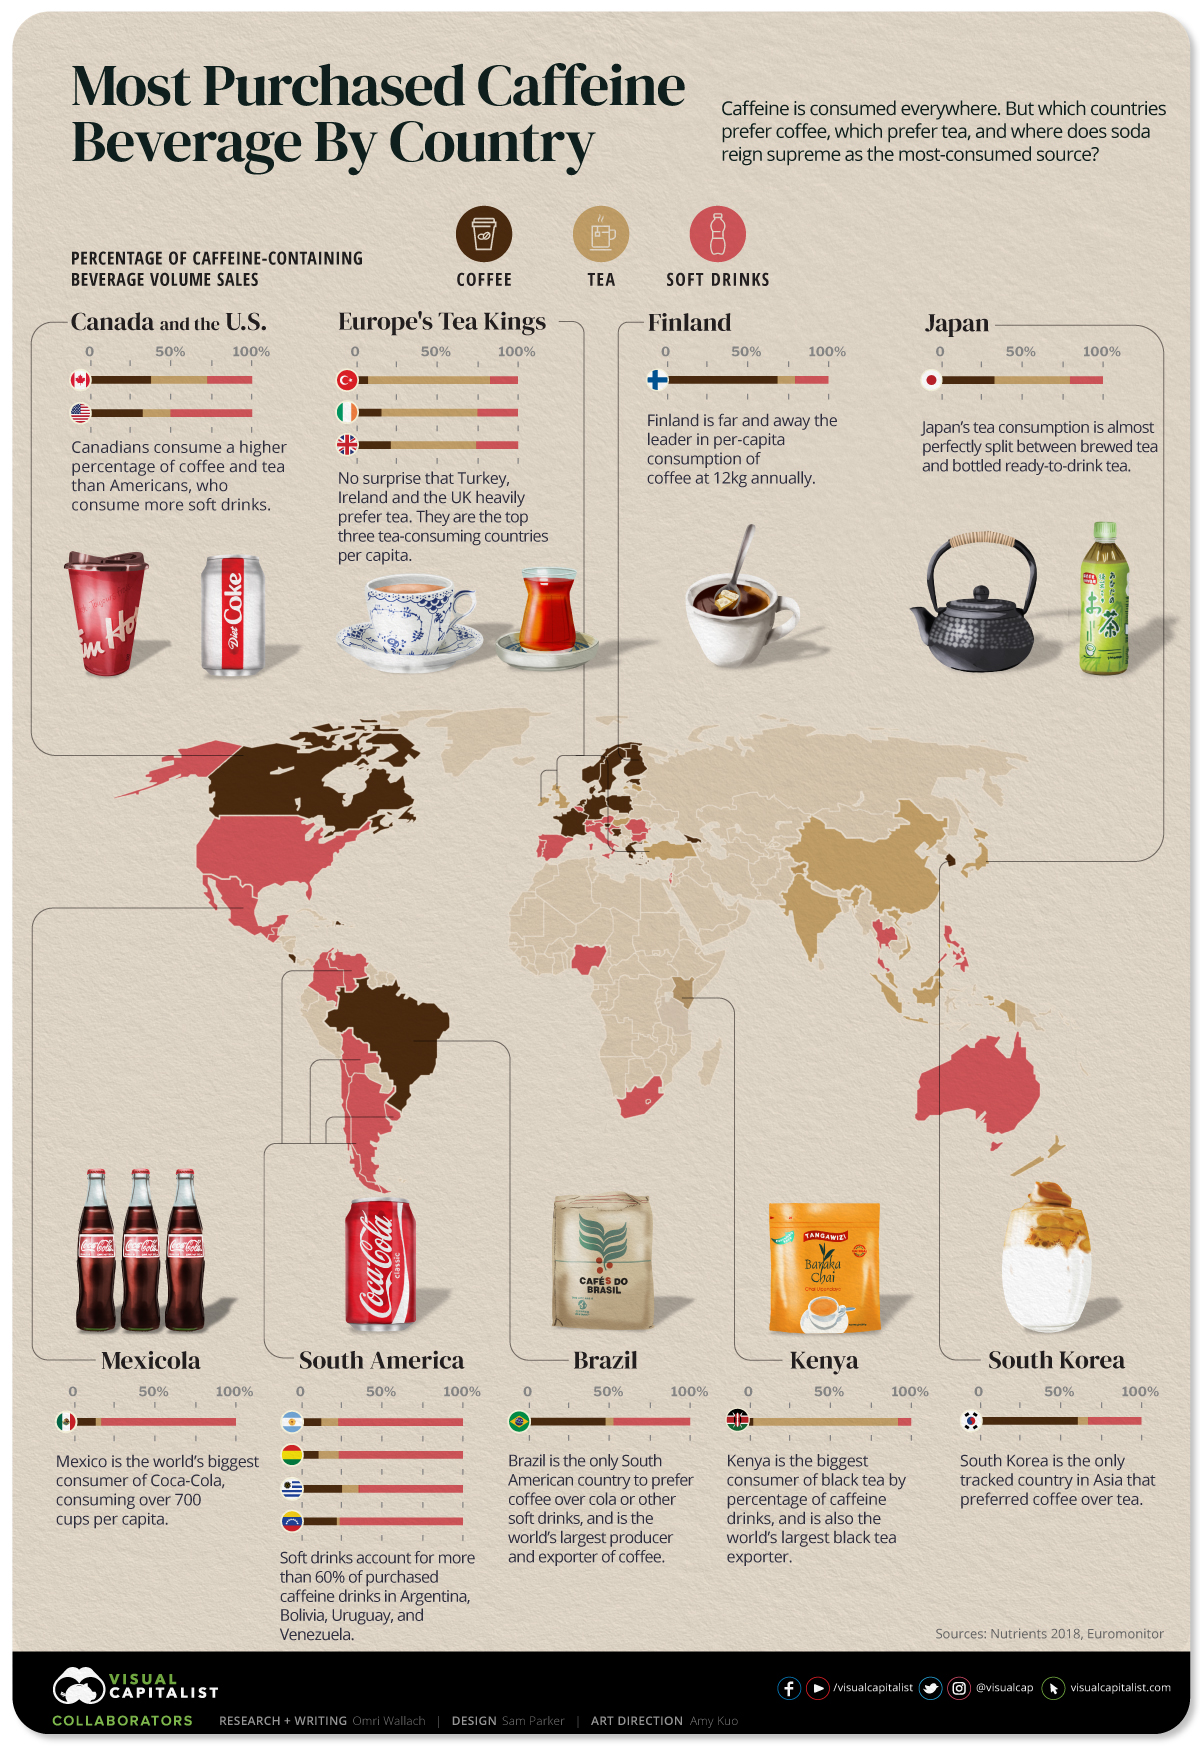
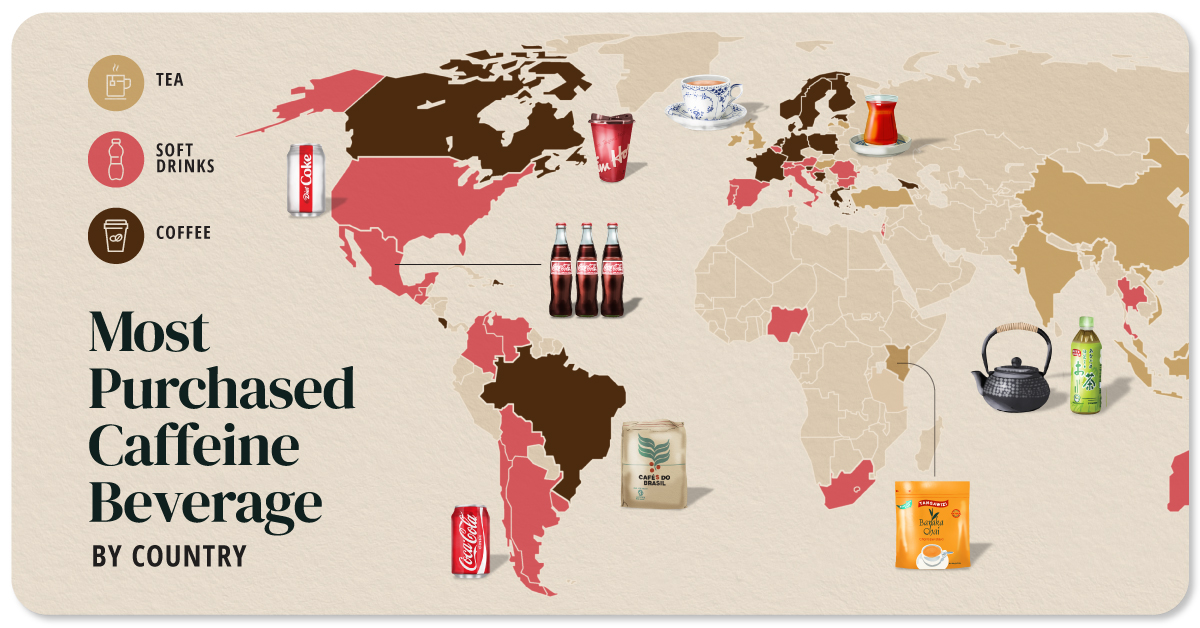
Most Purchased Caffeine Drink By Country
There are many different caffeine drinks for consumers to choose from, from brewed drinks to ready-to-drink vending machine options.
To simplify tastes, we grouped them into three types:
- Coffee — Includes fresh brewed coffee, instant coffee, and ready-to-drink coffee.
- Tea — Includes herbal, black, green, and other teas, as well as ready-to-drink tea.
- Soft Drinks — Includes colas, other soft drinks, sports drinks, and energy drinks.
Here’s the full breakdown of each country’s preferred caffeine drink of choice, by volume sales.
| Country | Region | Most Purchased Caffeine Drinks |
|---|---|---|
| Kenya | Africa | Tea |
| Nigeria | Africa | Soft Drinks |
| South Africa | Africa | Soft Drinks |
| China | Asia | Tea |
| Hong Kong | Asia | Tea |
| India | Asia | Tea |
| Indonesia | Asia | Tea |
| Israel | Asia | Soft Drinks |
| Japan | Asia | Tea |
| Malaysia | Asia | Tea |
| Philippines | Asia | Soft Drinks |
| South Korea | Asia | Coffee |
| Taiwan | Asia | Tea |
| Thailand | Asia | Soft Drinks |
| Vietnam | Asia | Tea |
| Austria | Europe | Soft Drinks |
| Belgium | Europe | Soft Drinks |
| Bosnia-Herzegovina | Europe | Coffee |
| Bulgaria | Europe | Soft Drinks |
| Croatia | Europe | Soft Drinks |
| Denmark | Europe | Coffee |
| Estonia | Europe | Coffee |
| Finland | Europe | Coffee |
| France | Europe | Coffee |
| Georgia | Europe | Coffee |
| Germany | Europe | Coffee |
| Greece | Europe | Coffee |
| Hungary | Europe | Soft Drinks |
| Ireland | Europe | Tea |
| Italy | Europe | Soft Drinks |
| Latvia | Europe | Tea |
| Netherlands | Europe | Coffee |
| Norway | Europe | Coffee |
| Poland | Europe | Coffee |
| Portugal | Europe | Soft Drinks |
| Romania | Europe | Soft Drinks |
| Slovenia | Europe | Coffee |
| Spain | Europe | Soft Drinks |
| Sweden | Europe | Coffee |
| Switzerland | Europe | Soft Drinks |
| Turkey | Europe | Tea |
| UK | Europe | Tea |
| Canada | North America | Coffee |
| Costa Rica | North America | Coffee |
| Dominican Republic | North America | Coffee |
| Guatemala | North America | Soft Drinks |
| Mexico | North America | Soft Drinks |
| U.S. | North America | Soft Drinks |
| Australia | Oceania | Soft Drinks |
| New Zealand | Oceania | Tea |
| Argentina | South America | Soft Drinks |
| Bolivia | South America | Soft Drinks |
| Brazil | South America | Coffee |
| Chile | South America | Soft Drinks |
| Colombia | South America | Soft Drinks |
| Uruguay | South America | Soft Drinks |
| Venezuela | South America | Soft Drinks |
Examining the regional spread shows us some expected caffeine strongholds.
Tea was the preferred drink of choice for many countries in most of Asia, including China, India, Indonesia, and Japan. But it also showed a strong foothold in Africa, as Kenya is the world’s largest black tea exporter, and in Europe, as Turkey, Ireland, and the UK are the world’s top three tea-consuming countries per capita.
Coffee was the most preferred caffeine drink in a number of countries in Europe, including all of the Nordic countries. It is also the drink of choice in Canada, South Korea, and Brazil, the latter two being the only countries in Asia and South America to prefer coffee.
Perhaps most surprising is the global preference for soft drinks. The U.S. and most of Latin America overwhelmingly consumed soft drinks over other caffeine drinks, as did the Philippines, Thailand, and Australia. Even in Europe, some countries that are heavy coffee drinkers like Italy and Switzerland purchased more soft drinks than coffee by narrow margins.
Coke’s Influence on the Coffee vs Tea vs Soft Drinks Debate
Though the global map of caffeine preference looks regionally-specific at a glance, there are some notable business influences at play.
The proliferation of soft drinks in Latin America is largely due to the power of Coca-Cola. Mexico, the country which preferred soft drinks the most over other drinks, is also the world’s biggest consumer of Coca-Cola per capita. Coca-Cola also reached far beyond the borders of the U.S. where it originated, becoming a staple drink in many parts of Europe, Australia, and Asia.
This power of brands extends to coffee as well. Many coffee-preferring countries actually leaned more towards instant coffee purchases over freshly brewed coffee, a mark of the lasting influence of Nestlé’s brand of instant coffee, Nescafé.
But it’s important to note that many countries were not tabulated, and that caffeine purchases don’t differentiate between every single possible caffeine drink. There are many different types of coffees, teas, soft drinks, and even yerba mate for consumers to choose from.
As a snapshot of global caffeine consumption, it’s a reminder that the world’s most commonly consumed psychoactive stimulant is taken in many different forms. Both throughout history, and in modern times.


Copper
Brass Rods: The Secure Choice
This graphic shows why brass rods are the secure choice for precision-machined and forged parts.


Brass Rods: The Secure Choice
The unique combination of machinability and recyclability makes brass rods the secure choice for manufacturers seeking future-proof raw material solutions.
This infographic, from the Copper Development Association, shows three ways brass rods give manufacturers greater control and a license to grow in the competitive market for precision-machined and forged products.
Future-Proof Investments in New Machine Tools
A material’s machinability directly impacts machine throughput, which typically has the largest impact on machine shop profitability.
The high-speed machining capabilities of brass rods maximize machine tool performance, allowing manufacturers to run the material faster and longer without sacrificing tool life, chip formation, or surface quality.
The high machining efficiency of brass leads to reduced per-part costs, quicker return on investment (ROI) for new machine tools, and expanded production capacity for new projects.
Supply Security Through Closed Loop Recycling
Brass, like its parent element copper, can be infinitely recycled.
In 2022, brass- and wire-rod mills accounted for the majority of the 830,000 tonnes of copper recycled from scrap in the United States.
Given that scrap ratios for machined parts typically range from 60-70% by weight, producing mills benefit from a secure and steady supply of clean scrap returned directly from customers, which is recycled to create new brass rods.
The high residual value of brass scrap creates a strong recycling incentive. Scrap buy back programs give manufacturers greater control over raw material net costs as scrap value is often factored into supplier purchase agreements.
Next Generation Alloys for a Lead-Free Future
Increasingly stringent global regulations continue to pressure manufacturers to minimize the use of materials containing trace amounts of lead and other harmful impurities.
The latest generation of brass-rod alloys is engineered to meet the most demanding criteria for lead leaching in drinking water and other sensitive applications.
Seven brass-rod alloys passed rigorous testing to become the only ‘Acceptable Materials’ against lower lead leaching criteria recently adopted in the national U.S. drinking water quality standard, NSF 61.
Learn more about the advantages of brass rods solutions.

-

 Base Metals1 year ago
Ranked: The World’s Largest Copper Producers
Many new technologies critical to the energy transition rely on copper. Here are the world’s largest copper producers.
-

 Silver2 years ago
Mapped: Solar Power by Country in 2021
In 2020, solar power saw its largest-ever annual capacity expansion at 127 gigawatts. Here’s a snapshot of solar power capacity by country.
-

 Batteries5 years ago
Visualizing Copper’s Role in the Transition to Clean Energy
A clean energy transition is underway as wind, solar, and batteries take center stage. Here’s how copper plays the critical role in these technologies.
-

 Science5 years ago
Everything You Need to Know on VMS Deposits
Deep below the ocean’s waves, VMS deposits spew out massive amounts of minerals like copper, zinc, and gold, making them a key source of the metals…
-
 Copper5 years ago
How Much Copper is in an Electric Vehicle?
Have you ever wondered how much copper is in an electric vehicle? This infographic shows the metal’s properties as well as the quantity of copper used.
-
 Copper6 years ago
Copper: Driving the Green Energy Revolution
Renewable energy is set to fuel a new era of copper demand – here’s how much copper is used in green applications from EVs to photovoltaics.


-

 Education1 week ago
How Hard Is It to Get Into an Ivy League School?
-

 Technology2 weeks ago
Ranked: Semiconductor Companies by Industry Revenue Share
-

 Markets2 weeks ago
Ranked: The World’s Top Flight Routes, by Revenue
-

 Demographics2 weeks ago
Population Projections: The World’s 6 Largest Countries in 2075
-

 Markets2 weeks ago
The Top 10 States by Real GDP Growth in 2023
-

 Demographics2 weeks ago
The Smallest Gender Wage Gaps in OECD Countries
-

 Economy2 weeks ago
Where U.S. Inflation Hit the Hardest in March 2024
-

 Green2 weeks ago
Top Countries By Forest Growth Since 2001