Energy
Visualizing Copper’s Role in the Transition to Clean Energy
A future powered by renewables is not in the distant horizon, but rather in its early hours.
This new dawn comes from a global awareness of the environmental impacts of the current energy mix, which relies heavily on fossil fuels and their associated greenhouse gas emissions.
Technologies such as wind, solar, and batteries offer renewable and clean alternatives and are leading the way for the transition to clean energy. However, as with every energy transition, there are not only new technologies, but also new material demands.
Copper: A Key Piece of the Puzzle
This energy transition will be mineral intensive and it will require metals such as nickel, lithium, and cobalt. However, one metal stands out as being particularly important, and that is copper.
Today’s infographic comes to us from the Copper Development Association and outlines the special role of copper in renewable power generation, energy storage, and electric vehicles.

Why Copper?
The red metal has four key properties that make it ideal for the clean energy transition.
- Conductivity
- Ductility
- Efficiency
- Recyclability
It is these properties that make copper the critical material for wind and solar technology, energy storage, and electric vehicles.
It’s also why, according to ThinkCopper, the generation of electricity from solar and wind uses four to six times more copper than fossil fuel sources.
Copper in Wind
A three-megawatt wind turbine can contain up to 4.7 tons of copper with 53% of that demand coming from the cable and wiring, 24% from the turbine/power generation components, 4% from transformers, and 19% from turbine transformers.
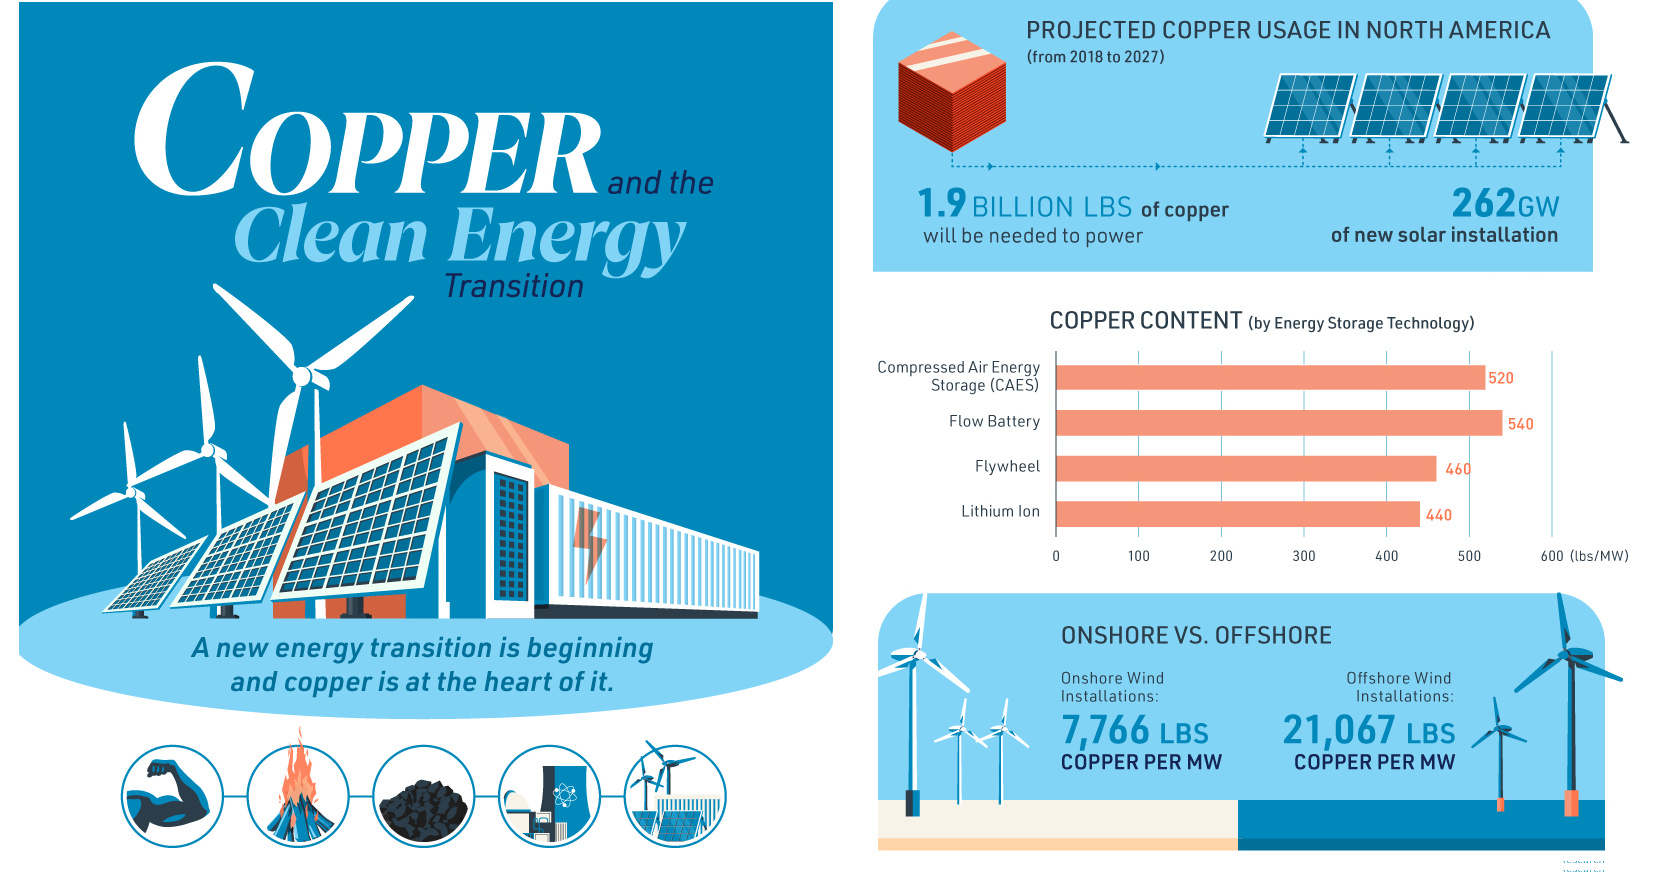
The use of copper significantly increases when going offshore. That’s because onshore wind farms use approximately 7,766 lbs of copper per MW, while an offshore wind installation uses 21,068 lbs of copper per MW.
It is the cabling of the offshore wind farms to connect them to each other and to deliver the power that accounts for the bulk of the copper usage.
Copper in Solar
Solar power systems can contain approximately 5.5 tons of copper per MW. Copper is in the heat exchangers of solar thermal units as well as in the wiring and cabling that transmits the electricity in photovoltaic solar cells.
Navigant Research projects that 262 GW of new solar installations between 2018 and 2027 in North America will require 1.9 billion lbs of copper.
Copper in Energy Storage
There are many ways to store energy, but every method uses copper. For example, a lithium ion battery contains 440 lbs of copper per MW and a flow battery 540 lbs of copper per MW.
Copper wiring and cabling connects renewable power generation with energy storage, while the copper in the switches of transformers help to deliver power at the right voltage.
Across the United States, a total of 5,752 MW of energy capacity has been announced and commissioned.
Copper in Electric Vehicles
Copper is at the heart of the electric vehicle (EV). This is because EVs rely on copper for the motor coil that drives the engine.
The more electric the car, the more copper it needs; a car powered by an internal combustion engine contains roughly 48 lbs, a hybrid needs 88 lbs, and a battery electric vehicle uses 184 lbs.
Additionally, the cabling for charging stations of electric vehicles will be another source of copper demand.
The Copper Future
Advances in technologies create new material demands.
Therefore, it shouldn’t be surprising that the transition to renewables is going to create demand for many minerals – and copper is going to be a critical mineral for the new era of energy.


Energy
Charted: 4 Reasons Why Lithium Could Be the Next Gold Rush
Visual Capitalist has partnered with EnergyX to show why drops in prices and growing demand may make now the right time to invest in lithium.


4 Reasons Why You Should Invest in Lithium
Lithium’s importance in powering EVs makes it a linchpin of the clean energy transition and one of the world’s most precious minerals.
In this graphic, Visual Capitalist partnered with EnergyX to explore why now may be the time to invest in lithium.
1. Lithium Prices Have Dropped
One of the most critical aspects of evaluating an investment is ensuring that the asset’s value is higher than its price would indicate. Lithium is integral to powering EVs, and, prices have fallen fast over the last year:
| Date | LiOH·H₂O* | Li₂CO₃** |
|---|---|---|
| Feb 2023 | $76 | $71 |
| March 2023 | $71 | $61 |
| Apr 2023 | $43 | $33 |
| May 2023 | $43 | $33 |
| June 2023 | $47 | $45 |
| July 2023 | $44 | $40 |
| Aug 2023 | $35 | $35 |
| Sept 2023 | $28 | $27 |
| Oct 2023 | $24 | $23 |
| Nov 2023 | $21 | $21 |
| Dec 2023 | $17 | $16 |
| Jan 2024 | $14 | $15 |
| Feb 2024 | $13 | $14 |
Note: Monthly spot prices were taken as close to the 14th of each month as possible.
*Lithium hydroxide monohydrate MB-LI-0033
**Lithium carbonate MB-LI-0029
2. Lithium-Ion Battery Prices Are Also Falling
The drop in lithium prices is just one reason to invest in the metal. Increasing economies of scale, coupled with low commodity prices, have caused the cost of lithium-ion batteries to drop significantly as well.
In fact, BNEF reports that between 2013 and 2023, the price of a Li-ion battery dropped by 82%.
| Year | Price per KWh |
|---|---|
| 2023 | $139 |
| 2022 | $161 |
| 2021 | $150 |
| 2020 | $160 |
| 2019 | $183 |
| 2018 | $211 |
| 2017 | $258 |
| 2016 | $345 |
| 2015 | $448 |
| 2014 | $692 |
| 2013 | $780 |

3. EV Adoption is Sustainable
One of the best reasons to invest in lithium is that EVs, one of the main drivers behind the demand for lithium, have reached a price point similar to that of traditional vehicle.
According to the Kelly Blue Book, Tesla’s average transaction price dropped by 25% between 2022 and 2023, bringing it in line with many other major manufacturers and showing that EVs are a realistic transport option from a consumer price perspective.
| Manufacturer | September 2022 | September 2023 |
|---|---|---|
| BMW | $69,000 | $72,000 |
| Ford | $54,000 | $56,000 |
| Volkswagon | $54,000 | $56,000 |
| General Motors | $52,000 | $53,000 |
| Tesla | $68,000 | $51,000 |
4. Electricity Demand in Transport is Growing
As EVs become an accessible transport option, there’s an investment opportunity in lithium. But possibly the best reason to invest in lithium is that the IEA reports global demand for the electricity in transport could grow dramatically by 2030:
| Transport Type | 2022 | 2025 | 2030 |
|---|---|---|---|
| Buses 🚌 | 23,000 GWh | 50,000 GWh | 130,000 GWh |
| Cars 🚙 | 65,000 GWh | 200,000 GWh | 570,000 GWh |
| Trucks 🛻 | 4,000 GWh | 15,000 GWh | 94,000 GWh |
| Vans 🚐 | 6,000 GWh | 16,000 GWh | 72,000 GWh |
The Lithium Investment Opportunity
Lithium presents a potentially classic investment opportunity. Lithium and battery prices have dropped significantly, and recently, EVs have reached a price point similar to other vehicles. By 2030, the demand for clean energy, especially in transport, will grow dramatically.
With prices dropping and demand skyrocketing, now is the time to invest in lithium.
EnergyX is poised to exploit lithium demand with cutting-edge lithium extraction technology capable of extracting 300% more lithium than current processes.

-

 Lithium4 days ago
Ranked: The Top 10 EV Battery Manufacturers in 2023
Asia dominates this ranking of the world’s largest EV battery manufacturers in 2023.
-

 Energy1 week ago
The World’s Biggest Nuclear Energy Producers
China has grown its nuclear capacity over the last decade, now ranking second on the list of top nuclear energy producers.
-

 Energy1 month ago
The World’s Biggest Oil Producers in 2023
Just three countries accounted for 40% of global oil production last year.
-

 Energy1 month ago
How Much Does the U.S. Depend on Russian Uranium?
Currently, Russia is the largest foreign supplier of nuclear power fuel to the U.S.
-

 Uranium2 months ago
Charted: Global Uranium Reserves, by Country
We visualize the distribution of the world’s uranium reserves by country, with 3 countries accounting for more than half of total reserves.
-

 Energy3 months ago
Visualizing the Rise of the U.S. as Top Crude Oil Producer
Over the last decade, the United States has established itself as the world’s top producer of crude oil, surpassing Saudi Arabia and Russia.

-

 Education1 week ago
How Hard Is It to Get Into an Ivy League School?
-

 Technology2 weeks ago
Ranked: Semiconductor Companies by Industry Revenue Share
-

 Markets2 weeks ago
Ranked: The World’s Top Flight Routes, by Revenue
-

 Demographics2 weeks ago
Population Projections: The World’s 6 Largest Countries in 2075
-

 Markets2 weeks ago
The Top 10 States by Real GDP Growth in 2023
-

 Demographics2 weeks ago
The Smallest Gender Wage Gaps in OECD Countries
-

 Economy2 weeks ago
Where U.S. Inflation Hit the Hardest in March 2024
-

 Green2 weeks ago
Top Countries By Forest Growth Since 2001