United States
Charted: America’s Import Reliance of Key Minerals
![]() Subscribe to the Elements free mailing list for more like this
Subscribe to the Elements free mailing list for more like this
Charted: America’s Import Reliance of Key Minerals
This was originally posted on Elements. Sign up to the free mailing list to get beautiful visualizations on real assets and resource megatrends each week.
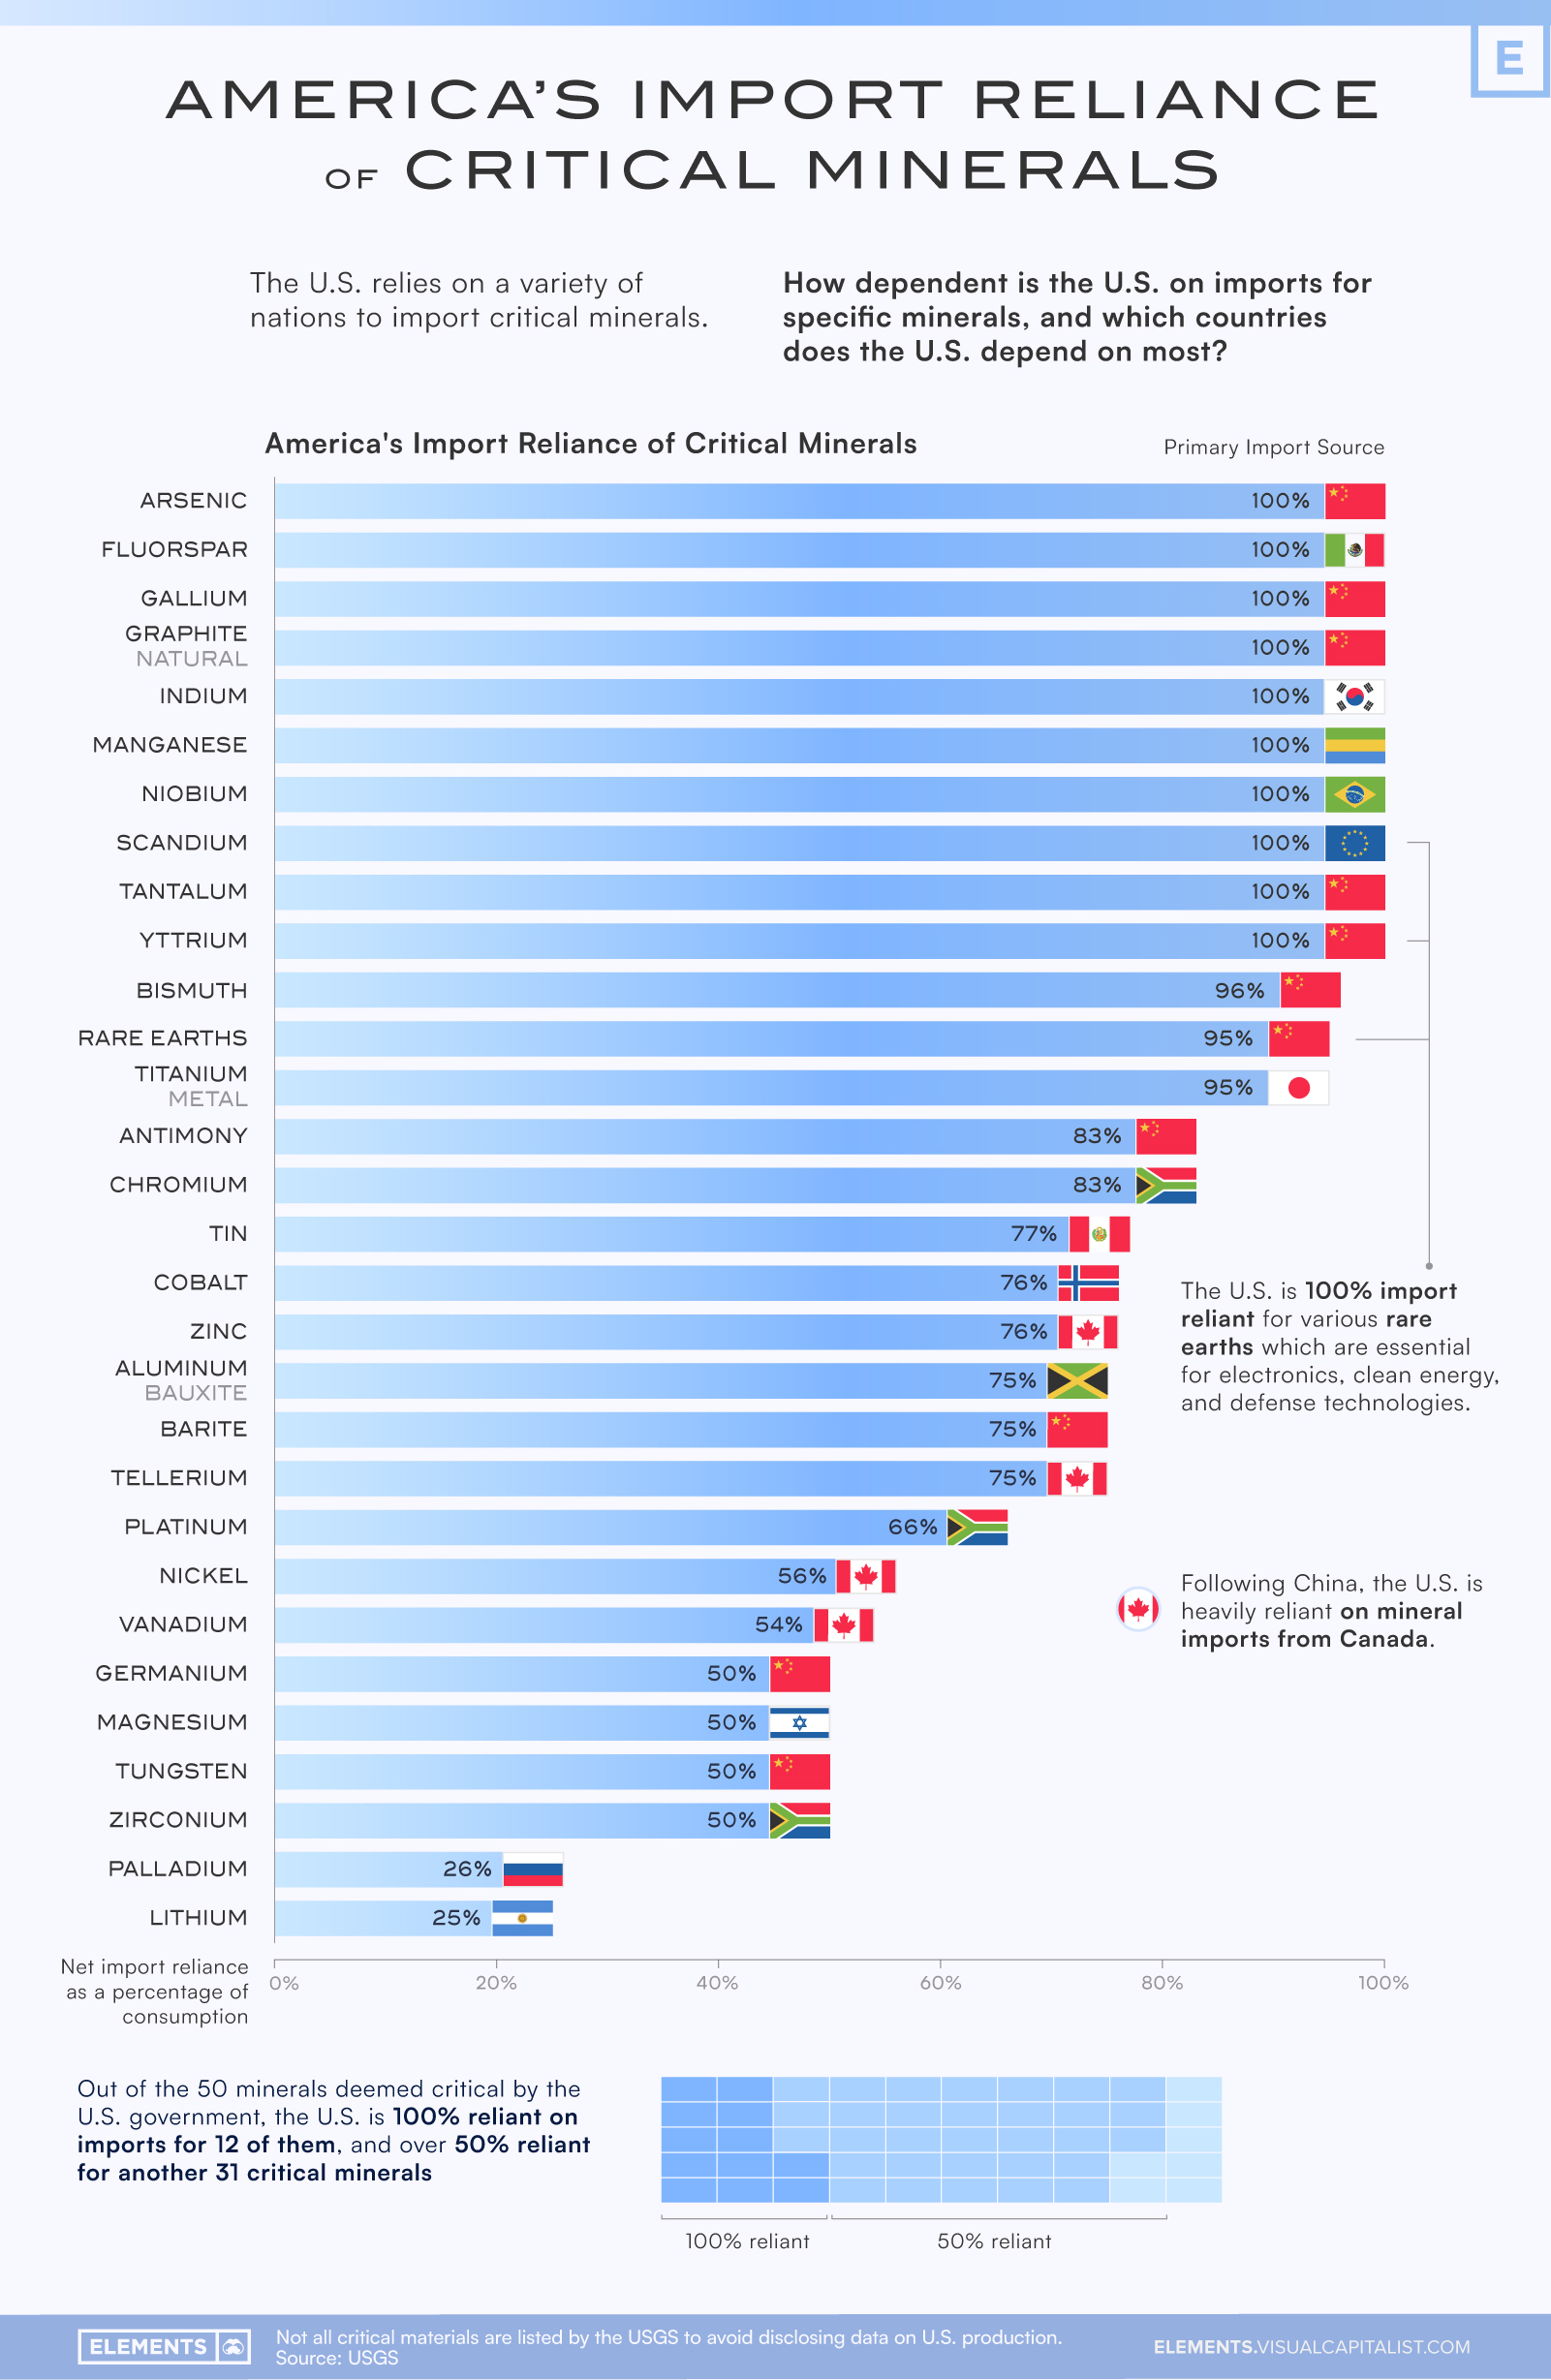
The push towards a more sustainable future requires various key minerals to build the infrastructure of the green economy. However, the U.S. is heavily reliant on nonfuel mineral imports causing potential vulnerabilities in the nation’s supply chains.
Specifically, the U.S. is 100% reliant on imports for at least 12 key minerals deemed critical by the government, with China being the primary import source for many of these along with many other critical minerals.
This graphic uses data from the U.S. Geological Survey (USGS) to visualize America’s import dependence for 30 different key nonfuel minerals along with the nation that the U.S. primarily imports each mineral from.
U.S. Import Reliance, by Mineral
While the U.S. mines and processes a significant amount of minerals domestically, in 2022 imports still accounted for more than half of the country’s consumption of 51 nonfuel minerals. The USGS calculates a net import reliance as a percentage of apparent consumption, showing how much of U.S. demand for each mineral is met through imports.
Of the most important minerals deemed by the USGS, the U.S. was 95% or more reliant on imports for 13 different minerals, with China being the primary import source for more than half of these.
| Mineral | Net Import Reliance as Percentage of Consumption | Primary Import Source (2018-2021) |
|---|---|---|
| Arsenic | 100% | 🇨🇳 China |
| Fluorspar | 100% | 🇲🇽 Mexico |
| Gallium | 100% | 🇨🇳 China |
| Graphite (natural) | 100% | 🇨🇳 China |
| Indium | 100% | 🇰🇷 Republic of Korea |
| Manganese | 100% | 🇬🇦 Gabon |
| Niobium | 100% | 🇧🇷 Brazil |
| Scandium | 100% | 🇪🇺 Europe |
| Tantalum | 100% | 🇨🇳 China |
| Yttrium | 100% | 🇨🇳 China |
| Bismuth | 96% | 🇨🇳 China |
| Rare Earths (compounds and metals) | 95% | 🇨🇳 China |
| Titanium (metal) | 95% | 🇯🇵 Japan |
| Antimony | 83% | 🇨🇳 China |
| Chromium | 83% | 🇿🇦 South Africa |
| Tin | 77% | 🇵🇪 Peru |
| Cobalt | 76% | 🇳🇴 Norway |
| Zinc | 76% | 🇨🇦 Canada |
| Aluminum (bauxite) | 75% | 🇯🇲 Jamaica |
| Barite | 75% | 🇨🇳 China |
| Tellerium | 75% | 🇨🇦 Canada |
| Platinum | 66% | 🇿🇦 South Africa |
| Nickel | 56% | 🇨🇦 Canada |
| Vanadium | 54% | 🇨🇦 Canada |
| Germanium | 50% | 🇨🇳 China |
| Magnesium | 50% | 🇮🇱 Israel |
| Tungsten | 50% | 🇨🇳 China |
| Zirconium | 50% | 🇿🇦 South Africa |
| Palladium | 26% | 🇷🇺 Russia |
| Lithium | 25% | 🇦🇷 Argentina |
These include rare earths (a group of 17 nearly indistinguishable heavy metals with similar properties) which are essential in technology, high-powered magnets, electronics, and industry, along with natural graphite which is found in lithium-ion batteries.
These are all on the U.S. government’s critical mineral list which has a total of 50 minerals, and the U.S. is 50% or more import reliant for 43 of these minerals.
Some other minerals on the official list which the U.S. is 100% reliant on imports for are arsenic, fluorspar, indium, manganese, niobium, and tantalum, which are used in a variety of applications like the production of alloys and semiconductors along with the manufacturing of electronic components like LCD screens and capacitors.
China’s Gallium and Germanium Restrictions
America’s dependence on imports for various minerals has resulted in a new challenge resulting from China’s announced export restrictions on gallium and germanium that took effect August 1st, 2023. The U.S. is 100% import dependent for gallium and 50% import dependent for germanium.
These restrictions are seen as a retaliation against U.S. and EU sanctions on China which have restricted the export of chips and chipmaking equipment.
Both gallium and germanium are used in the production of transistors and semiconductors along with solar panels and cells, and these export restrictions present an additional hurdle for critical U.S. supply chains of various technologies that include LED lights and fiber-optic systems used for high-speed data transmission.
The restrictions also affect the European Union, which imports 71% of its gallium and 45% of its germanium from China. It’s another stark reminder to the world of China’s dominance in the production and processing of many key minerals.
The announcement of these restrictions has only highlighted the importance for the U.S. and other nations to reduce import dependence and diversify supply chains of key minerals and technologies.


United States
Ranked: The Largest U.S. Corporations by Number of Employees
We visualized the top U.S. companies by employees, revealing the massive scale of retailers like Walmart, Target, and Home Depot.


The Largest U.S. Corporations by Number of Employees
This was originally posted on our Voronoi app. Download the app for free on Apple or Android and discover incredible data-driven charts from a variety of trusted sources.
Revenue and profit are common measures for measuring the size of a business, but what about employee headcount?
To see how big companies have become from a human perspective, we’ve visualized the top U.S. companies by employees. These figures come from companiesmarketcap.com, and were accessed in March 2024. Note that this ranking includes publicly-traded companies only.
Data and Highlights
The data we used to create this list of largest U.S. corporations by number of employees can be found in the table below.
| Company | Sector | Number of Employees |
|---|---|---|
| Walmart | Consumer Staples | 2,100,000 |
| Amazon | Consumer Discretionary | 1,500,000 |
| UPS | Industrials | 500,000 |
| Home Depot | Consumer Discretionary | 470,000 |
| Concentrix | Information Technology | 440,000 |
| Target | Consumer Staples | 440,000 |
| Kroger | Consumer Staples | 430,000 |
| UnitedHealth | Health Care | 400,000 |
| Berkshire Hathaway | Financials | 383,000 |
| Starbucks | Consumer Discretionary | 381,000 |
| Marriott International | Consumer Discretionary | 377,000 |
| Cognizant | Information Technology | 346,600 |
Retail and Logistics Top the List
Companies like Walmart, Target, and Kroger have a massive headcount due to having many locations spread across the country, which require everything from cashiers to IT professionals.
Moving goods around the world is also highly labor intensive, explaining why UPS has half a million employees globally.
Below the Radar?
Two companies that rank among the largest U.S. corporations by employees which may be less familiar to the public include Concentrix and Cognizant. Both of these companies are B2B brands, meaning they primarily work with other companies rather than consumers. This contrasts with brands like Amazon or Home Depot, which are much more visible among average consumers.
A Note on Berkshire Hathaway
Warren Buffett’s company doesn’t directly employ 383,000 people. This headcount actually includes the employees of the firm’s many subsidiaries, such as GEICO (insurance), Dairy Queen (retail), and Duracell (batteries).
If you’re curious to see how Buffett’s empire has grown over the years, check out this animated graphic that visualizes the growth of Berkshire Hathaway’s portfolio from 1994 to 2022.

-

 Debt1 week ago
How Debt-to-GDP Ratios Have Changed Since 2000
-

 Markets2 weeks ago
Ranked: The World’s Top Flight Routes, by Revenue
-

 Countries2 weeks ago
Population Projections: The World’s 6 Largest Countries in 2075
-

 Markets2 weeks ago
The Top 10 States by Real GDP Growth in 2023
-

 Demographics2 weeks ago
The Smallest Gender Wage Gaps in OECD Countries
-

 United States2 weeks ago
Where U.S. Inflation Hit the Hardest in March 2024
-

 Green2 weeks ago
Top Countries By Forest Growth Since 2001
-

 United States2 weeks ago
Ranked: The Largest U.S. Corporations by Number of Employees