Mining
The 50 Minerals Critical to U.S. Security
![]() Subscribe to the Elements free mailing list for more like this
Subscribe to the Elements free mailing list for more like this


The 50 Minerals Critical to U.S. Security
This was originally posted on Elements. Sign up to the free mailing list to get beautiful visualizations on natural resource megatrends in your email every week.
The U.S. aims to cut its greenhouse gas emissions in half by 2030 as part of its commitment to tackling climate change, but might be lacking the critical minerals needed to achieve its goals.
The American green economy will rely on renewable sources of energy like wind and solar, along with the electrification of transportation. However, local production of the raw materials necessary to produce these technologies, including solar panels, wind turbines, and electric vehicles, is lacking. Understandably, this has raised concerns in Washington.
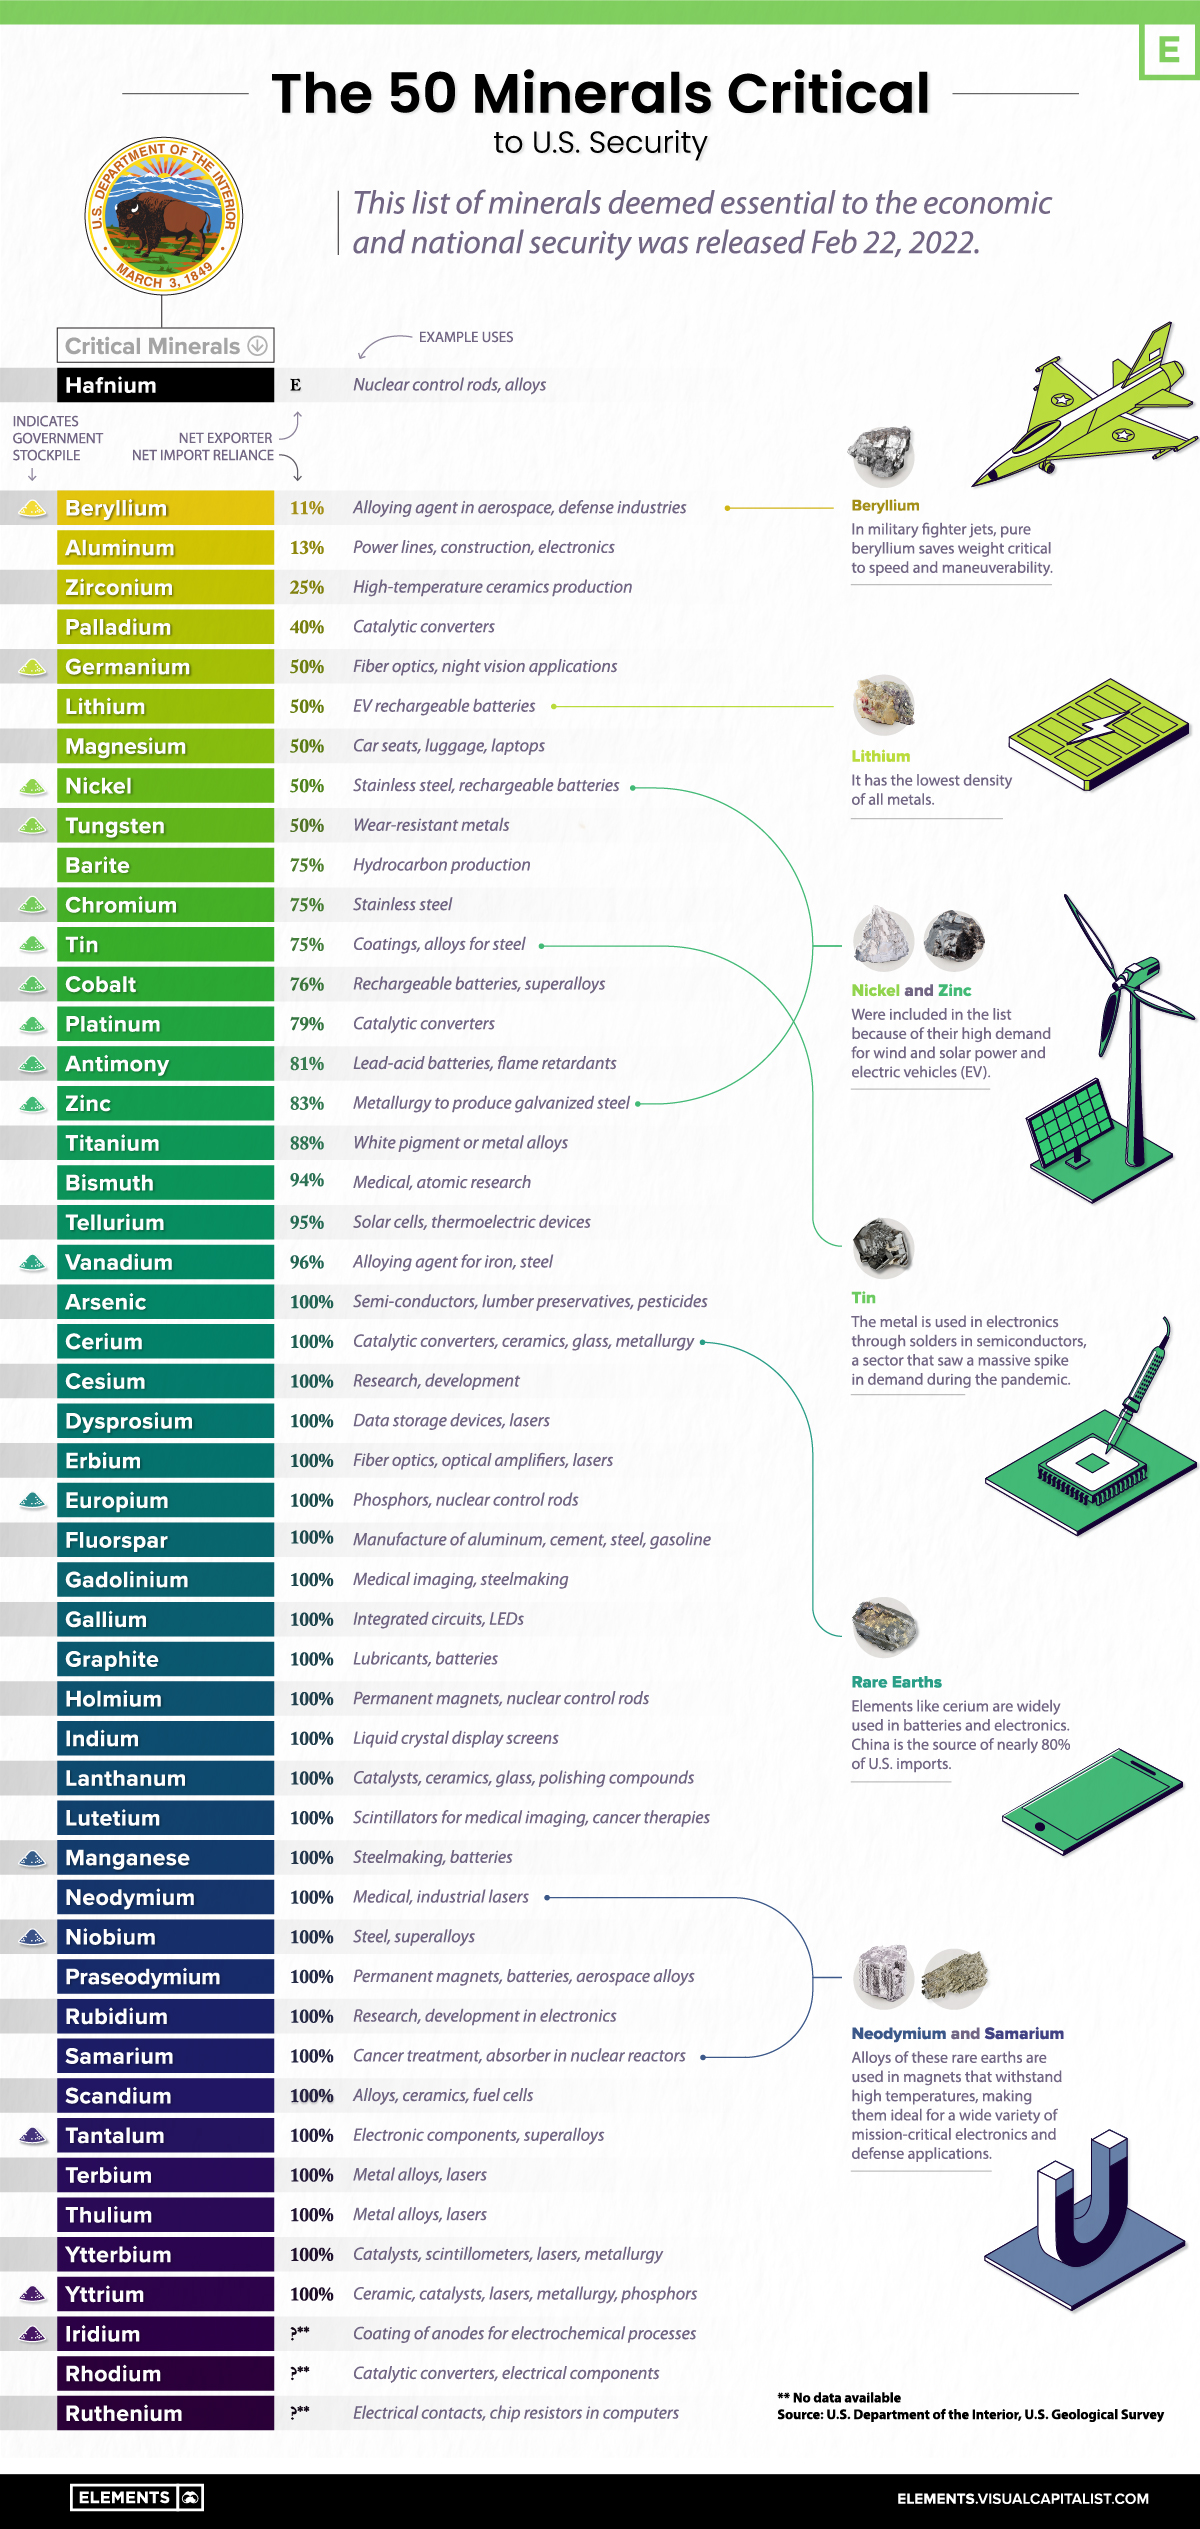
In this graphic, based on data from the U.S. Geological Survey, we list all of the minerals that the government has deemed critical to both the economic and national security of the United States.
What are Critical Minerals?
A critical mineral is defined as a non-fuel material considered vital for the economic well-being of the world’s major and emerging economies, whose supply may be at risk. This can be due to geological scarcity, geopolitical issues, trade policy, or other factors.
In 2018, the U.S. Department of the Interior released a list of 35 critical minerals. The new list, released in February 2022, contains 15 more commodities.
Much of the increase in the new list is the result of splitting the rare earth elements and platinum group elements into individual entries rather than including them as “mineral groups.” In addition, the 2022 list of critical minerals adds nickel and zinc to the list while removing helium, potash, rhenium, and strontium.
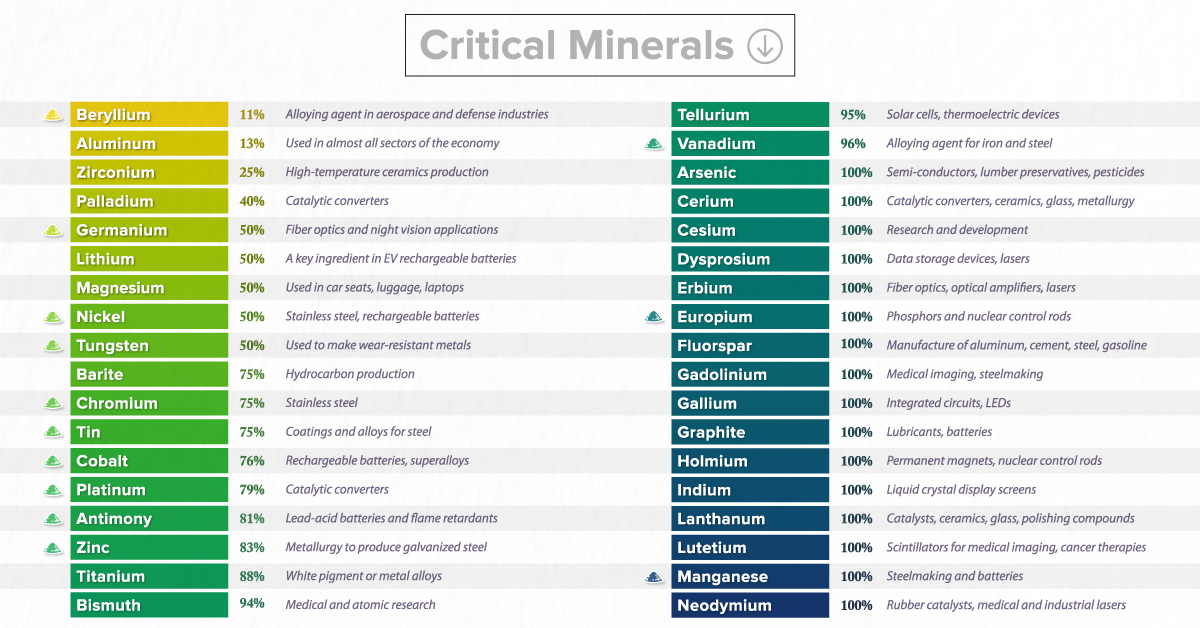
| Mineral | Example Uses | Net Import Reliance |
|---|---|---|
| Beryllium | Alloying agent in aerospace, defense industries | 11% |
| Aluminum | Power lines, construction, electronics | 13% |
| Zirconium | High-temparature ceramics production | 25% |
| Palladium | Catalytic converters | 40% |
| Germanium | Fiber optics, night vision applications | 50% |
| Lithium | Rechargeable batteries | 50% |
| Magnesium | Alloys, electronics | 50% |
| Nickel | Stainless steel, rechargeable batteries | 50% |
| Tungsten | Wear-resistant metals | 50% |
| Barite | Hydrocarbon production | 75% |
| Chromium | Stainless steel | 75% |
| Tin | Coatings, alloys for steel | 75% |
| Cobalt | Rechargeable batteries, superalloys | 76% |
| Platinum | Catalytic converters | 79% |
| Antimony | Lead-acid batteries, flame retardants | 81% |
| Zinc | Metallurgy to produce galvanized steel | 83% |
| Titanium | White pigment, metal alloys | 88% |
| Bismuth | Medical, atomic research | 94% |
| Tellurium | Solar cells, thermoelectric devices | 95% |
| Vanadium | Alloying agent for iron and steel | 96% |
| Arsenic | Semi-conductors, lumber preservatives, pesticides | 100% |
| Cerium | Catalytic converters, ceramics, glass, metallurgy | 100% |
| Cesium | Research, development | 100% |
| Dysprosium | Data storage devices, lasers | 100% |
| Erbium | Fiber optics, optical amplifiers, lasers | 100% |
| Europium | Phosphors, nuclear control rods | 100% |
| Fluorspar | Manufacture of aluminum, cement, steel, gasoline | 100% |
| Gadolinium | Medical imaging, steelmaking | 100% |
| Gallium | Integrated circuits, LEDs | 100% |
| Graphite | Lubricants, batteries | 100% |
| Holmium | Permanent magnets, nuclear control rods | 100% |
| Indium | Liquid crystal display screens | 100% |
| Lanthanum | Catalysts, ceramics, glass, polishing compounds | 100% |
| Lutetium | Scintillators for medical imaging, cancer therapies | 100% |
| Manganese | Steelmaking, batteries | 100% |
| Neodymium | Rubber catalysts, medical, industrial lasers | 100% |
| Niobium | Steel, superalloys | 100% |
| Praseodymium | Permanent magnets, batteries, aerospace alloys | 100% |
| Rubidium | Research, development in electronics | 100% |
| Samarium | Cancer treatment, absorber in nuclear reactors | 100% |
| Scandium | Alloys, ceramics, fuel cells | 100% |
| Tantalum | Electronic components, superalloys | 100% |
| Terbium | Permanent magnets, fiber optics, lasers | 100% |
| Thulium | Metal alloys, lasers | 100% |
| Ytterbium | Catalysts, scintillometers, lasers, metallurgy | 100% |
| Yttrium | Ceramic, catalysts, lasers, metallurgy, phosphors | 100% |
| Iridium | Coating of anodes for electrochemical processes | No data available |
| Rhodium | Catalytic converters, electrical components | No data available |
| Ruthenium | Electrical contacts, chip resistors in computers | No data available |
| Hafnium | Nuclear control rods, alloys | Net exporter |
The challenge for the U.S. is that the local production of these raw materials is extremely limited.
For instance, in 2021 there was only one operating nickel mine in the country, the Eagle mine in Michigan. The facility ships its concentrates abroad for refining and is scheduled to close in 2025. Likewise, the country only hosted one lithium mine, the Silver Peak Mine in Nevada.
At the same time, most of the country’s supply of critical minerals depends on countries that have historically competed with America.
China’s Dominance in Minerals
Perhaps unsurprisingly, China is the single largest supply source of mineral commodities for the United States.
Cesium, a critical metal used in a wide range of manufacturing, is one example. There are only three pegmatite mines in the world that can produce cesium, and all were controlled by Chinese companies in 2021.
Furthermore, China refines nearly 90% of the world’s rare earths. Despite the name, these elements are abundant on the Earth’s crust and make up the majority of listed critical minerals. They are essential for a variety of products like EVs, advanced ceramics, computers, smartphones, wind turbines, monitors, and fiber optics.
After China, the next largest source of mineral commodities to the United States has been Canada, which provided the United States with 16 different elements in 2021.
The Rising Demand for Critical Minerals
As the world’s clean energy transitions gather pace, demand for critical minerals is expected to grow quickly.
According to the International Energy Association, the rise of low-carbon power generation is projected to triple mineral demand from this sector by 2040.
The shift to a sustainable economy is important, and consequently, securing the critical minerals necessary for it is just as vital.


Lithium
Ranked: The Top 10 EV Battery Manufacturers in 2023
Asia dominates this ranking of the world’s largest EV battery manufacturers in 2023.


The Top 10 EV Battery Manufacturers in 2023
This was originally posted on our Voronoi app. Download the app for free on iOS or Android and discover incredible data-driven charts from a variety of trusted sources.
Despite efforts from the U.S. and EU to secure local domestic supply, all major EV battery manufacturers remain based in Asia.
In this graphic we rank the top 10 EV battery manufacturers by total battery deployment (measured in megawatt-hours) in 2023. The data is from EV Volumes.
Chinese Dominance
Contemporary Amperex Technology Co. Limited (CATL) has swiftly risen in less than a decade to claim the title of the largest global battery group.
The Chinese company now has a 34% share of the market and supplies batteries to a range of made-in-China vehicles, including the Tesla Model Y, SAIC’s MG4/Mulan, and various Li Auto models.
| Company | Country | 2023 Production (megawatt-hour) | Share of Total Production |
|---|---|---|---|
| CATL | 🇨🇳 China | 242,700 | 34% |
| BYD | 🇨🇳 China | 115,917 | 16% |
| LG Energy Solution | 🇰🇷 Korea | 108,487 | 15% |
| Panasonic | 🇯🇵 Japan | 56,560 | 8% |
| SK On | 🇰🇷 Korea | 40,711 | 6% |
| Samsung SDI | 🇰🇷 Korea | 35,703 | 5% |
| CALB | 🇨🇳 China | 23,493 | 3% |
| Farasis Energy | 🇨🇳 China | 16,527 | 2% |
| Envision AESC | 🇨🇳 China | 8,342 | 1% |
| Sunwoda | 🇨🇳 China | 6,979 | 1% |
| Other | - | 56,040 | 8% |
In 2023, BYD surpassed LG Energy Solution to claim second place. This was driven by demand from its own models and growth in third-party deals, including providing batteries for the made-in-Germany Tesla Model Y, Toyota bZ3, Changan UNI-V, Venucia V-Online, as well as several Haval and FAW models.
The top three battery makers (CATL, BYD, LG) collectively account for two-thirds (66%) of total battery deployment.
Once a leader in the EV battery business, Panasonic now holds the fourth position with an 8% market share, down from 9% last year. With its main client, Tesla, now sourcing batteries from multiple suppliers, the Japanese battery maker seems to be losing its competitive edge in the industry.
Overall, the global EV battery market size is projected to grow from $49 billion in 2022 to $98 billion by 2029, according to Fortune Business Insights.

-

 Debt1 week ago
How Debt-to-GDP Ratios Have Changed Since 2000
-

 Markets2 weeks ago
Ranked: The World’s Top Flight Routes, by Revenue
-

 Countries2 weeks ago
Population Projections: The World’s 6 Largest Countries in 2075
-

 Markets2 weeks ago
The Top 10 States by Real GDP Growth in 2023
-

 Demographics2 weeks ago
The Smallest Gender Wage Gaps in OECD Countries
-

 Economy2 weeks ago
Where U.S. Inflation Hit the Hardest in March 2024
-

 Green2 weeks ago
Top Countries By Forest Growth Since 2001
-

 United States2 weeks ago
Ranked: The Largest U.S. Corporations by Number of Employees