Misc
Mapped: Where America’s Truckers Live, by State
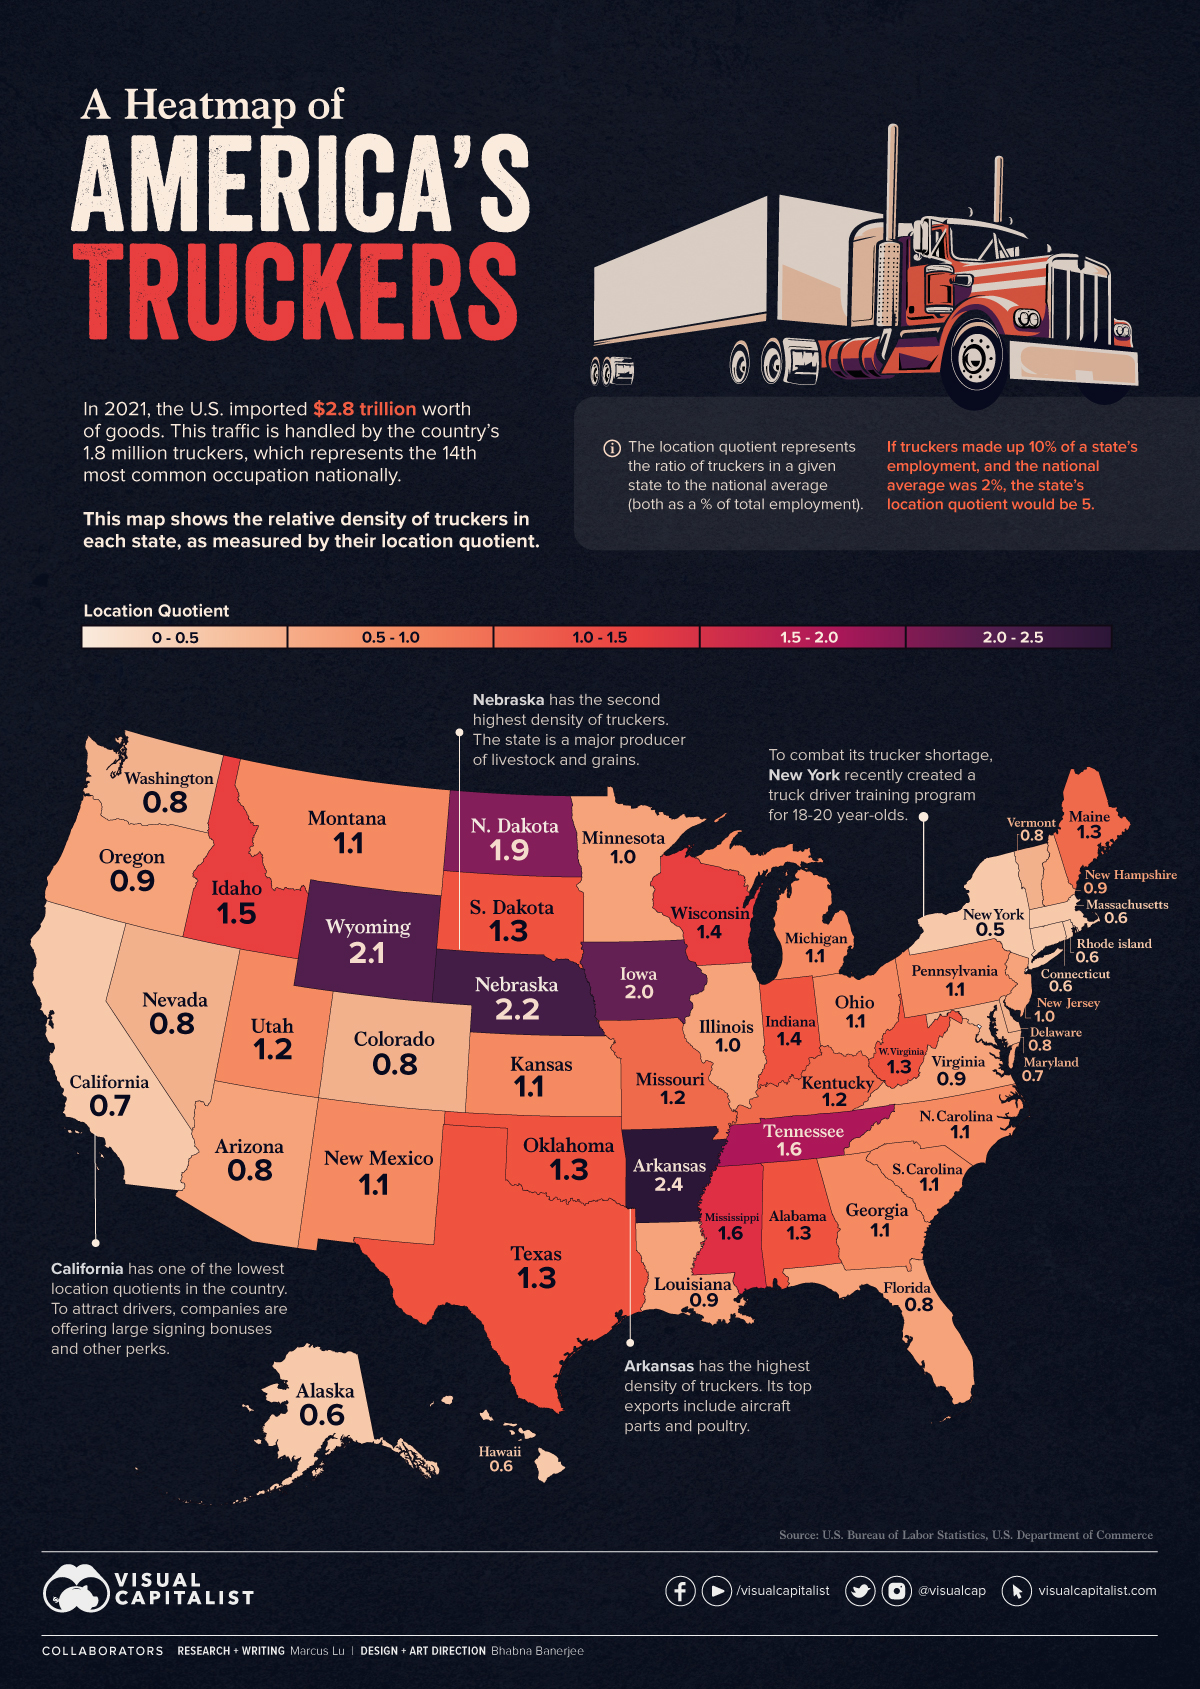


A Heatmap of America’s Truckers
In 2021, the U.S. imported $2.8 trillion worth of goods.
This incredible quantity of goods—along with much of what is produced domestically—is handled by the country’s 1.8 million truckers, which represents the 14th most common occupation nationally.
To see how these truckers are distributed across the nation, we’ve visualized data from the U.S. Bureau of Labor Statistics (BLS) to create two separate heat maps.
Key Findings from the Data
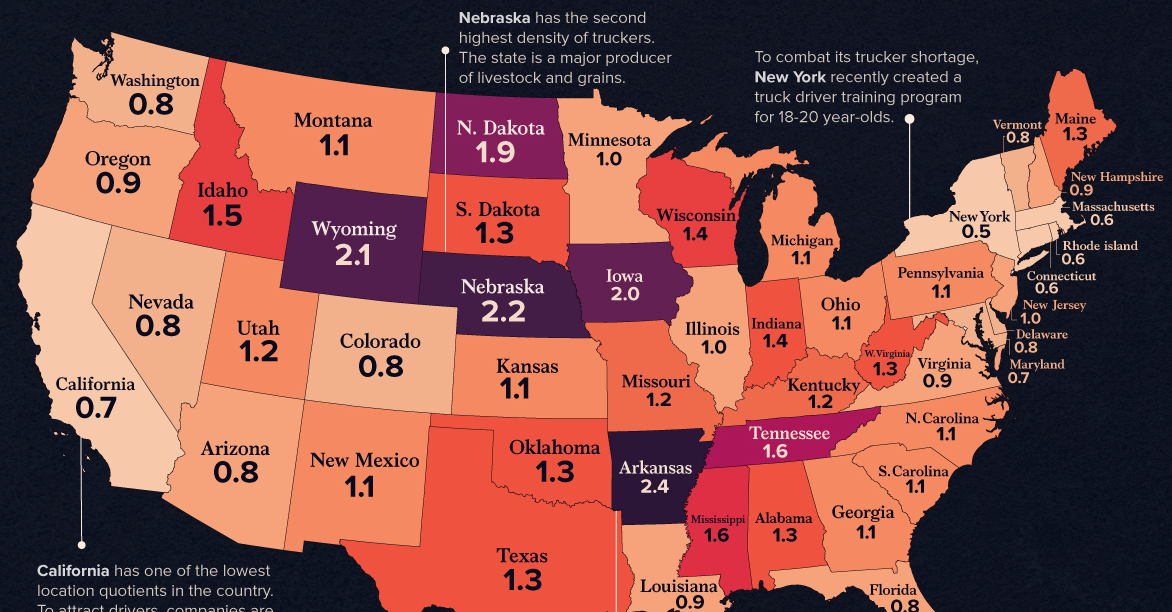
The relative density of each state’s truckers is measured by their location quotient.
This represents the ratio of truckers in a state compared to the national average (both as a % of total employment). For example, if truckers made up 10% of a state’s employment, and the national average was 2%, the location quotient for that state would be 5.
This data is listed in the table below.
| State | Location Quotient |
|---|---|
| Arkansas | 2.4 |
| Nebraska | 2.2 |
| Wyoming | 2.1 |
| Iowa | 2 |
| North Dakota | 1.9 |
| Tennessee | 1.6 |
| Mississippi | 1.6 |
| Idaho | 1.5 |
| Wisconsin | 1.4 |
| Indiana | 1.4 |
| Alabama | 1.3 |
| South Dakota | 1.3 |
| West Virginia | 1.3 |
| Oklahoma | 1.3 |
| Texas | 1.3 |
| Maine | 1.3 |
| Missouri | 1.2 |
| Kentucky | 1.2 |
| Utah | 1.2 |
| Pennsylvania | 1.1 |
| Kansas | 1.1 |
| New Mexico | 1.1 |
| Georgia | 1.1 |
| Ohio | 1.1 |
| Michigan | 1.1 |
| Montana | 1.1 |
| South Carolina | 1.1 |
| North Carolina | 1.1 |
| New Jersey | 1 |
| Minnesota | 1 |
| Illinois | 1 |
| Oregon | 0.9 |
| Louisiana | 0.9 |
| Virginia | 0.9 |
| New Hampshire | 0.9 |
| Arizona | 0.8 |
| Delaware | 0.8 |
| Florida | 0.8 |
| Vermont | 0.8 |
| Colorado | 0.8 |
| Washington | 0.8 |
| Nevada | 0.8 |
| Maryland | 0.7 |
| California | 0.7 |
| Connecticut | 0.6 |
| Rhode Island | 0.6 |
| Alaska | 0.6 |
| Massachusetts | 0.6 |
| Hawaii | 0.6 |
| New York | 0.5 |
| District of Columbia | 0.1 |
There are four states with a location quotient of two or more: Arkansas, Nebraska, Wyoming, and Iowa. This means that their trucker workforce (as a % of total employment) is at least double the national average.
On the other hand, California and New York have some of the lowest location quotients in the country. Trucking companies have been competing fiercely to attract drivers in these areas, but with limited success.
At a time when the whole American population is aging, truck drivers tend to be older than average. The work is stressful, lonely, exhausting and long plagued by a pay system that can make drivers feel they can’t get ahead of the game.
– Los Angeles Times
To entice more young people to enter the industry, New York recently created a truck driver training program for 18-20 year olds. Some have voiced their concerns about safety, though few alternatives exist. In October 2021, the American Trucking Association (ATA) announced that the national driver shortage had reached a record-breaking 80,000.
A Different Perspective
The location quotient is an effective measure because it controls for the differences in each state’s population. Seeing the raw data, though, can still add useful perspective.
The following image shows the number of trucker’s in each state. As a reminder, the national total is 1.8 million.
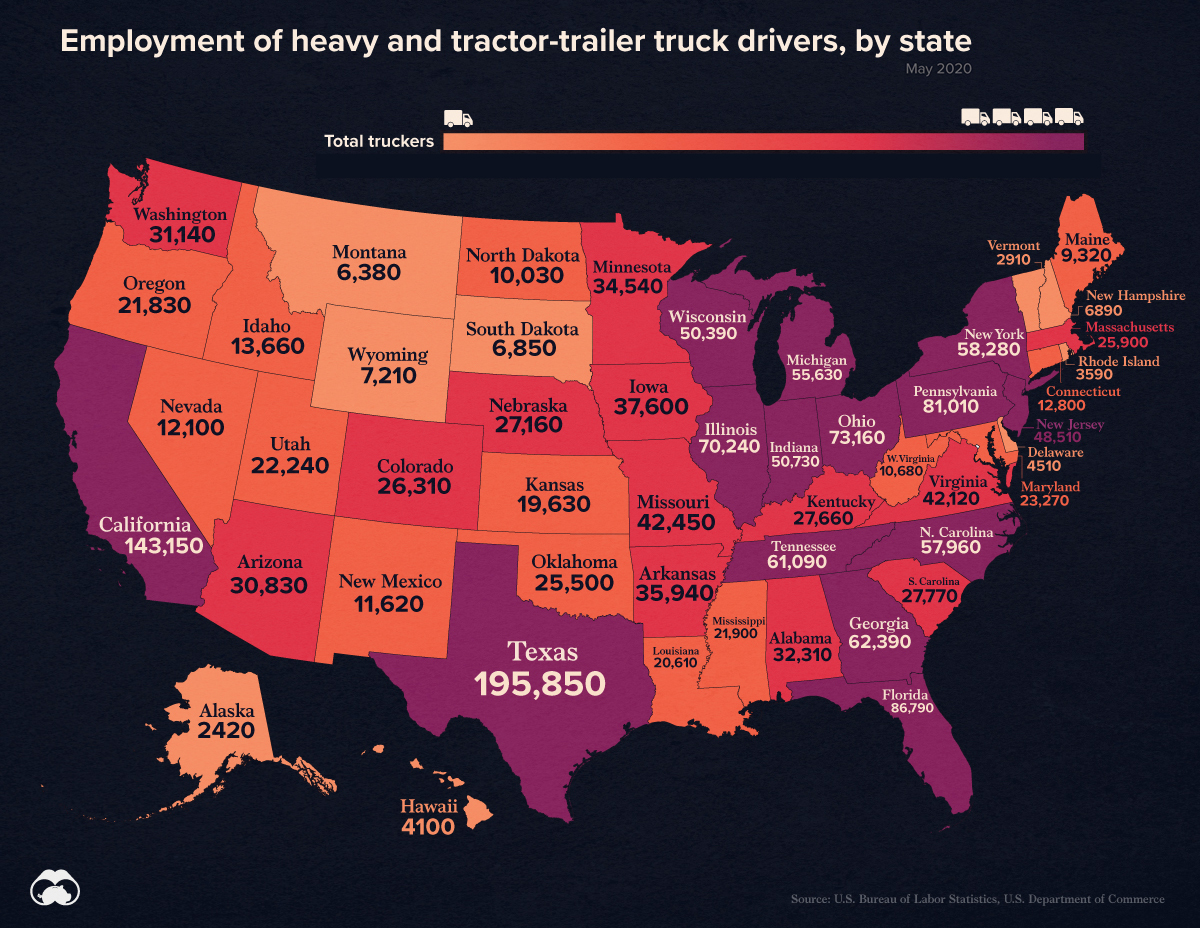
With these numbers, we can gain a more practical understanding of the location quotient. For instance, California has the second highest number of truckers, but it’s dwarfed by the state’s massive population of 40 million.
Occupation Outlook
The BLS expects employment of truck drivers to grow by 6% from 2020 to 2030, which is close to the national average for all jobs. Based on total employment of 1.8 million, this would translate to 108,000 new openings.
Whether these openings will be filled is an entirely different story.
In the American Trucking Association’s latest report, analysts estimate that the industry will need to recruit 1 million drivers just to replace retiring drivers, or those that leave voluntarily.


VC+
VC+: Get Our Key Takeaways From the IMF’s World Economic Outlook
A sneak preview of the exclusive VC+ Special Dispatch—your shortcut to understanding IMF’s World Economic Outlook report.

Have you read IMF’s latest World Economic Outlook yet? At a daunting 202 pages, we don’t blame you if it’s still on your to-do list.
But don’t worry, you don’t need to read the whole April release, because we’ve already done the hard work for you.
To save you time and effort, the Visual Capitalist team has compiled a visual analysis of everything you need to know from the report—and our VC+ Special Dispatch is available exclusively to VC+ members. All you need to do is log into the VC+ Archive.
If you’re not already subscribed to VC+, make sure you sign up now to access the full analysis of the IMF report, and more (we release similar deep dives every week).
For now, here’s what VC+ members get to see.
Your Shortcut to Understanding IMF’s World Economic Outlook
With long and short-term growth prospects declining for many countries around the world, this Special Dispatch offers a visual analysis of the key figures and takeaways from the IMF’s report including:
- The global decline in economic growth forecasts
- Real GDP growth and inflation forecasts for major nations in 2024
- When interest rate cuts will happen and interest rate forecasts
- How debt-to-GDP ratios have changed since 2000
- And much more!

Get the Full Breakdown in the Next VC+ Special Dispatch
VC+ members can access the full Special Dispatch by logging into the VC+ Archive, where you can also check out previous releases.
Make sure you join VC+ now to see exclusive charts and the full analysis of key takeaways from IMF’s World Economic Outlook.
Don’t miss out. Become a VC+ member today.
What You Get When You Become a VC+ Member
VC+ is Visual Capitalist’s premium subscription. As a member, you’ll get the following:
- Special Dispatches: Deep dive visual briefings on crucial reports and global trends
- Markets This Month: A snappy summary of the state of the markets and what to look out for
- The Trendline: Weekly curation of the best visualizations from across the globe
- Global Forecast Series: Our flagship annual report that covers everything you need to know related to the economy, markets, geopolitics, and the latest tech trends
- VC+ Archive: Hundreds of previously released VC+ briefings and reports that you’ve been missing out on, all in one dedicated hub
You can get all of the above, and more, by joining VC+ today.

-

 Mining1 week ago
Gold vs. S&P 500: Which Has Grown More Over Five Years?
-

 Markets2 weeks ago
Ranked: The Most Valuable Housing Markets in America
-

 Money2 weeks ago
Which States Have the Highest Minimum Wage in America?
-

 AI2 weeks ago
Ranked: Semiconductor Companies by Industry Revenue Share
-

 Markets2 weeks ago
Ranked: The World’s Top Flight Routes, by Revenue
-

 Countries2 weeks ago
Population Projections: The World’s 6 Largest Countries in 2075
-

 Markets2 weeks ago
The Top 10 States by Real GDP Growth in 2023
-

 Demographics2 weeks ago
The Smallest Gender Wage Gaps in OECD Countries