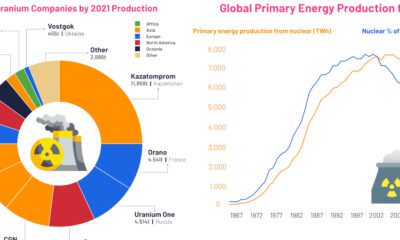

These visuals highlight the uranium mining industry and its output, as well as the trajectory of nuclear energy from 1960 to today.
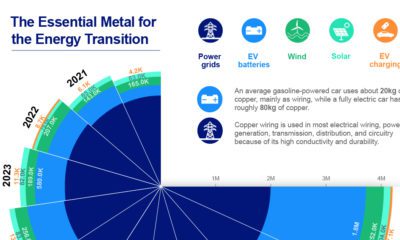

Global copper demand for alternative energy sources is expected to jump from 2.1 million tonnes in 2020 to 4.3 million tonnes in 2030.
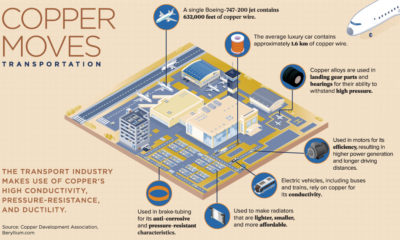

We use copper everywhere in our daily lives. This infographic highlights the uses of copper and its applications in various industries.
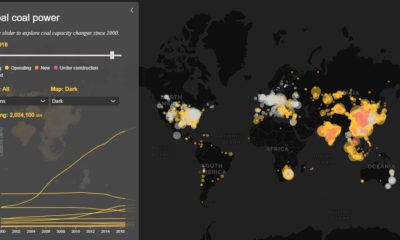

Today’s interactive map shows all of the world's coal power plants, plotted by capacity and carbon emissions from 2000 until 2018.


A clean energy transition is underway as wind, solar, and batteries take center stage. Here's how copper plays the critical role in these technologies.


 Creator Program