Misc
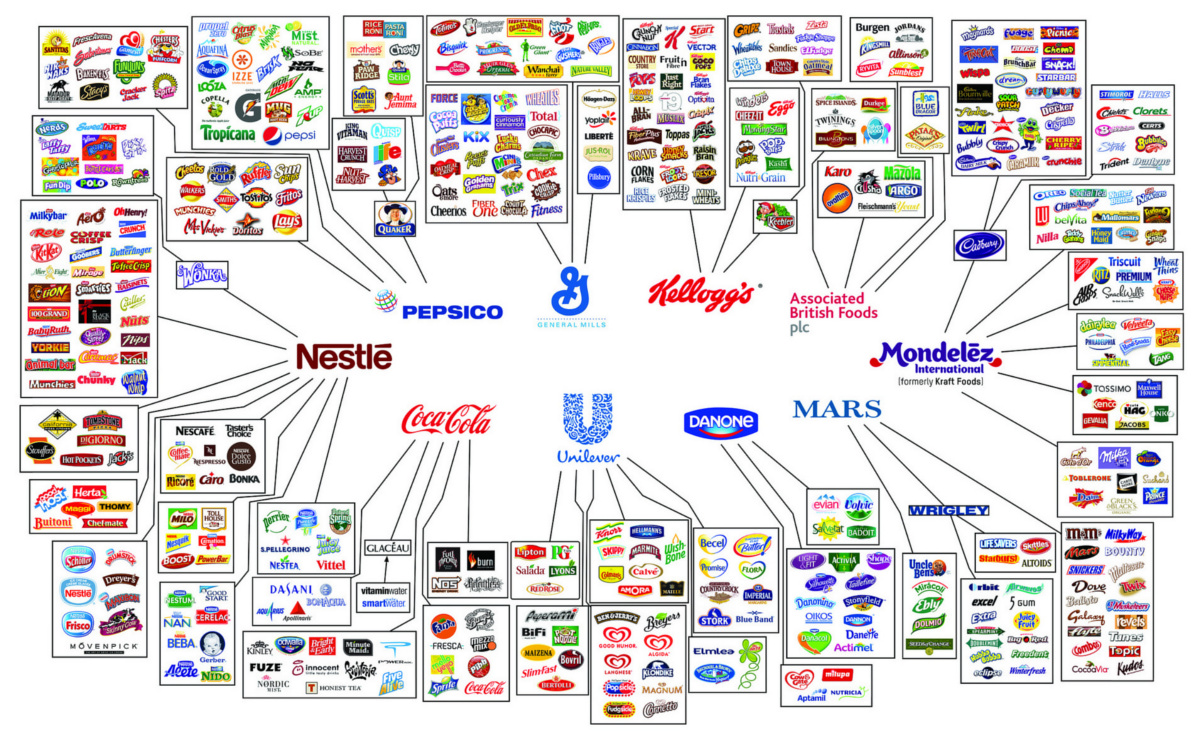
The Illusion of Choice in Consumer Brands
The Illusion of Choice in Consumer Brands
Explore the full-size version of the above graphic in all its glory.
If today’s infographic looks familiar, that’s because it originates from a well-circulated report that Oxfam International puts together to show consolidation in the mass consumer goods industry.
We are sharing it because we believe it is important for you to be aware of who is supplying the different brands and goods served on your dinner table.
Unlikely Links
The illusion of choice does not arise from the products we expect the companies to sell. We inherently know that PepsiCo sells plenty of beverages, including its flagship product. We know that Nestlé makes Kit Kat, Nesquick chocolate syrup, Nespresso coffee machines, and Nescafé instant coffee.
What is less obvious is that Nestlé makes Gerber baby food, Hot Pockets, DiGiorno pizzas, and Stouffer brand frozen foods. Nestlé even owns two competing brands of fancy, carbonated water: San Pellegrino and Perrier.
In fact, Nestlé has at least 29 brands with annual sales over $1 billion. The company literally has hundreds of different products in sectors ranging from pet food to soups and sauces. It’s the world’s largest food company by revenues, and it’s worth a whopping $240 billion in market capitalization.
They Might Be Giants
It’s not just Nestlé that is mind-boggling in size and scope.
Other companies such as Coca-Cola, Kellogg’s, Mondelēz, PepsiCo, General Mills, Danone, and Mars are also massive. They each own dozens of brands that dominate certain product categories.
Want to buy crackers? Pick up some Ritz, Triscuits, Wheat Thins, Air Crisps, or Premium brand crackers – but know they are all owned by Mondelēz (formerly Kraft Foods).
Buying a chocolate bar? There are seemingly hundreds to choose from, but its just the illusion of choice. They pretty much all come from Mars, Nestlé, or Mondelēz (which owns Cadbury).
There’s nothing wrong in buying from these brands, but remember that each dollar of your money is a vote. Vote for products and companies you believe in!
Note: the above graphic is about 1.5 years old, and it misses recent acquisitions or changes in brand ownership. For example, Power Bar is now owned by Post Holdings, another giant consumer foods conglomerate. That said, we believes the point of the graphic still comes across.


VC+
VC+: Get Our Key Takeaways From the IMF’s World Economic Outlook
A sneak preview of the exclusive VC+ Special Dispatch—your shortcut to understanding IMF’s World Economic Outlook report.

Have you read IMF’s latest World Economic Outlook yet? At a daunting 202 pages, we don’t blame you if it’s still on your to-do list.
But don’t worry, you don’t need to read the whole April release, because we’ve already done the hard work for you.
To save you time and effort, the Visual Capitalist team has compiled a visual analysis of everything you need to know from the report—and our VC+ Special Dispatch is available exclusively to VC+ members. All you need to do is log into the VC+ Archive.
If you’re not already subscribed to VC+, make sure you sign up now to access the full analysis of the IMF report, and more (we release similar deep dives every week).
For now, here’s what VC+ members get to see.
Your Shortcut to Understanding IMF’s World Economic Outlook
With long and short-term growth prospects declining for many countries around the world, this Special Dispatch offers a visual analysis of the key figures and takeaways from the IMF’s report including:
- The global decline in economic growth forecasts
- Real GDP growth and inflation forecasts for major nations in 2024
- When interest rate cuts will happen and interest rate forecasts
- How debt-to-GDP ratios have changed since 2000
- And much more!

Get the Full Breakdown in the Next VC+ Special Dispatch
VC+ members can access the full Special Dispatch by logging into the VC+ Archive, where you can also check out previous releases.
Make sure you join VC+ now to see exclusive charts and the full analysis of key takeaways from IMF’s World Economic Outlook.
Don’t miss out. Become a VC+ member today.
What You Get When You Become a VC+ Member
VC+ is Visual Capitalist’s premium subscription. As a member, you’ll get the following:
- Special Dispatches: Deep dive visual briefings on crucial reports and global trends
- Markets This Month: A snappy summary of the state of the markets and what to look out for
- The Trendline: Weekly curation of the best visualizations from across the globe
- Global Forecast Series: Our flagship annual report that covers everything you need to know related to the economy, markets, geopolitics, and the latest tech trends
- VC+ Archive: Hundreds of previously released VC+ briefings and reports that you’ve been missing out on, all in one dedicated hub
You can get all of the above, and more, by joining VC+ today.

-

 Education1 week ago
How Hard Is It to Get Into an Ivy League School?
-

 Technology2 weeks ago
Ranked: Semiconductor Companies by Industry Revenue Share
-

 Markets2 weeks ago
Ranked: The World’s Top Flight Routes, by Revenue
-

 Demographics2 weeks ago
Population Projections: The World’s 6 Largest Countries in 2075
-

 Markets2 weeks ago
The Top 10 States by Real GDP Growth in 2023
-

 Demographics2 weeks ago
The Smallest Gender Wage Gaps in OECD Countries
-

 Economy2 weeks ago
Where U.S. Inflation Hit the Hardest in March 2024
-

 Green2 weeks ago
Top Countries By Forest Growth Since 2001