Economy
Mapping The Biggest Companies By Market Cap in 60 Countries
View the full-size version of this infographic
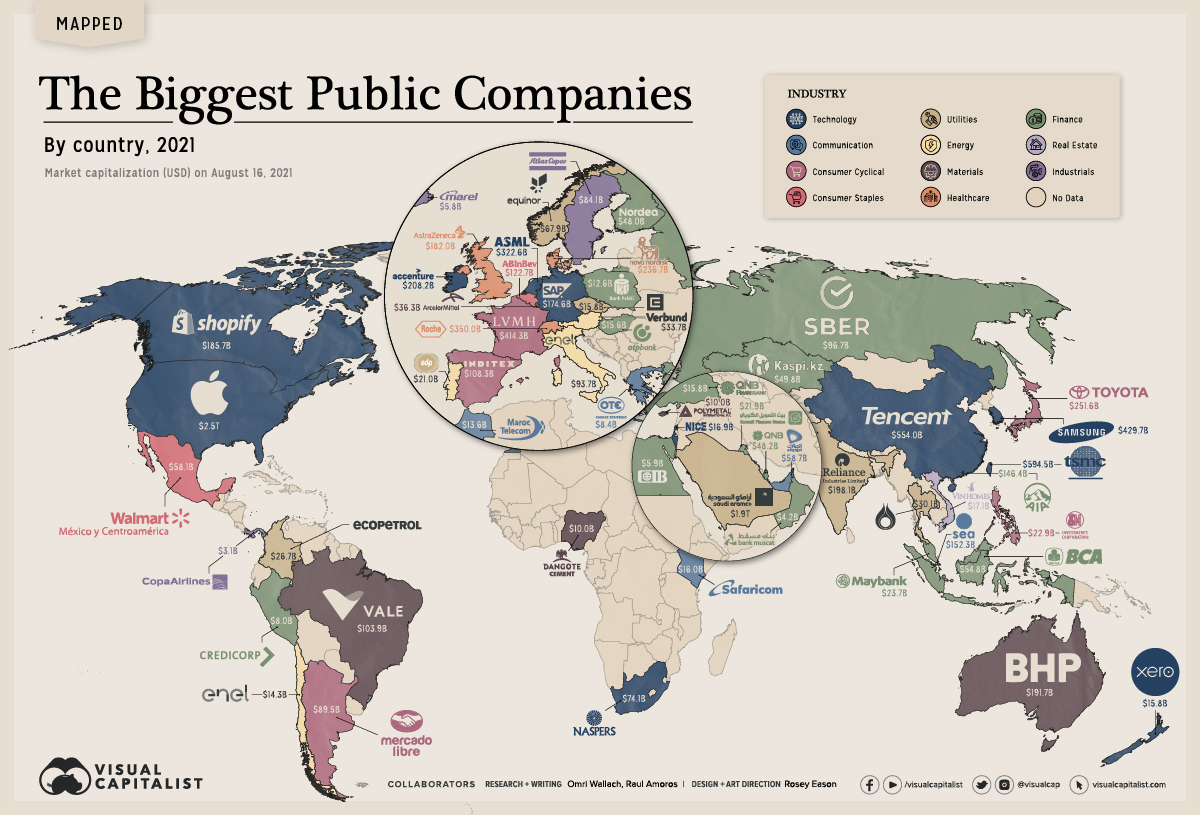


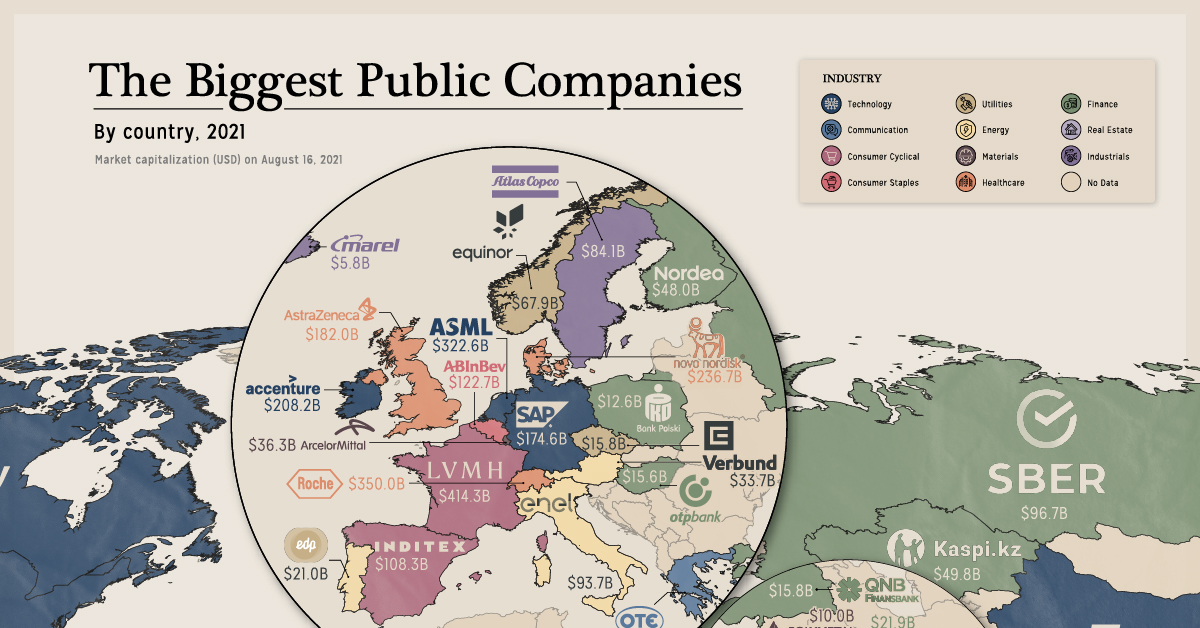
The Biggest Companies By Market Cap in 60 Countries
Tech giants are increasingly making up more of the Fortune 500, but the world’s biggest companies by market cap aren’t so cut and dry.
Despite accounting for the largest market caps worldwide—with trillion-dollar companies like Apple and contenders including Tencent and Samsung—tech wealth is largely concentrated in just a handful of countries.
So what are the biggest companies in each country? We mapped the largest company by market cap across 60 countries in August 2021 using market data from CompaniesMarketCap, TradingView, and MarketScreener.
What are the Largest Companies in the World?
The world has 60+ stock exchanges, and each one has a top company. We looked at the largest local company, since many of the world’s largest firms trade on multiple exchanges, and converted market cap to USD.
| Country | Company | Industry | Market Cap (August 2021) |
|---|---|---|---|
| USA | Apple | Technology | $2.5T |
| Saudi Arabia | Saudi Aramco | Energy | $1.9T |
| Taiwan | TSMC | Technology | $594.5B |
| China | Tencent | Technology | $554.0B |
| South Korea | Samsung | Technology | $429.7B |
| France | LVMH | Consumer Cyclical | $414.3B |
| Switzerland | Roche | Healthcare | $350.0B |
| Netherlands | ASML | Technology | $322.6B |
| Japan | Toyota | Consumer Cyclical | $251.6B |
| Denmark | Novo Nordisk | Healthcare | $236.7B |
| Ireland | Accenture | Technology | $208.2B |
| India | Reliance Industries | Energy | $198.1B |
| Australia | BHP Group | Materials | $191.7B |
| Canada | Shopify | Technology | $185.7B |
| UK | Astrazeneca | Healthcare | $182.0B |
| Germany | SAP | Technology | $174.6B |
| Singapore | SEA | Technology | $152.3B |
| Hong Kong | AIA | Financials | $146.4B |
| Belgium | Anheuser-Busch Inbev | Consumer Staples | $122.7B |
| Spain | Inditex | Consumer Cyclical | $108.3B |
| Brazil | VALE | Materials | $103.9B |
| Russia | Sberbank | Financials | $96.7B |
| Italy | Enel | Utilities | $93.7B |
| Argentina | MercadoLibre | Consumer Cyclical | $89.5B |
| Sweden | Atlas Copco | Industrials | $84.1B |
| South Africa | Naspers | Technology | $74.1B |
| Norway | Equinor | Energy | $67.9B |
| UAE | Etisalat | Communication | $58.7B |
| Mexico | Walmex | Consumer Staples | $58.1B |
| Indonesia | Bank Cental Asia | Financials | $54.8B |
| Kazakhstan | Kaspi.kz | Financials | $49.8B |
| Qatar | QNB | Financials | $48.2B |
| Finland | Nordea Bank | Financials | $48.0B |
| Luxembourg | ArcelorMittal | Materials | $36.3B |
| Austria | Verbund | Utilities | $33.7B |
| Thailand | PTT PCL | Energy | $30.1B |
| Colombia | Ecopetrol | Energy | $26.7B |
| Malaysia | Maybank | Financials | $23.7B |
| Philippines | SM Investments | Consumer Cyclical | $22.9B |
| Kuwait | Kuwait Finance House | Financials | $21.9B |
| Portugal | EDP Group | Utilities | $21.0B |
| Vietnam | Vinhomes | Real Estate | $17.1B |
| Israel | NICE | Technology | $16.9B |
| Kenya | Safaricom | Communication | $16.0B |
| Czech Republic | ÄŒEZ Group | Energy | $15.8B |
| New Zealand | Xero | Technology | $15.8B |
| Turkey | QNB Finansbank | Financials | $15.8B |
| Hungary | OTP Bank | Financials | $15.6B |
| Chile | Enel Americas | Utilities | $14.3B |
| Morocco | Maroc Telecom | Communication | $13.6B |
| Poland | PKO Bank Polski | Financials | $12.6B |
| Cyprus | Polymetal | Materials | $10.0B |
| Nigeria | Dangote Group | Materials | $10.0B |
| Bahrain | Ahli United Bank | Financials | $8.6B |
| Greece | OTE Group | Communication | $8.4B |
| Peru | Credicorp | Financials | $8.0B |
| Egypt | Commercial International Bank | Financials | $5.9B |
| Iceland | Marel | Industrials | $5.8B |
| Oman | Bank Muscat | Financials | $4.2B |
| Panama | Copa Holdings | Industrials | $3.1B |
Many are former monopolies or massive conglomerates that have grown in the public space, such as South Africa’s Naspers and India’s Reliance Industries.
Others are local subsidiaries of foreign corporations, including Mexico’s Walmex, Chile’s Enel and Turkey’s QNB Finansbank.
But even more noticeable is the economic discrepancy. Apple and Saudi Aramco are worth trillions of dollars, while the smallest companies we tracked—including Panama’s Copa Group and Oman’s Bank Muscat—are worth less than $5 billion.
Finance and Tech Dominate The Biggest Companies By Market Cap
Across the board, the largest companies were able to accumulate wealth and value.
Some are newer to the top thanks to recent success. Canada’s Shopify has become one of the world’s largest e-commerce providers, and the UK’s AstraZeneca developed one of the world’s COVID-19 vaccines.
But the reality is most companies here are old guards that grew on existing resources, or in the case of banks, accumulated wealth.
| Industry | Biggest Companies by Country |
|---|---|
| Financials | 16 |
| Technology | 12 |
| Energy | 6 |
| Materials | 5 |
| Communication | 4 |
| Consumer Cyclical | 4 |
| Utilities | 4 |
| Healthcare | 3 |
| Industrials | 3 |
| Consumer Staples | 2 |
| Real Estate | 1 |
Banks were the most commonly found at the top of each country’s stock market. Closely behind were oil and gas giants, mining companies, and former state-owned corporations that drove most of a country’s wealth generation.
But as more economies develop and catch up to Western economies (where tech is dominant), newer innovative companies will likely put up a fight for each country’s top company crown.


Economy
Economic Growth Forecasts for G7 and BRICS Countries in 2024
The IMF has released its economic growth forecasts for 2024. How do the G7 and BRICS countries compare?


G7 & BRICS Real GDP Growth Forecasts for 2024
The International Monetary Fund’s (IMF) has released its real gross domestic product (GDP) growth forecasts for 2024, and while global growth is projected to stay steady at 3.2%, various major nations are seeing declining forecasts.
This chart visualizes the 2024 real GDP growth forecasts using data from the IMF’s 2024 World Economic Outlook for G7 and BRICS member nations along with Saudi Arabia, which is still considering an invitation to join the bloc.
Get the Key Insights of the IMF’s World Economic Outlook
Want a visual breakdown of the insights from the IMF’s 2024 World Economic Outlook report?
This visual is part of a special dispatch of the key takeaways exclusively for VC+ members.
Get the full dispatch of charts by signing up to VC+.
Mixed Economic Growth Prospects for Major Nations in 2024
Economic growth projections by the IMF for major nations are mixed, with the majority of G7 and BRICS countries forecasted to have slower growth in 2024 compared to 2023.
Only three BRICS-invited or member countries, Saudi Arabia, the UAE, and South Africa, have higher projected real GDP growth rates in 2024 than last year.
| Group | Country | Real GDP Growth (2023) | Real GDP Growth (2024P) |
|---|---|---|---|
| G7 | 🇺🇸 U.S. | 2.5% | 2.7% |
| G7 | 🇨🇦 Canada | 1.1% | 1.2% |
| G7 | 🇯🇵 Japan | 1.9% | 0.9% |
| G7 | 🇫🇷 France | 0.9% | 0.7% |
| G7 | 🇮🇹 Italy | 0.9% | 0.7% |
| G7 | 🇬🇧 UK | 0.1% | 0.5% |
| G7 | 🇩🇪 Germany | -0.3% | 0.2% |
| BRICS | 🇮🇳 India | 7.8% | 6.8% |
| BRICS | 🇨🇳 China | 5.2% | 4.6% |
| BRICS | 🇦🇪 UAE | 3.4% | 3.5% |
| BRICS | 🇮🇷 Iran | 4.7% | 3.3% |
| BRICS | 🇷🇺 Russia | 3.6% | 3.2% |
| BRICS | 🇪🇬 Egypt | 3.8% | 3.0% |
| BRICS-invited | 🇸🇦 Saudi Arabia | -0.8% | 2.6% |
| BRICS | 🇧🇷 Brazil | 2.9% | 2.2% |
| BRICS | 🇿🇦 South Africa | 0.6% | 0.9% |
| BRICS | 🇪🇹 Ethiopia | 7.2% | 6.2% |
| 🌍 World | 3.2% | 3.2% |
China and India are forecasted to maintain relatively high growth rates in 2024 at 4.6% and 6.8% respectively, but compared to the previous year, China is growing 0.6 percentage points slower while India is an entire percentage point slower.
On the other hand, four G7 nations are set to grow faster than last year, which includes Germany making its comeback from its negative real GDP growth of -0.3% in 2023.
Faster Growth for BRICS than G7 Nations
Despite mostly lower growth forecasts in 2024 compared to 2023, BRICS nations still have a significantly higher average growth forecast at 3.6% compared to the G7 average of 1%.
While the G7 countries’ combined GDP is around $15 trillion greater than the BRICS nations, with continued higher growth rates and the potential to add more members, BRICS looks likely to overtake the G7 in economic size within two decades.
BRICS Expansion Stutters Before October 2024 Summit
BRICS’ recent expansion has stuttered slightly, as Argentina’s newly-elected president Javier Milei declined its invitation and Saudi Arabia clarified that the country is still considering its invitation and has not joined BRICS yet.
Even with these initial growing pains, South Africa’s Foreign Minister Naledi Pandor told reporters in February that 34 different countries have submitted applications to join the growing BRICS bloc.
Any changes to the group are likely to be announced leading up to or at the 2024 BRICS summit which takes place October 22-24 in Kazan, Russia.
Get the Full Analysis of the IMF’s Outlook on VC+
This visual is part of an exclusive special dispatch for VC+ members which breaks down the key takeaways from the IMF’s 2024 World Economic Outlook.
For the full set of charts and analysis, sign up for VC+.

-

 Education1 week ago
How Hard Is It to Get Into an Ivy League School?
-

 Technology2 weeks ago
Ranked: Semiconductor Companies by Industry Revenue Share
-

 Markets2 weeks ago
Ranked: The World’s Top Flight Routes, by Revenue
-

 Demographics2 weeks ago
Population Projections: The World’s 6 Largest Countries in 2075
-

 Markets2 weeks ago
The Top 10 States by Real GDP Growth in 2023
-

 Demographics2 weeks ago
The Smallest Gender Wage Gaps in OECD Countries
-

 Economy2 weeks ago
Where U.S. Inflation Hit the Hardest in March 2024
-

 Environment2 weeks ago
Top Countries By Forest Growth Since 2001