Technology
Ranked: The Most Innovative Companies in 2021


Ranked: the Top 50 Most Innovative Companies in 2021
This year has been rife with pandemic-induced changes that have shifted corporate priorities—and yet, innovation has remained a top concern among corporations worldwide.
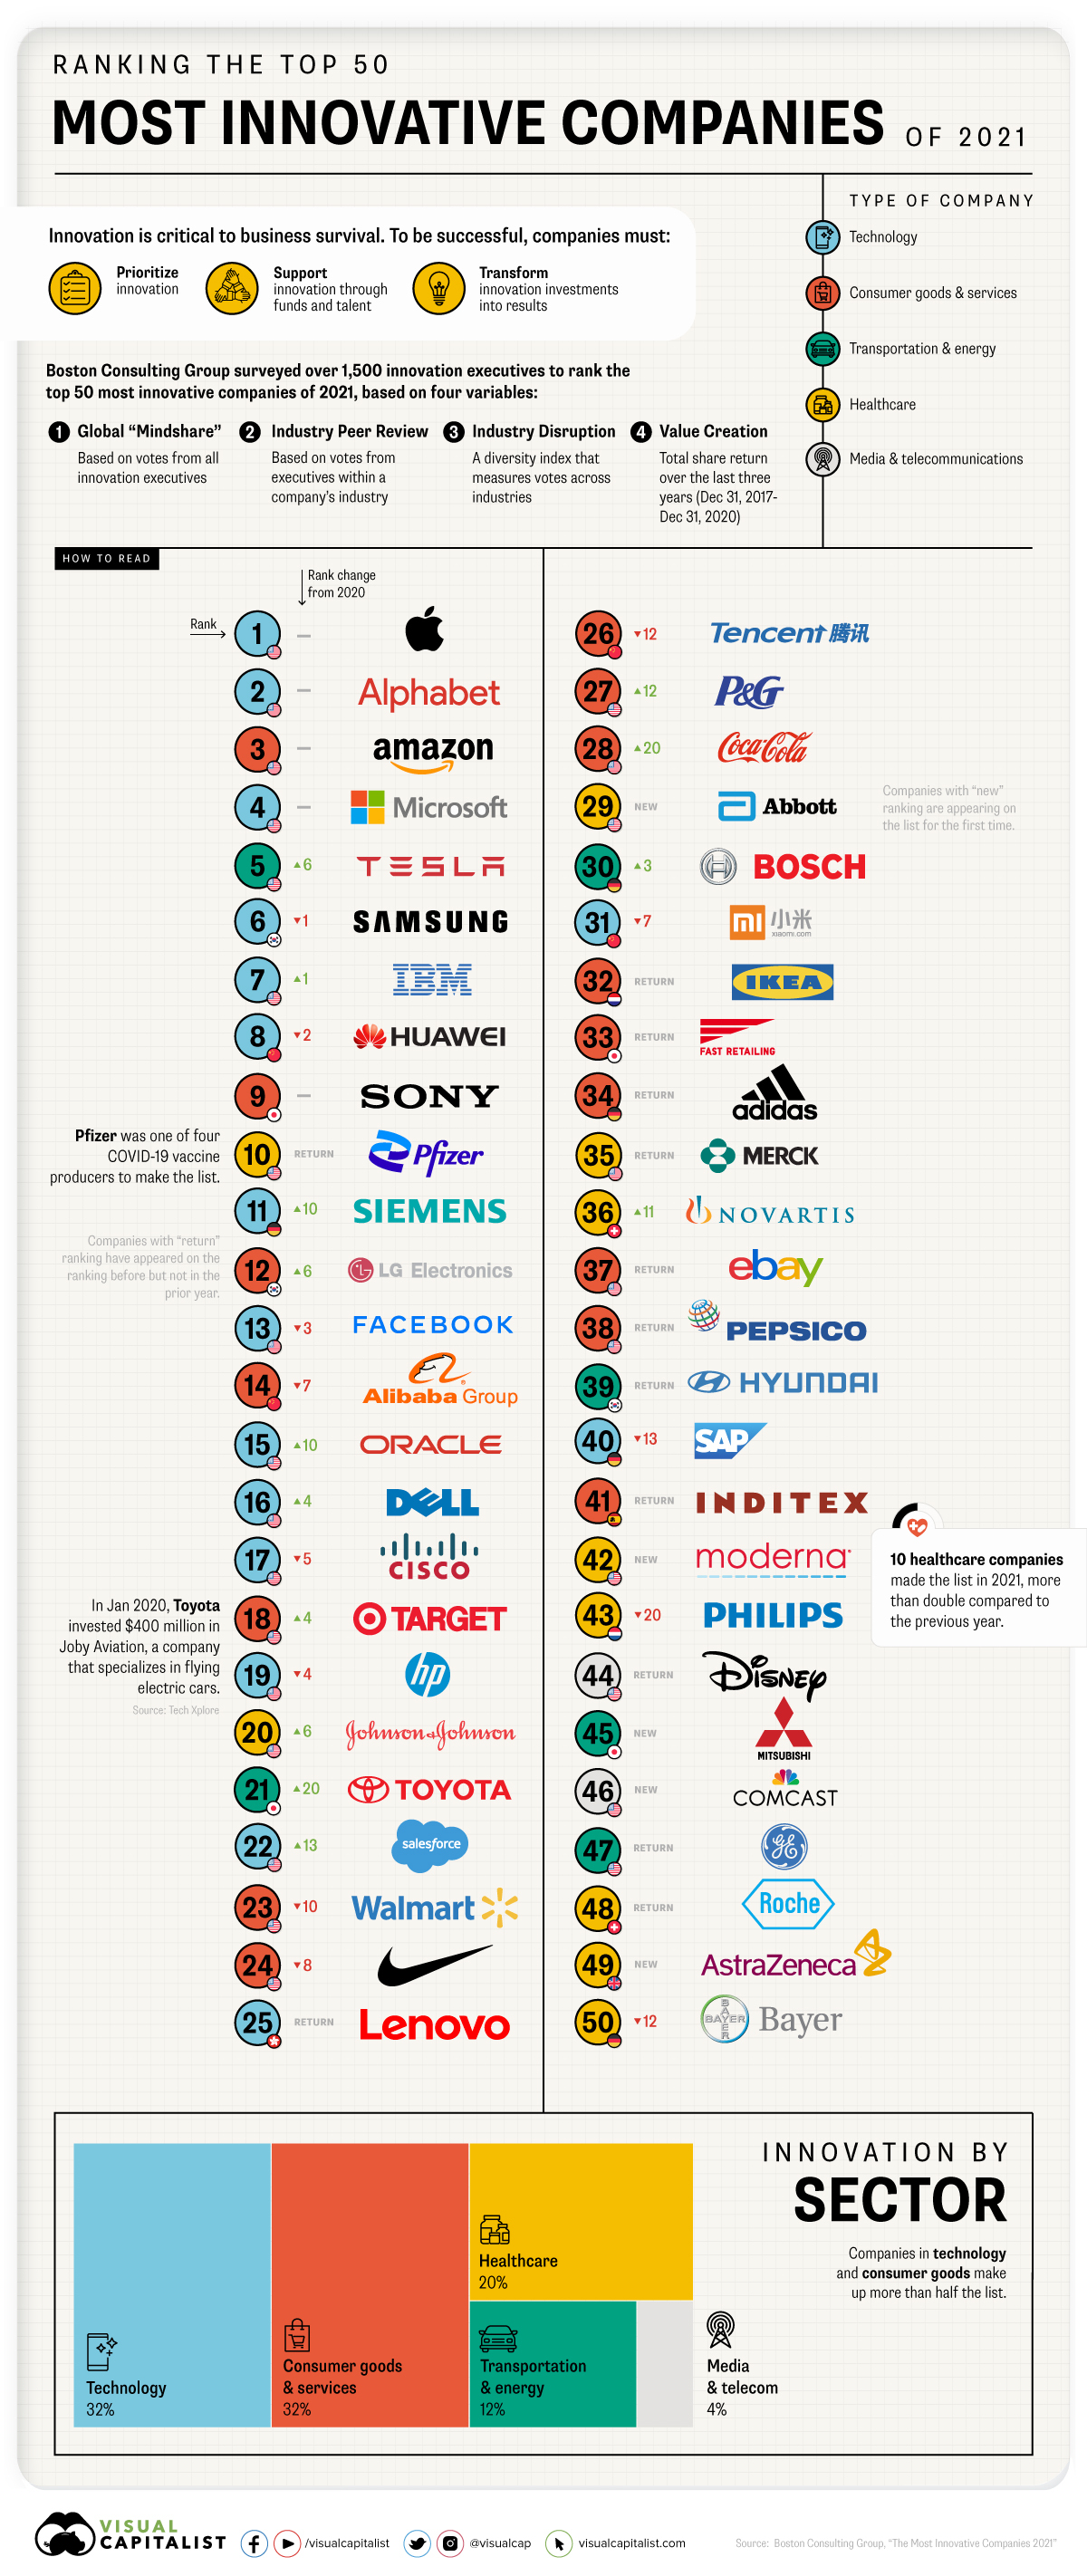
Using data from the annual ranking done by Boston Consulting Group (BCG) using a poll of 1,600 global innovation professionals, this graphic ranks the top 50 most innovative companies in 2021.
We’ll dig into a few of the leading companies, along with their innovative practices, below.
Most Innovative Companies: A Breakdown of the Leaderboard
To create the top 50 innovative company ranking, BCG uses four variables:
- Global “Mindshare”: The number of votes from all innovation executives.
- Industry Peer Review: The number of votes from executives in a company’s industry.
- Industry Disruption: A diversity index to measure votes across industries.
- Value Creation: Total share return.
For the second year in a row, Apple claims the top spot on this list. Here’s a look at the full ranking for 2021:
| Company | Industry | HQ | Change from 2020 | |
|---|---|---|---|---|
| 1 | Apple | Technology | 🇺🇸 U.S. | -- |
| 2 | Alphabet | Technology | 🇺🇸 U.S. | -- |
| 3 | Amazon | Consumer Goods | 🇺🇸 U.S. | -- |
| 4 | Microsoft | Technology | 🇺🇸 U.S. | -- |
| 5 | Tesla | Transport & Energy | 🇺🇸 U.S. | +6 |
| 6 | Samsung | Technology | 🇰🇷 South Korea | -1 |
| 7 | IBM | Technology | 🇺🇸 U.S. | +1 |
| 8 | Huawei | Technology | 🇨🇳 China | -2 |
| 9 | Sony | Consumer Goods | 🇯🇵 Japan | -- |
| 10 | Pfizer | Healthcare | 🇺🇸 U.S. | Return |
| 11 | Siemens | Technology | 🇩🇪 Germany | +10 |
| 12 | LG Electronics | Consumer Goods | 🇰🇷 South Korea | +6 |
| 13 | Technology | 🇺🇸 U.S. | -3 | |
| 14 | Alibaba | Consumer Goods | 🇨🇳 China | -7 |
| 15 | Oracle | Technology | 🇺🇸 U.S. | +10 |
| 16 | Dell | Technology | 🇺🇸 U.S. | +4 |
| 17 | Cisco Systems | Technology | 🇺🇸 U.S. | -5 |
| 18 | Target | Consumer Goods | 🇺🇸 U.S. | +4 |
| 19 | HP Inc. | Technology | 🇺🇸 U.S. | -4 |
| 20 | Johnson & Johnson | Healthcare | 🇺🇸 U.S. | +6 |
| 21 | Toyota | Transport & Energy | 🇯🇵 Japan | +20 |
| 22 | Salesforce | Technology | 🇺🇸 U.S. | +13 |
| 23 | Walmart | Consumer Goods | 🇺🇸 U.S. | -10 |
| 24 | Nike | Consumer Goods | 🇺🇸 U.S. | -8 |
| 25 | Lenovo | Technology | 🇭🇰 Hong Kong SAR | Return |
| 26 | Tencent | Consumer Goods | 🇨🇳 China | -12 |
| 27 | Procter & Gamble | Consumer Goods | 🇺🇸 U.S. | +12 |
| 28 | Coca-Cola | Consumer Goods | 🇺🇸 U.S. | +20 |
| 29 | Abbott Labs | Healthcare | 🇺🇸 U.S. | New |
| 30 | Bosch | Transport & Energy | 🇩🇪 Germany | +3 |
| 31 | Xiaomi | Technology | 🇨🇳 China | -7 |
| 32 | Ikea | Consumer Goods | 🇳🇱 Netherlands | Return |
| 33 | Fast Retailing | Consumer Goods | 🇯🇵 Japan | Return |
| 34 | Adidas | Consumer Goods | 🇩🇪 Germany | Return |
| 35 | Merck & Co. | Healthcare | 🇺🇸 U.S. | Return |
| 36 | Novartis | Healthcare | 🇨🇭 Switzerland | +11 |
| 37 | Ebay | Consumer Goods | 🇺🇸 U.S. | Return |
| 38 | PepsiCo | Consumer Goods | 🇺🇸 U.S. | Return |
| 39 | Hyundai | Transport & Energy | 🇰🇷 South Korea | Return |
| 40 | SAP | Technology | 🇩🇪 Germany | -13 |
| 41 | Inditex | Consumer Goods | 🇪🇸 Spain | Return |
| 42 | Moderna | Healthcare | 🇺🇸 U.S. | New |
| 43 | Philips | Healthcare | 🇳🇱 Netherlands | -20 |
| 44 | Disney | Media & Telecomms | 🇺🇸 U.S. | Return |
| 45 | Mitsubishi | Transport & Energy | 🇯🇵 Japan | New |
| 46 | Comcast | Media & Telecomms | 🇺🇸 U.S. | New |
| 47 | GE | Transport & Energy | 🇺🇸 U.S. | Return |
| 48 | Roche | Healthcare | 🇨🇭 Switzerland | Return |
| 49 | AstraZeneca | Healthcare | 🇬🇧 UK | New |
| 50 | Bayer | Healthcare | 🇩🇪 Germany | -12 |
One company worth touching on is Pfizer, a returnee from previous years that ranked 10th in this year’s ranking. It’s no surprise that Pfizer made the list, considering its instrumental role in the fight against COVID-19. In partnership with BioNTech, Pfizer produced a COVID-19 vaccine in less than a year. This is impressive considering that, historically, vaccine development could take up to a decade to complete.
Pfizer is just one of four COVID-19 vaccine producers to appear on the list this year—Moderna, Johnson & Johnson, and AstraZeneca also made the cut.
Meanwhile, in a completely different industry, Toyota snagged the 21st spot on this year’s list, up 20 places compared to the rankings in the previous year. This massive jump can be signified by the company’s recent $400 million investment into a company set to build flying electric cars.
While we often think of R&D and innovation as being synonymous, the former is just one innovation technique that’s helped companies earn a spot on the list. Other companies have innovated in different ways, like streamlining processes to increase efficiency.
For instance, in 2021, Coca-Cola performed an analysis of their beverage portfolio and ended up cutting their brand list in half, from 400 to 200 global brands. This ability to pare down and pivot could be a reason behind its 20 rank increase from 2020.
Innovation Creates Value
As this year’s ranking indicates, innovation comes in many forms. But, while there’s no one-size-fits-all approach, there is one fairly consistent innovation trend—the link between innovation and value.
In fact, according to historical data from BCG, the correlation between value and innovation has grown even stronger over the last two decades.
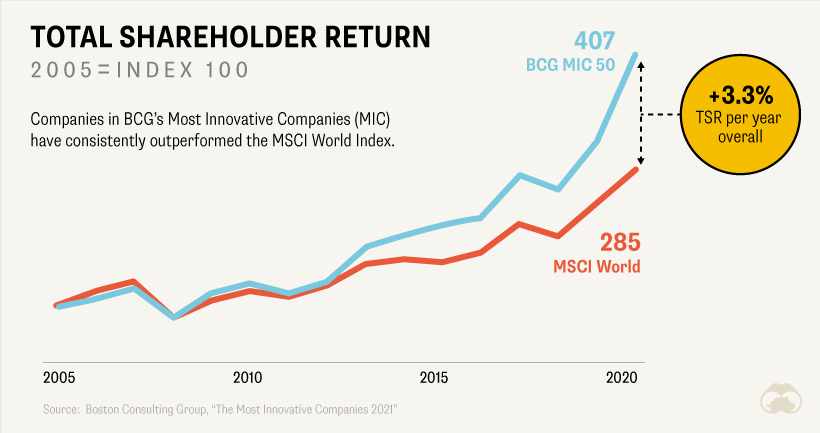
For example, in 2020, a portfolio that was theoretically invested in BCG’s most innovative companies would have performed 17% better than the MSCI World Index—which wasn’t the case back in 2005.
And yet, despite innovation’s value, many companies can’t reap the benefits that innovation offers because they aren’t ready to scale their innovative practices.
The Innovation Readiness Gap
BCG uses several metrics to gauge a company’s “innovation readiness,” such as the strength of its talent and culture, its organization ecosystems, and its ability to track performance.
According to BCG’s analysis, only 20% of companies surveyed were ready to scale on innovation.
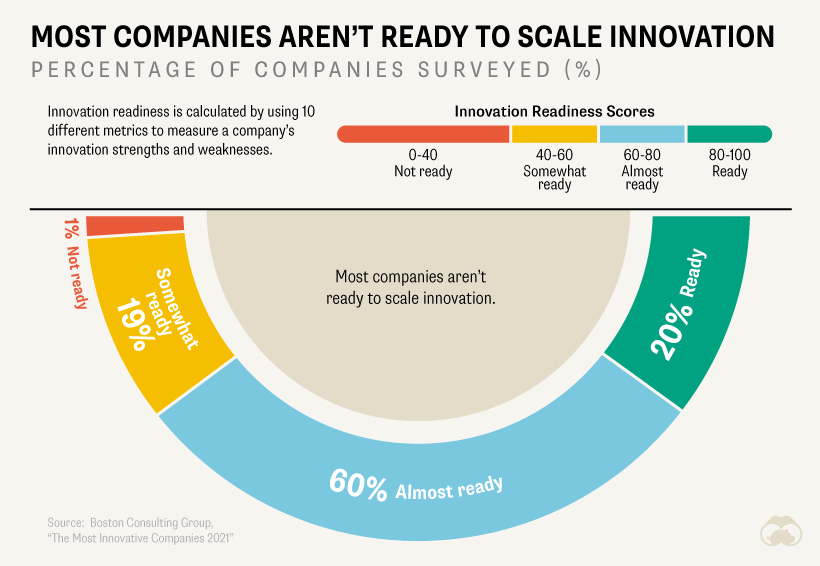
What’s holding companies back from reaching their innovation potential? The most significant gap seems to be in what BCG calls innovation practices—things like project management or the ability to execute an idea that’s both efficient and consistent with an overarching strategy.
To overcome this obstacle, BCG says companies need to foster a “one-team mentality” to increase interdepartmental collaboration and align team incentives, so everyone is working towards the same goal.


Technology
All of the Grants Given by the U.S. CHIPS Act
Intel, TSMC, and more have received billions in subsidies from the U.S. CHIPS Act in 2024.


All of the Grants Given by the U.S. CHIPS Act
This was originally posted on our Voronoi app. Download the app for free on iOS or Android and discover incredible data-driven charts from a variety of trusted sources.
This visualization shows which companies are receiving grants from the U.S. CHIPS Act, as of April 25, 2024. The CHIPS Act is a federal statute signed into law by President Joe Biden that authorizes $280 billion in new funding to boost domestic research and manufacturing of semiconductors.
The grant amounts visualized in this graphic are intended to accelerate the production of semiconductor fabrication plants (fabs) across the United States.
Data and Company Highlights
The figures we used to create this graphic were collected from a variety of public news sources. The Semiconductor Industry Association (SIA) also maintains a tracker for CHIPS Act recipients, though at the time of writing it does not have the latest details for Micron.
| Company | Federal Grant Amount | Anticipated Investment From Company |
|---|---|---|
| 🇺🇸 Intel | $8,500,000,000 | $100,000,000,000 |
| 🇹🇼 TSMC | $6,600,000,000 | $65,000,000,000 |
| 🇰🇷 Samsung | $6,400,000,000 | $45,000,000,000 |
| 🇺🇸 Micron | $6,100,000,000 | $50,000,000,000 |
| 🇺🇸 GlobalFoundries | $1,500,000,000 | $12,000,000,000 |
| 🇺🇸 Microchip | $162,000,000 | N/A |
| 🇬🇧 BAE Systems | $35,000,000 | N/A |
BAE Systems was not included in the graphic due to size limitations
Intel’s Massive Plans
Intel is receiving the largest share of the pie, with $8.5 billion in grants (plus an additional $11 billion in government loans). This grant accounts for 22% of the CHIPS Act’s total subsidies for chip production.
From Intel’s side, the company is expected to invest $100 billion to construct new fabs in Arizona and Ohio, while modernizing and/or expanding existing fabs in Oregon and New Mexico. Intel could also claim another $25 billion in credits through the U.S. Treasury Department’s Investment Tax Credit.
TSMC Expands its U.S. Presence
TSMC, the world’s largest semiconductor foundry company, is receiving a hefty $6.6 billion to construct a new chip plant with three fabs in Arizona. The Taiwanese chipmaker is expected to invest $65 billion into the project.
The plant’s first fab will be up and running in the first half of 2025, leveraging 4 nm (nanometer) technology. According to TrendForce, the other fabs will produce chips on more advanced 3 nm and 2 nm processes.
The Latest Grant Goes to Micron
Micron, the only U.S.-based manufacturer of memory chips, is set to receive $6.1 billion in grants to support its plans of investing $50 billion through 2030. This investment will be used to construct new fabs in Idaho and New York.

-

 Education1 week ago
How Hard Is It to Get Into an Ivy League School?
-

 Technology2 weeks ago
Ranked: Semiconductor Companies by Industry Revenue Share
-

 Markets2 weeks ago
Ranked: The World’s Top Flight Routes, by Revenue
-

 Demographics2 weeks ago
Population Projections: The World’s 6 Largest Countries in 2075
-

 Markets2 weeks ago
The Top 10 States by Real GDP Growth in 2023
-

 Demographics2 weeks ago
The Smallest Gender Wage Gaps in OECD Countries
-

 Economy2 weeks ago
Where U.S. Inflation Hit the Hardest in March 2024
-

 Green2 weeks ago
Top Countries By Forest Growth Since 2001