Markets
Mapped: GDP per Capita Worldwide
View the full-resolution version of this infographic


Mapped: Visualizing GDP per Capita Worldwide
View the high-resolution of the infographic by clicking here.
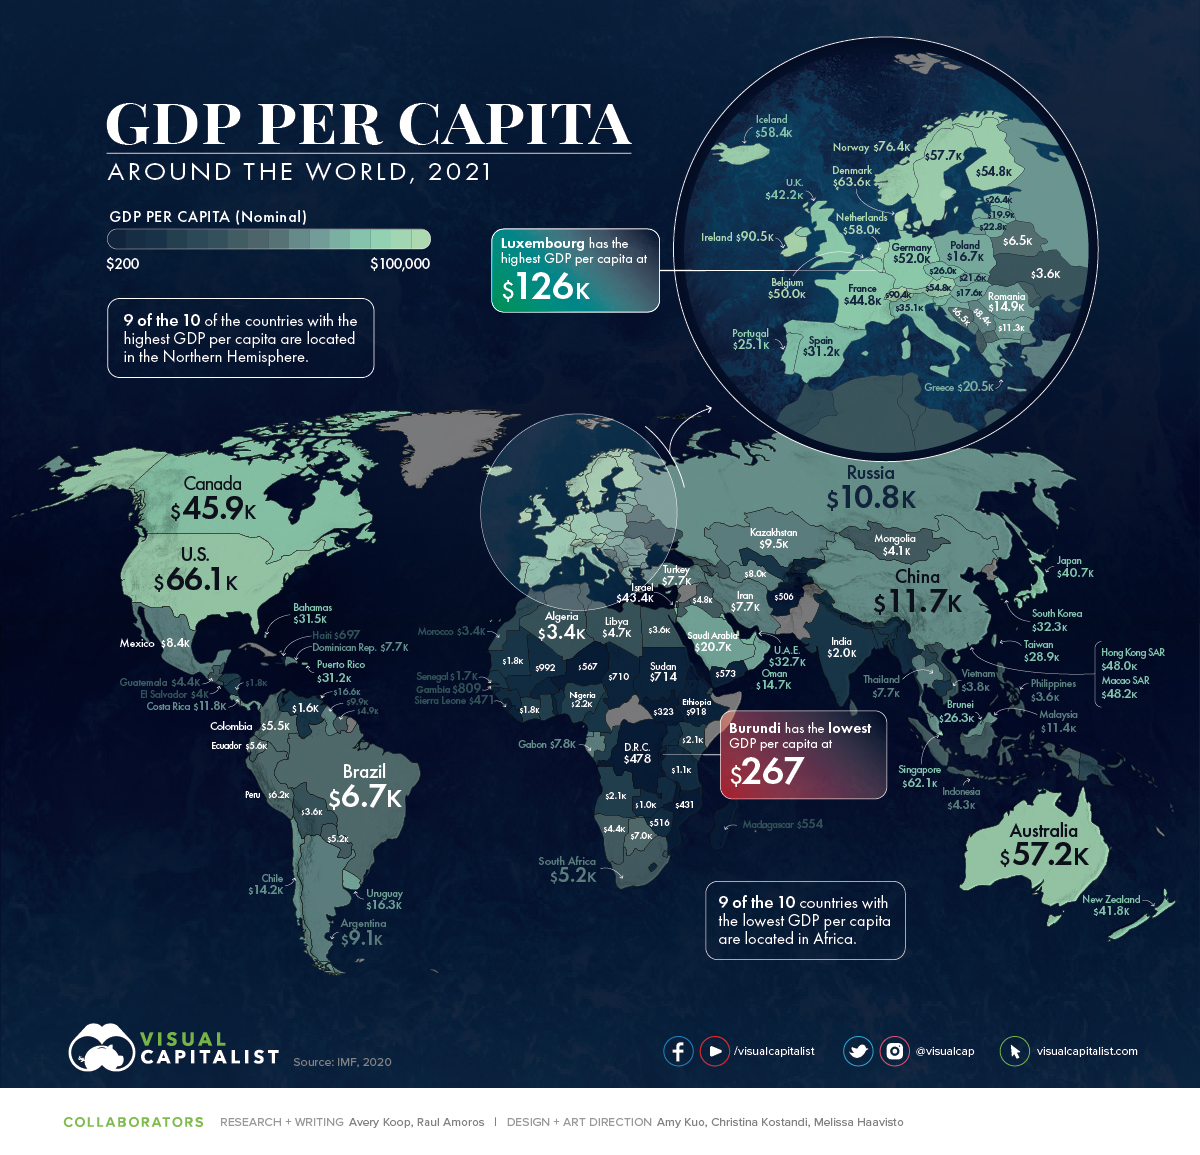
GDP per capita has steadily risen globally over time, and in tandem, the standard of living worldwide has increased immensely.
This map using data from the IMF shows the GDP per capita (nominal) of nearly every country and territory in the world.
GDP per capita is one of the best measures of a country’s wealth as it provides an understanding of how each country’s citizens live on average, showing a representation of the quantity of goods and services created per person.
The Standard of Living Over Time
Looking at history, our standard of living has increased drastically. According to Our World in Data, from 1820 to 2018, the average global GDP per capita increased by almost 15x.
Literacy rates, access to vaccines, and basic education have also improved our quality of life, while things like child mortality rates and poverty have all decreased.
For example, in 1990, 1.9 billion people lived in extreme poverty, which was 36% of the world’s population at the time. Over the last 30 years, the number has been steadily decreasing — by 2030, an estimated 479 million people will be living in extreme poverty, which according to UN population estimates, will represent only 6% of the population.
That said, economic inequality between different regions is still prevalent. In fact, the richest country today (in terms of nominal GDP per capita), Luxembourg, is over 471x more wealthy than the poorest, Burundi.
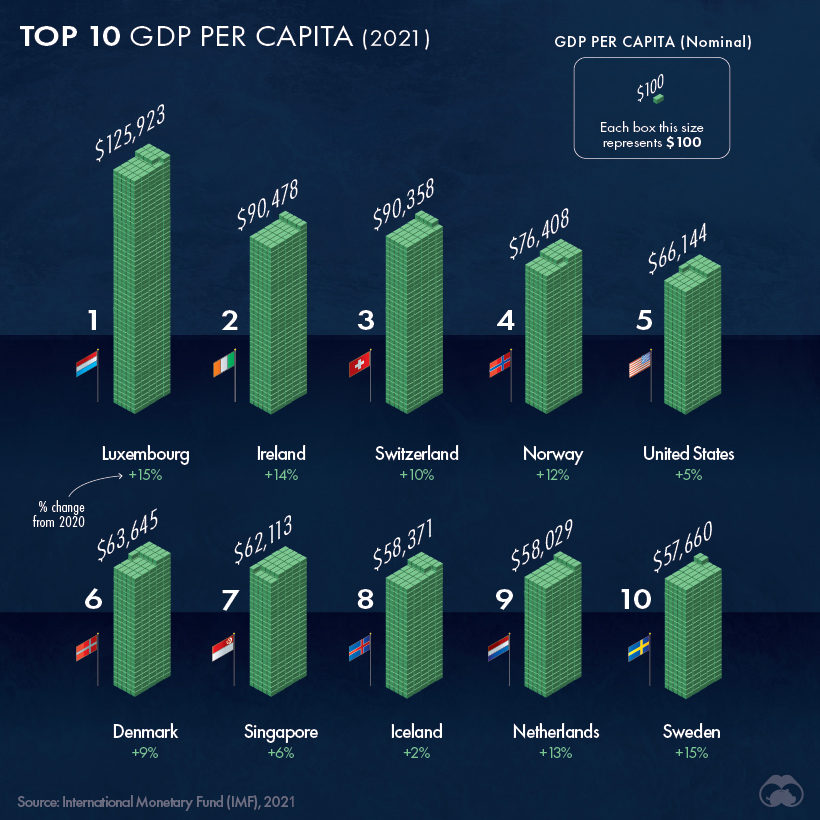
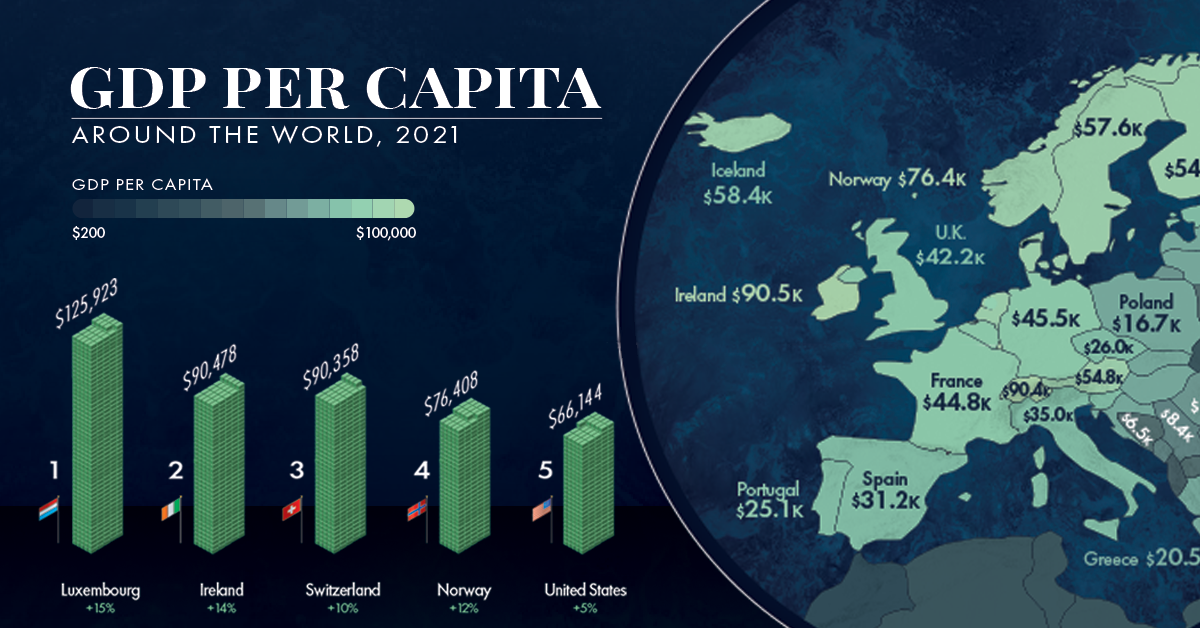
Here’s a look at the 10 countries with the highest GDP per capita in 2021:
However, not all citizens in Luxembourg are extremely wealthy. In fact:
- 29% of people spend over 40% of their income on housing costs
- 31% would be at risk of falling into poverty if they had to forgo 3 months of income
The cost of living is expensive in Luxembourg — but the standard of living in terms of goods and services produced is the highest in the world. Additionally, only 4% of the population reports low life satisfaction.
Emerging Economies and Developing Countries
Although we have never lived in a more prosperous period, and poverty rates have been declining overall, this year global extreme poverty rose for the first time in over two decades.
About 120 million additional people are living in poverty as a result of the pandemic, with the total expected to rise to about 150 million by the end of 2021.
Many of the poorest countries in the world are also considered Least Developed Countries (LDCs) by the UN. In these countries, more than 75% of the population live below the poverty line.
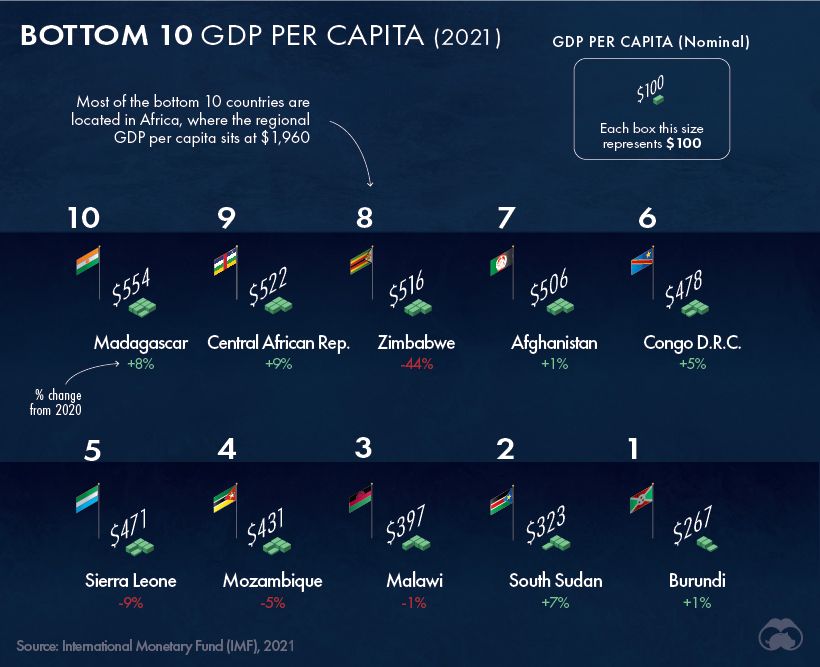
Here’s a look at the 10 countries with the lowest GDP per capita:
Life in these countries offers a stark contrast compared to the top 10. Here’s a glance at the quality of life in the poorest country, Burundi:
- 80% of the population works in agriculture
- 1 in 3 Burundians are in need of urgent humanitarian assistance
- Average households spend up to two-thirds of their income on food
However, many of the world’s poorest countries can also be classified as emerging markets with immense economic potential in the future.
In fact, China has seen the opportunity in emerging economies. Their confidence in these regions is best exemplified in the Belt and Road initiative which has funneled massive investments into infrastructure projects across multiple African countries.
Continually Raising the Bar
Prosperity is a very recent reality only characterizing the last couple hundred years. In pre-modern societies, the average person was living in conditions that would be considered extreme poverty by today’s standards.
Overall, the standard of living for everyone today is immensely improved compared to even recent history, and some countries will be experiencing rapid economic growth in the future.
GDP per Capita in 2021: Full Dataset
| Country | GDP per Capita (Nominal, 2021, USD) |
|---|---|
| 🇱🇺 Luxembourg | $125,923 |
| 🇮🇪 Ireland | $90,478 |
| 🇨🇭 Switzerland | $90,358 |
| 🇳🇴 Norway | $76,408 |
| 🇺🇸 United States | $66,144 |
| 🇩🇰 Denmark | $63,645 |
| 🇸🇬 Singapore | $62,113 |
| 🇮🇸 Iceland | $58,371 |
| 🇳🇱 Netherlands | $58,029 |
| 🇸🇪 Sweden | $57,660 |
| Australia | $57,211 |
| Qatar | $55,417 |
| Austria | $54,820 |
| Finland | $54,817 |
| Germany | $51,967 |
| Belgium | $50,051 |
| Macao SAR | $48,207 |
| Hong Kong SAR | $47,990 |
| Canada | $45,871 |
| France | $44,770 |
| San Marino | $44,676 |
| Israel | $43,439 |
| United Kingdom | $42,236 |
| New Zealand | $41,793 |
| Japan | $40,733 |
| Italy | $35,062 |
| United Arab Emirates | $32,686 |
| South Korea | $32,305 |
| Malta | $32,099 |
| The Bahamas | $31,532 |
| Puerto Rico | $31,207 |
| Spain | $31,178 |
| Europe | $31,022 |
| Cyprus | $29,686 |
| Taiwan | $28,890 |
| Slovenia | $28,734 |
| Estonia | $26,378 |
| Brunei | $26,274 |
| Czech Republic | $25,991 |
| Portugal | $25,097 |
| Bahrain | $23,710 |
| Kuwait | $23,138 |
| Lithuania | $22,752 |
| Aruba | $22,710 |
| Slovakia | $21,606 |
| Saudi Arabia | $20,742 |
| Greece | $20,521 |
| Latvia | $19,934 |
| Hungary | $17,645 |
| Barbados | $17,472 |
| Poland | $16,740 |
| Trinidad and Tobago | $16,622 |
| Saint Kitts and Nevis | $16,491 |
| Croatia | $16,402 |
| Uruguay | $16,297 |
| Romania | $14,916 |
| Antigua and Barbuda | $14,748 |
| Oman | $14,675 |
| Panama | $14,390 |
| Chile | $14,209 |
| Maldives | $14,194 |
| Palau | $13,180 |
| Seychelles | $12,648 |
| Costa Rica | $11,805 |
| China | $11,713 |
| Malaysia | $11,378 |
| Bulgaria | $11,349 |
| Russia | $10,793 |
| Saint Lucia | $10,636 |
| Grenada | $10,211 |
| Guyana | $9,913 |
| Nauru | $9,865 |
| Mauritius | $9,630 |
| Kazakhstan | $9,454 |
| Montenegro | $9,152 |
| Argentina | $9,095 |
| Turkmenistan | $8,874 |
| Serbia | $8,444 |
| Mexico | $8,403 |
| Dominica | $8,111 |
| Equatorial Guinea | $8,000 |
| Gabon | $7,785 |
| Dominican Republic | $7,740 |
| Thailand | $7,675 |
| Iran | $7,668 |
| Turkey | $7,659 |
| Saint Vincent and the Grenadines | $7,401 |
| Botswana | $7,036 |
| North Macedonia | $6,933 |
| Brazil | $6,728 |
| Bosnia and Herzegovina | $6,536 |
| Belarus | $6,513 |
| Peru | $6,229 |
| Jamaica | $5,643 |
| Ecuador | $5,589 |
| Colombia | $5,457 |
| South Africa | $5,236 |
| Paraguay | $5,207 |
| Albania | $5,161 |
| Tonga | $4,949 |
| Suriname | $4,921 |
| Fiji | $4,822 |
| Iraq | $4,767 |
| Kosovo | $4,753 |
| Libya | $4,733 |
| Georgia | $4,714 |
| Moldova | $4,527 |
| Armenia | $4,427 |
| Namibia | $4,412 |
| Azerbaijan | $4,404 |
| Guatemala | $4,385 |
| Jordan | $4,347 |
| Tuvalu | $4,296 |
| Indonesia | $4,287 |
| Mongolia | $4,139 |
| Marshall Islands | $4,092 |
| Samoa | $4,053 |
| El Salvador | $4,023 |
| Micronesia | $3,995 |
| Belize | $3,968 |
| Sri Lanka | $3,928 |
| Vietnam | $3,759 |
| Eswatini | $3,697 |
| Cabo Verde | $3,675 |
| Bolivia | $3,618 |
| Ukraine | $3,615 |
| Egypt | $3,606 |
| Philippines | $3,602 |
| North Africa | $3,560 |
| Algeria | $3,449 |
| Bhutan | $3,447 |
| Morocco | $3,409 |
| Tunisia | $3,380 |
| Djibouti | $3,275 |
| West Bank and Gaza | $3,060 |
| Vanuatu | $2,967 |
| Laos | $2,614 |
| Papua New Guinea | $2,596 |
| Honduras | $2,593 |
| Côte d'Ivoire | $2,571 |
| Solomon Islands | $2,501 |
| Ghana | $2,300 |
| Republic of Congo | $2,271 |
| Nigeria | $2,209 |
| São Tomé and Príncipe | $2,133 |
| Angola | $2,130 |
| Kenya | $2,122 |
| India | $2,031 |
| Bangladesh | $1,990 |
| Uzbekistan | $1,836 |
| Nicaragua | $1,828 |
| Kiribati | $1,817 |
| Mauritania | $1,782 |
| Cambodia | $1,680 |
| Cameroon | $1,657 |
| Senegal | $1,629 |
| Venezuela | $1,586 |
| Myanmar | $1,441 |
| Comoros | $1,431 |
| Benin | $1,400 |
| Timor-Leste | $1,273 |
| Kyrgyzstan | $1,270 |
| Nepal | $1,166 |
| Tanzania | $1,132 |
| Guinea | $1,067 |
| Lesotho | $1,018 |
| Zambia | $1,006 |
| Mali | $992 |
| Uganda | $971 |
| Ethiopia | $918 |
| Tajikistan | $851 |
| Burkina Faso | $851 |
| Guinea-Bissau | $844 |
| Rwanda | $820 |
| The Gambia | $809 |
| Togo | $759 |
| Sudan | $714 |
| Chad | $710 |
| Haiti | $698 |
| Liberia | $646 |
| Eritrea | $632 |
| Yemen | $573 |
| Niger | $567 |
| Madagascar | $554 |
| Central African Republic | $522 |
| Zimbabwe | $516 |
| Afghanistan | $506 |
| Democratic Republic of the Congo | $478 |
| Sierra Leone | $471 |
| Mozambique | $431 |
| Malawi | $397 |
| South Sudan | $323 |
| Burundi | $267 |
Editor’s note: Readers have rightly pointed out that Monaco is one of the world’s richest countries in GDP per capita (nominal) terms. This is true, but the IMF dataset excludes Monaco and lists it as “No data” each year. As a result, it is excluded from the visualization(s) above.


Markets
The European Stock Market: Attractive Valuations Offer Opportunities
On average, the European stock market has valuations that are nearly 50% lower than U.S. valuations. But how can you access the market?


European Stock Market: Attractive Valuations Offer Opportunities
Europe is known for some established brands, from L’Oréal to Louis Vuitton. However, the European stock market offers additional opportunities that may be lesser known.
The above infographic, sponsored by STOXX, outlines why investors may want to consider European stocks.
Attractive Valuations
Compared to most North American and Asian markets, European stocks offer lower or comparable valuations.
| Index | Price-to-Earnings Ratio | Price-to-Book Ratio |
|---|---|---|
| EURO STOXX 50 | 14.9 | 2.2 |
| STOXX Europe 600 | 14.4 | 2 |
| U.S. | 25.9 | 4.7 |
| Canada | 16.1 | 1.8 |
| Japan | 15.4 | 1.6 |
| Asia Pacific ex. China | 17.1 | 1.8 |
Data as of February 29, 2024. See graphic for full index names. Ratios based on trailing 12 month financials. The price to earnings ratio excludes companies with negative earnings.
On average, European valuations are nearly 50% lower than U.S. valuations, potentially offering an affordable entry point for investors.
Research also shows that lower price ratios have historically led to higher long-term returns.
Market Movements Not Closely Connected
Over the last decade, the European stock market had low-to-moderate correlation with North American and Asian equities.
The below chart shows correlations from February 2014 to February 2024. A value closer to zero indicates low correlation, while a value of one would indicate that two regions are moving in perfect unison.
| EURO STOXX 50 | STOXX EUROPE 600 | U.S. | Canada | Japan | Asia Pacific ex. China |
|
|---|---|---|---|---|---|---|
| EURO STOXX 50 | 1.00 | 0.97 | 0.55 | 0.67 | 0.24 | 0.43 |
| STOXX EUROPE 600 | 1.00 | 0.56 | 0.71 | 0.28 | 0.48 | |
| U.S. | 1.00 | 0.73 | 0.12 | 0.25 | ||
| Canada | 1.00 | 0.22 | 0.40 | |||
| Japan | 1.00 | 0.88 | ||||
| Asia Pacific ex. China | 1.00 |
Data is based on daily USD returns.
European equities had relatively independent market movements from North American and Asian markets. One contributing factor could be the differing sector weights in each market. For instance, technology makes up a quarter of the U.S. market, but health care and industrials dominate the broader European market.
Ultimately, European equities can enhance portfolio diversification and have the potential to mitigate risk for investors.
Tracking the Market
For investors interested in European equities, STOXX offers a variety of flagship indices:
| Index | Description | Market Cap |
|---|---|---|
| STOXX Europe 600 | Pan-regional, broad market | €10.5T |
| STOXX Developed Europe | Pan-regional, broad-market | €9.9T |
| STOXX Europe 600 ESG-X | Pan-regional, broad market, sustainability focus | €9.7T |
| STOXX Europe 50 | Pan-regional, blue-chip | €5.1T |
| EURO STOXX 50 | Eurozone, blue-chip | €3.5T |
Data is as of February 29, 2024. Market cap is free float, which represents the shares that are readily available for public trading on stock exchanges.
The EURO STOXX 50 tracks the Eurozone’s biggest and most traded companies. It also underlies one of the world’s largest ranges of ETFs and mutual funds. As of November 2023, there were €27.3 billion in ETFs and €23.5B in mutual fund assets under management tracking the index.
“For the past 25 years, the EURO STOXX 50 has served as an accurate, reliable and tradable representation of the Eurozone equity market.”
— Axel Lomholt, General Manager at STOXX
Partnering with STOXX to Track the European Stock Market
Are you interested in European equities? STOXX can be a valuable partner:
- Comprehensive, liquid and investable ecosystem
- European heritage, global reach
- Highly sophisticated customization capabilities
- Open architecture approach to using data
- Close partnerships with clients
- Part of ISS STOXX and Deutsche Börse Group
With a full suite of indices, STOXX can help you benchmark against the European stock market.
Learn how STOXX’s European indices offer liquid and effective market access.

-

 Economy2 days ago
Economic Growth Forecasts for G7 and BRICS Countries in 2024
The IMF has released its economic growth forecasts for 2024. How do the G7 and BRICS countries compare?
-

 Markets1 week ago
U.S. Debt Interest Payments Reach $1 Trillion
U.S. debt interest payments have surged past the $1 trillion dollar mark, amid high interest rates and an ever-expanding debt burden.
-

 United States2 weeks ago
Ranked: The Largest U.S. Corporations by Number of Employees
We visualized the top U.S. companies by employees, revealing the massive scale of retailers like Walmart, Target, and Home Depot.
-

 Markets2 weeks ago
The Top 10 States by Real GDP Growth in 2023
This graphic shows the states with the highest real GDP growth rate in 2023, largely propelled by the oil and gas boom.
-

 Markets2 weeks ago
Ranked: The World’s Top Flight Routes, by Revenue
In this graphic, we show the highest earning flight routes globally as air travel continued to rebound in 2023.
-

 Markets2 weeks ago
Ranked: The Most Valuable Housing Markets in America
The U.S. residential real estate market is worth a staggering $47.5 trillion. Here are the most valuable housing markets in the country.


-

 Education1 week ago
How Hard Is It to Get Into an Ivy League School?
-

 Technology2 weeks ago
Ranked: Semiconductor Companies by Industry Revenue Share
-
Markets2 weeks ago
Ranked: The World’s Top Flight Routes, by Revenue
-

 Demographics2 weeks ago
Population Projections: The World’s 6 Largest Countries in 2075
-
Markets2 weeks ago
The Top 10 States by Real GDP Growth in 2023
-

 Demographics2 weeks ago
The Smallest Gender Wage Gaps in OECD Countries
-

 Economy2 weeks ago
Where U.S. Inflation Hit the Hardest in March 2024
-

 Environment2 weeks ago
Top Countries By Forest Growth Since 2001