Datastream
More U.S. Tech Companies are Adopting Unequal Dual-Class Voting Structures


The Briefing
- Dual-class structures give executives greater voting rights over public shareholders
- U.S. tech companies have increasingly adopted this structure since the mid 2010s
More U.S. Tech Companies are Adopting Unequal Voting Structures
Shareholders of public companies often receive the right to vote on corporate policies like issuing dividends or initiating mergers.
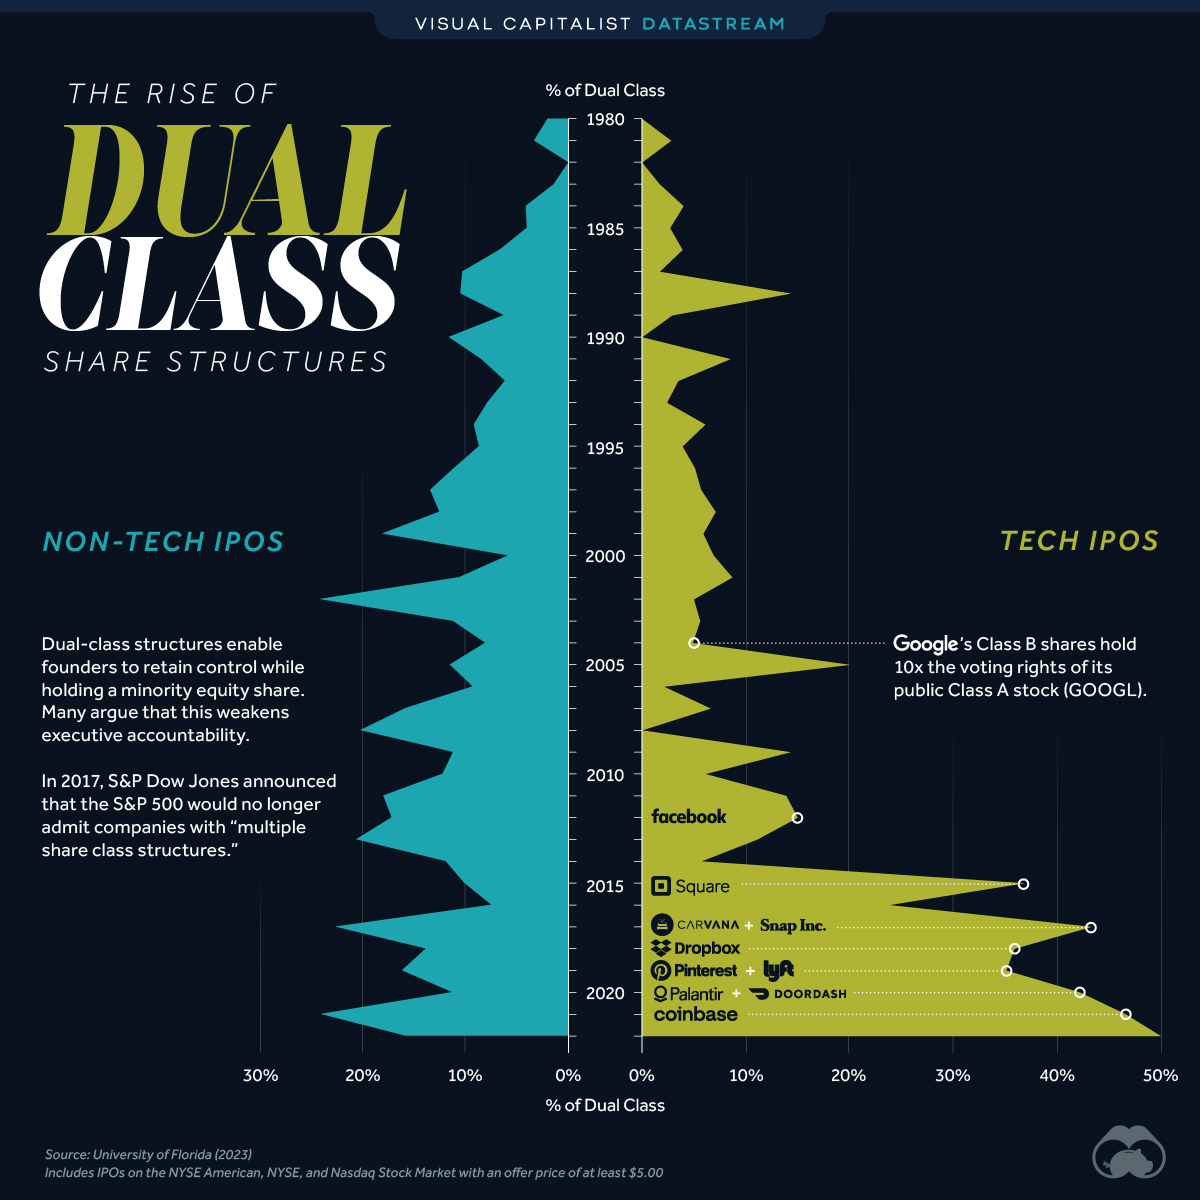
Some companies opt for a dual-class share structure, where one class is offered to the public, and another is reserved for founders and executives. Many argue that this weakens accountability, as executives can simply overrule the wishes of outside investors.
The following table lists the number of U.S. companies that have IPO’d with a dual-class share structure. This data was compiled by Jay R. Ritter, Cordell Professor of Finance at the University of Florida.
| Year | Non-tech IPOs | % of Dual Class (non-tech) | Tech IPOs | % of Dual Class (tech) |
|---|---|---|---|---|
| 1980 | 49 | 2% | 22 | 0% |
| 1981 | 120 | 3% | 72 | 3% |
| 1982 | 35 | 0% | 42 | 0% |
| 1983 | 278 | 1% | 173 | 2% |
| 1984 | 121 | 4% | 50 | 4% |
| 1985 | 149 | 4% | 37 | 3% |
| 1986 | 316 | 7% | 77 | 4% |
| 1987 | 226 | 10% | 59 | 2% |
| 1988 | 77 | 10% | 28 | 14% |
| 1989 | 81 | 6% | 35 | 3% |
| 1990 | 78 | 12% | 32 | 0% |
| 1991 | 215 | 8% | 71 | 9% |
| 1992 | 297 | 6% | 115 | 4% |
| 1993 | 383 | 8% | 127 | 2% |
| 1994 | 287 | 9% | 115 | 6% |
| 1995 | 257 | 9% | 205 | 4% |
| 1996 | 401 | 11% | 276 | 5% |
| 1997 | 300 | 13% | 174 | 6% |
| 1998 | 170 | 12% | 113 | 7% |
| 1999 | 106 | 18% | 370 | 6% |
| 2000 | 120 | 6% | 260 | 7% |
| 2001 | 57 | 11% | 23 | 9% |
| 2002 | 46 | 24% | 20 | 5% |
| 2003 | 45 | 11% | 18 | 6% |
| 2004 | 112 | 8% | 61 | 5% |
| 2005 | 115 | 11% | 45 | 20% |
| 2006 | 109 | 9% | 48 | 2% |
| 2007 | 83 | 16% | 76 | 7% |
| 2008 | 15 | 20% | 6 | 0% |
| 2009 | 27 | 11% | 14 | 14% |
| 2010 | 58 | 12% | 33 | 6% |
| 2011 | 45 | 18% | 36 | 14% |
| 2012 | 53 | 17% | 40 | 15% |
| 2013 | 113 | 20% | 45 | 11% |
| 2014 | 153 | 12% | 53 | 6% |
| 2015 | 80 | 10% | 38 | 37% |
| 2016 | 54 | 7% | 21 | 24% |
| 2017 | 76 | 22% | 30 | 43% |
| 2018 | 95 | 14% | 39 | 36% |
| 2019 | 75 | 16% | 37 | 35% |
| 2020 | 120 | 11% | 45 | 42% |
| 2021 | 193 | 24% | 118 | 47% |
| 2022 | 32 | 16% | 6 | 50% |
Includes IPOs on the NYSE American, NYSE, and Nasdaq Stock Market with an offer price of at least $5.00.
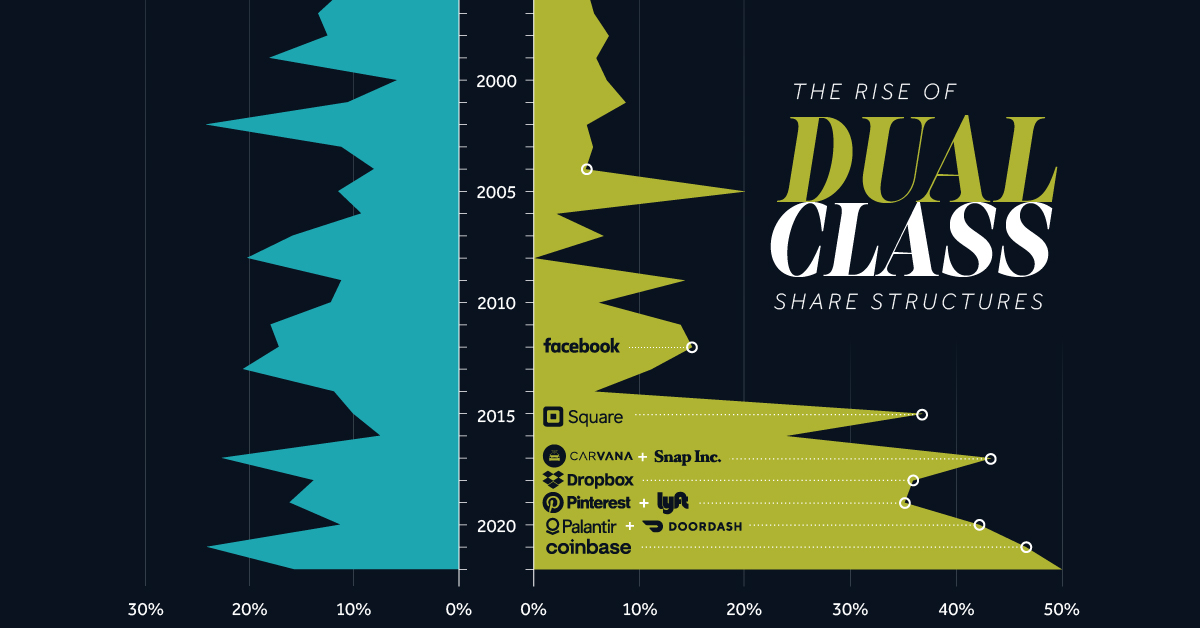
The biggest takeaway from this dataset is that dual-class structures have become much more prevalent among U.S. tech firms. Starting in the mid 2010s, this trend includes noteworthy IPOs such as Facebook (2012), Square (2015), Pinterest (2019), and Coinbase (2021).
In the case of Coinbase, a separate class of shares reserved for founders and insiders has 20 times the voting power of regular, publicly available shares. According to Fast Company, this gives insiders 53.5% of the overall votes.
How do Dual-Class Share Structures Impact Performance?
Ritter’s report also analyzed the three-year returns on 9,089 IPOs from 1980 to 2021. Once again, this only includes IPOs on the NYSE American, NYSE, and Nasdaq Stock Market with an offer price of at least $5.00.
Returns were calculated through the end of December 2021.
| Category | Share structure | # of IPOs | 3-Yr Buy-and-hold Return | Market-adjusted Return |
|---|---|---|---|---|
| Tech | Dual-class | 295 | 41.0% | 20.0% |
| Tech | Single | 3,009 | 19.6% | -14.6% |
| Non-tech | Dual-class | 584 | 24.1% | -12.7% |
| Non-tech | Single | 5,201 | 17.9% | -23.9% |
In both categories (tech or non-tech), IPOs with dual-class voting structures outperformed over the three year period. This outperformance was significantly higher for tech companies.
Where does this data come from?
Source: University of Florida (2023)
Data note: Buy-and-hold returns are calculated from the first close until the earlier of the three-year anniversary or the delisting date (the end December of 2022 for IPOs from 2020 and 2021). Market-adjusted returns are the difference between the asset’s return and the index’s return. The index in this case is the CRSP value-weighted index, which includes NYSE American, NYSE, and Nasdaq stocks.


Datastream
Can You Calculate Your Daily Carbon Footprint?
Discover how the average person’s carbon footprint impacts the environment and learn how carbon credits can offset your carbon footprint.


The Briefing
- A person’s carbon footprint is substantial, with activities such as food consumption creating as much as 4,500 g of CO₂ emissions daily.
- By purchasing carbon credits from Carbon Streaming Corporation, you can offset your own emissions and fund positive climate action.
Your Everyday Carbon Footprint
While many large businesses and countries have committed to net-zero goals, it is essential to acknowledge that your everyday activities also contribute to global emissions.
In this graphic, sponsored by Carbon Streaming Corporation, we will explore how the choices we make and the products we use have a profound impact on our carbon footprint.
Carbon Emissions by Activity
Here are some of the daily activities and products of the average person and their carbon footprint, according to Clever Carbon.
| Household Activities & Products | CO2 Emissions (g) |
|---|---|
| 💡 Standard Light Bulb (100 watts, four hours) | 172 g |
| 📱 Mobile Phone Use (195 minutes per day)* | 189 g |
| 👕 Washing Machine (0.63 kWh) | 275 g |
| 🔥 Electric Oven (1.56 kWh) | 675 g |
| ♨️ Tumble Dryer (2.5 kWh) | 1,000 g |
| 🧻 Toilet Roll (2 ply) | 1,300 g |
| 🚿 Hot Shower (10 mins) | 2,000 g |
| 🚙 Daily Commute (one hour, by car) | 3,360 g |
| 🍽️ Average Daily Food Consumption (three meals of 600 calories) | 4,500 g |
| *Phone use based on yearly use of 69kg per the source, Reboxed | |
Your choice of transportation plays a crucial role in determining your carbon footprint. For instance, a 15 km daily commute to work on public transport generates an average of 1,464 g of CO₂ emissions. Compared to 3,360 g—twice the volume for a journey the same length by car.
By opting for more sustainable modes of transport, such as cycling, walking, or public transportation, you can significantly reduce your carbon footprint.
Addressing Your Carbon Footprint
One way to compensate for your emissions is by purchasing high-quality carbon credits.
Carbon credits are used to help fund projects that avoid, reduce or remove CO₂ emissions. This includes nature-based solutions such as reforestation and improved forest management, or technology-based solutions such as the production of biochar and carbon capture and storage (CCS).
While carbon credits offer a potential solution for individuals to help reduce global emissions, public awareness remains a significant challenge. A BCG-Patch survey revealed that only 34% of U.S. consumers are familiar with carbon credits, and only 3% have purchased them in the past.
About Carbon Streaming
By financing the creation or expansion of carbon projects, Carbon Streaming Corporation secures the rights to future carbon credits generated by these sustainable projects. You can then purchase these carbon credits to help fund climate solutions around the world and compensate for your own emissions.
Ready to get involved?
>> Learn more about purchasing carbon credits at Carbon Streaming

-

 Energy1 week ago
The World’s Biggest Nuclear Energy Producers
-

 Money2 weeks ago
Which States Have the Highest Minimum Wage in America?
-

 Technology2 weeks ago
Ranked: Semiconductor Companies by Industry Revenue Share
-

 Markets2 weeks ago
Ranked: The World’s Top Flight Routes, by Revenue
-

 Countries2 weeks ago
Population Projections: The World’s 6 Largest Countries in 2075
-

 Markets2 weeks ago
The Top 10 States by Real GDP Growth in 2023
-

 Demographics2 weeks ago
The Smallest Gender Wage Gaps in OECD Countries
-

 United States2 weeks ago
Where U.S. Inflation Hit the Hardest in March 2024