Money
The Richest People in the World in 2021


Visualizing the Richest People in the World
Over $890 billion has been amassed by the ten wealthiest people since March 2020.
To put that into perspective, that’s more than the entire economic output of Sweden, Turkey, or Saudi Arabia. As just one example, Elon Musk witnessed his wealth increase at least 1,116% in the last year and a half. Meanwhile, Amazon’s Jeff Bezos has earned an additional $89 billion.
With data from the Forbes Real-Time Billionaires List, we navigate how the wealth of various uber-affluent groups have changed since the beginning of the pandemic.
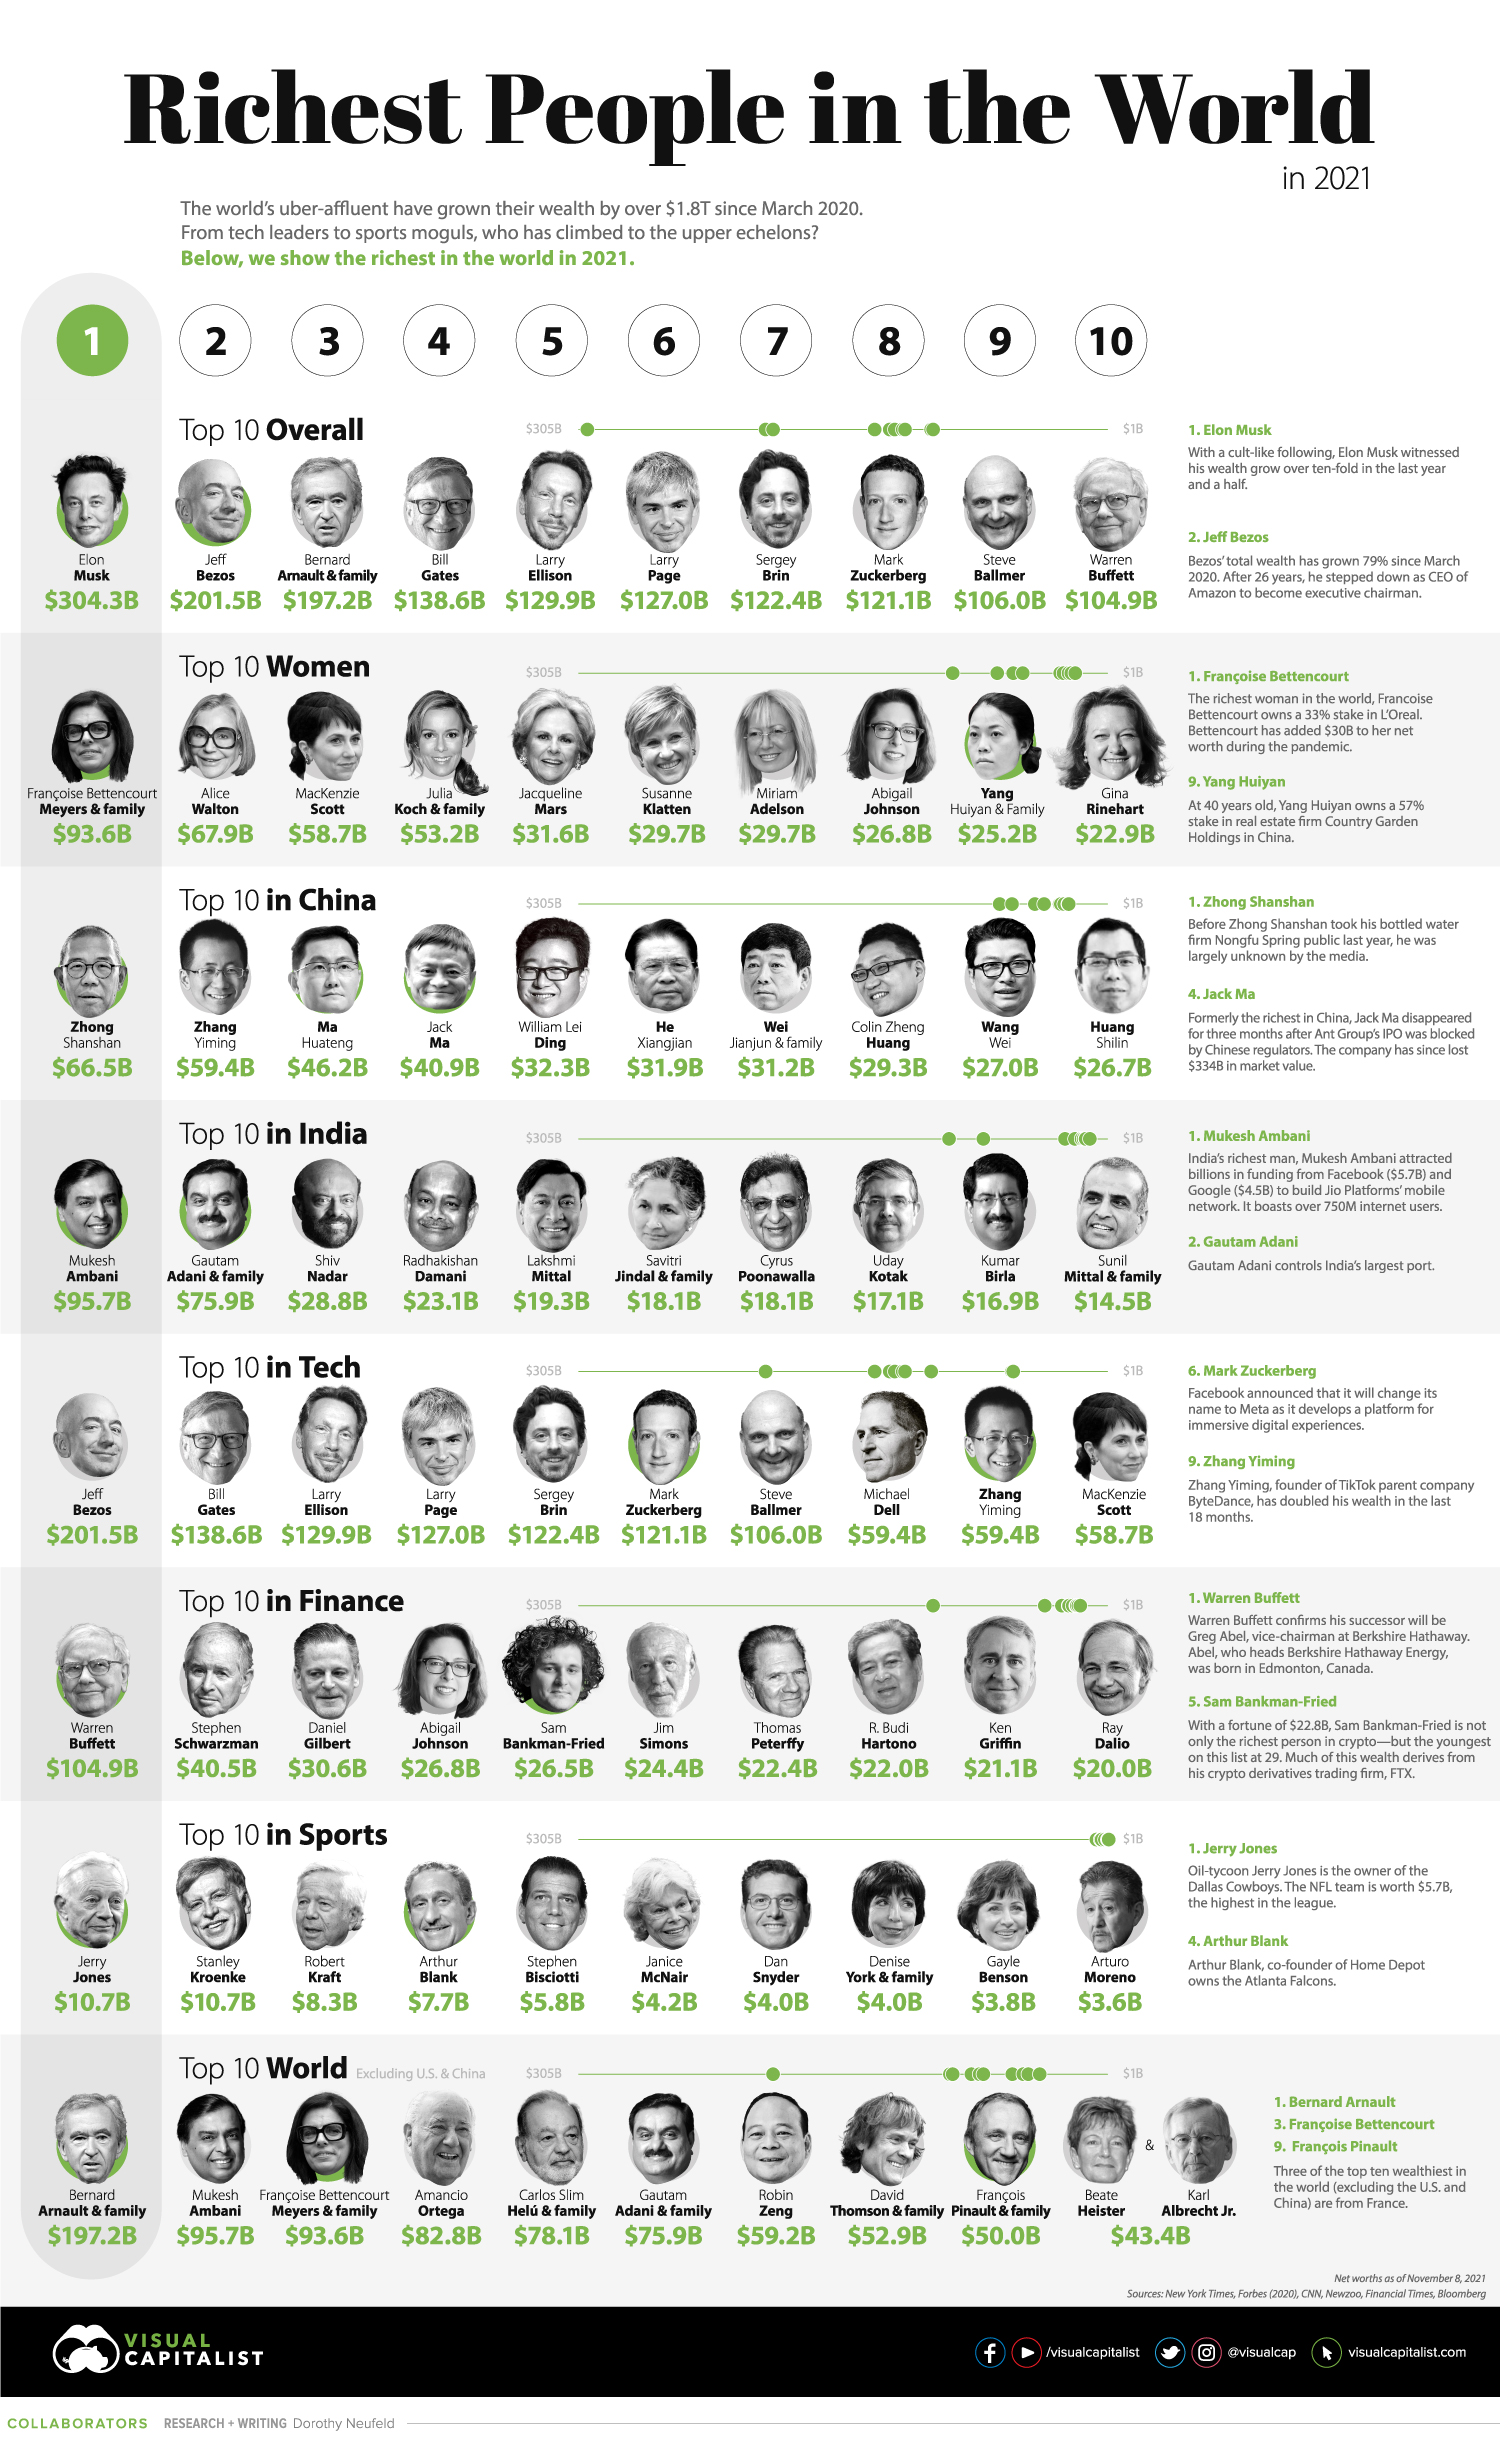
The 10 Richest People in the World
With a net worth of $304 billion, Elon Musk is the wealthiest in the world.
Boosting his wealth is a $100 billion valuation of SpaceX. Since February, its valuation has jumped roughly $25 billion, placing it among the most valuable private companies worldwide. The majority of Musk’s wealth, however, derives from Tesla, which recently moved its headquarters from California to Austin, Texas.
Based on data as of November 8, 2021 here are the ten wealthiest individuals worldwide:
| Rank | Name | Source | Net Worth Nov 2021 | Net Worth Mar 2020 | Change 2020-2021 |
|---|---|---|---|---|---|
| 1 | Elon Musk | Tesla, SpaceX | $301B | $25B | $276B |
| 2 | Jeff Bezos | Amazon | $202B | $113B | $89B |
| 3 | Bernard Arnault & family | LVMH | $197B | $76B | $121B |
| 4 | Bill Gates | Microsoft | $139B | $98B | $41B |
| 5 | Larry Ellison | Oracle | $130B | $59B | $71B |
| 6 | Larry Page | $127B | $51B | $76B | |
| 7 | Sergey Brin | $122B | $49B | $73B | |
| 8 | Mark Zuckerberg | Meta (Facebook) | $121B | $55B | $66B |
| 9 | Steve Ballmer | Microsoft | $106B | $69B | $37B |
| 10 | Warren Buffett | Berkshire Hathaway | $105B | $68B | $37B |
Top 10 Wealth Growth
Since the onset of the pandemic, Musk has seen his wealth grow the fastest out of the top 10. Over the third quarter of 2021, Tesla net income topped $1.6 billion—a company record. This surge helped the entrepreneur become the first person to cross the $300 billion net worth threshold.
Yet once again, Musk surpassed Jeff Bezos as the richest person in the world. This is impressive, since Jeff Bezos’s wealth ballooned over 79% in the same time frame. Similarly, Zuckerberg, Gates, and Buffett have all seen double or triple-digit growth.
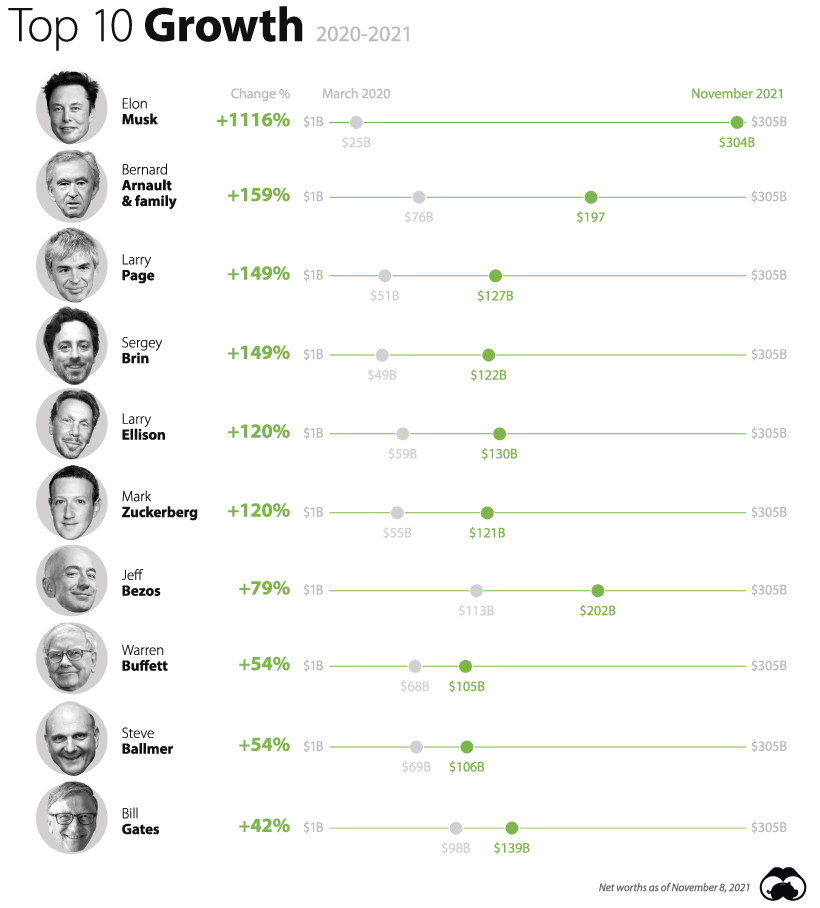
Following Musk and Bezos is Bernard Arnault, known as “The Wolf in Cashmere”. The French magnate has made over $121 billion spurred by a 43% jump in LVMH revenues over 2021. Earlier this year, LVMH closed a $15.8 billion acquisition of jewelry retailer Tiffany & Co.
On average, the top 10 richest have seen gains of 204% over the course of the pandemic. Unsurprisingly, the majority were in tech.
Who’s In and Who’s Out?
As of early August, Rihanna joins the billionaire’s club with an estimated $1.7 billion net worth.
Thanks to the rapid ascent of Fenty Beauty (of which she owns a 50% stake), Rihanna is the second-wealthiest female entertainer in the world, following Oprah at $2.7 billion. The company is focused on inclusivity, offering a broad set of products for every skin type. Launched in 2017 with LVMH (who owns the other 50% stake), Fenty Beauty currently sits at a $2.8 billion valuation.
By contrast, last year’s youngest billionaire, Kylie Jenner, fell off the list after allegedly inflating her net worth. Interestingly, the Kardashian’s took great lengths to show Forbes the extent of her wealth, including showing them their tax returns along with invitations to their mansions.
Still, Jenner’s net worth stands at roughly $700 million.
A New Gilded Age?
Given the staggering growth of the ultra-wealthy in recent years, today’s wealth concentration is now comparable to America’s Gilded Age.
At the time, John D. Rockefeller was the richest person in the world—worth roughly $285 billion in today’s terms. His businesses produced 1.6% of total U.S. economic output.
By comparison, Elon Musk, at over $304 billion, still has a little ways to go just yet.
The data and graphics were last updated on November 8th, 2021.


Money
Charted: Which City Has the Most Billionaires in 2024?
Just two countries account for half of the top 20 cities with the most billionaires. And the majority of the other half are found in Asia.


Charted: Which Country Has the Most Billionaires in 2024?
This was originally posted on our Voronoi app. Download the app for free on iOS or Android and discover incredible data-driven charts from a variety of trusted sources.
Some cities seem to attract the rich. Take New York City for example, which has 340,000 high-net-worth residents with investable assets of more than $1 million.
But there’s a vast difference between being a millionaire and a billionaire. So where do the richest of them all live?
Using data from the Hurun Global Rich List 2024, we rank the top 20 cities with the highest number of billionaires in 2024.
A caveat to these rich lists: sources often vary on figures and exact rankings. For example, in last year’s reports, Forbes had New York as the city with the most billionaires, while the Hurun Global Rich List placed Beijing at the top spot.
Ranked: Top 20 Cities with the Most Billionaires in 2024
The Chinese economy’s doldrums over the course of the past year have affected its ultra-wealthy residents in key cities.
Beijing, the city with the most billionaires in 2023, has not only ceded its spot to New York, but has dropped to #4, overtaken by London and Mumbai.
| Rank | City | Billionaires | Rank Change YoY |
|---|---|---|---|
| 1 | 🇺🇸 New York | 119 | +1 |
| 2 | 🇬🇧 London | 97 | +3 |
| 3 | 🇮🇳 Mumbai | 92 | +4 |
| 4 | 🇨🇳 Beijing | 91 | -3 |
| 5 | 🇨🇳 Shanghai | 87 | -2 |
| 6 | 🇨🇳 Shenzhen | 84 | -2 |
| 7 | 🇭🇰 Hong Kong | 65 | -1 |
| 8 | 🇷🇺 Moscow | 59 | No Change |
| 9 | 🇮🇳 New Delhi | 57 | +6 |
| 10 | 🇺🇸 San Francisco | 52 | No Change |
| 11 | 🇹🇭 Bangkok | 49 | +2 |
| 12 | 🇹🇼 Taipei | 45 | +2 |
| 13 | 🇫🇷 Paris | 44 | -2 |
| 14 | 🇨🇳 Hangzhou | 43 | -5 |
| 15 | 🇸🇬 Singapore | 42 | New to Top 20 |
| 16 | 🇨🇳 Guangzhou | 39 | -4 |
| 17T | 🇮🇩 Jakarta | 37 | +1 |
| 17T | 🇧🇷 Sao Paulo | 37 | No Change |
| 19T | 🇺🇸 Los Angeles | 31 | No Change |
| 19T | 🇰🇷 Seoul | 31 | -3 |
In fact all Chinese cities on the top 20 list have lost billionaires between 2023–24. Consequently, they’ve all lost ranking spots as well, with Hangzhou seeing the biggest slide (-5) in the top 20.
Where China lost, all other Asian cities—except Seoul—in the top 20 have gained ranks. Indian cities lead the way, with New Delhi (+6) and Mumbai (+3) having climbed the most.
At a country level, China and the U.S combine to make up half of the cities in the top 20. They are also home to about half of the world’s 3,200 billionaire population.
In other news of note: Hurun officially counts Taylor Swift as a billionaire, estimating her net worth at $1.2 billion.

-

 Education1 week ago
How Hard Is It to Get Into an Ivy League School?
-

 Technology2 weeks ago
Ranked: Semiconductor Companies by Industry Revenue Share
-

 Markets2 weeks ago
Ranked: The World’s Top Flight Routes, by Revenue
-

 Demographics2 weeks ago
Population Projections: The World’s 6 Largest Countries in 2075
-

 Markets2 weeks ago
The Top 10 States by Real GDP Growth in 2023
-

 Demographics2 weeks ago
The Smallest Gender Wage Gaps in OECD Countries
-

 Economy2 weeks ago
Where U.S. Inflation Hit the Hardest in March 2024
-

 Green2 weeks ago
Top Countries By Forest Growth Since 2001